Page 1 of 13 Original Article
Risk of second primary malignancy after non-small cell lung
cancer: a competing risk nomogram based on the SEER database
Huaqiang Zhou1,2#, Jiayi Shen2#, Yaxiong Zhang1,2#, Yan Huang1#, Wenfeng Fang1, Yunpeng Yang1, Shaodong Hong1, Jiaqing Liu2, Wei Xian2, Zhonghan Zhang1, Yuxiang Ma3, Ting Zhou1, Hongyun Zhao1, Li Zhang1
1Department of Medical Oncology, Sun Yat-sen University Cancer Center, State Key Laboratory of Oncology in South China, Collaborative
Innovation Center for Cancer Medicine, Guangzhou 510060, China; 2Zhongshan School of Medicine, Sun Yat-sen University, Guangzhou 510060,
China; 3Department of Clinical Research, Sun Yat-sen University Cancer Center, State Key Laboratory of Oncology in South China, Collaborative
Innovation Center for Cancer Medicine, Guangzhou 510060, China
Contributions: (I) Conception and design: L Zhang, H Zhou, J Shen, Y Zhang; (II) Administrative support: L Zhang, Y Huang; (III) Provision of study materials or patients: H Zhou, J Shen; (IV) Collection and assembly of data: H Zhou, J Shen, Y Zhang; (V) Data analysis and interpretation: H Zhou, J Shen, Y Zhang, L Zhang; (VI) Manuscript writing: All authors; (VII) Final approval of manuscript: All authors.
#These authors contributed equally to this work.
Correspondence to: Li Zhang. Department of Medical Oncology, Sun Yat-sen University Cancer Center, 651 Dongfeng Road East, Guangzhou 510060, China. Email: [email protected].
Background: With the improvement of survival for non-small cell lung cancer (NSCLC), research focused on second primary malignancy (SPM) in NSCLC survivors is becoming urgent. This study aimed to estimate the risk of SPM in NSCLC patients.
Methods: We retrospectively analysed NSCLC patients diagnosed between 2004 and 2010 in SEER database. We firstly evaluated the crude and cumulative incidence of SPM. SPM incidence in NSCLC survivors compared to that in the reference population was calculated as standardized incidence ratio (SIR). A competing risk nomogram was also built, to predict the incidence of SPM.
Results: The crude and 10-year cumulative incidences of SPM were 4.04% and 5.05%, respectively, while the SIR was 1.62. The nomogram was well calibrated and had good discriminative ability, with c-index of 0.80. It showed a significantly wide interval of SPM cumulative incidence between the first and tenth-decile according to the risk model (1.04% vs. 16.70%, P<0.05). The decision curve analysis indicated that the clinical net benefit of risk model was larger than that in other scenarios (all-screening or no-screening) in a range of threshold probabilities (1% to 20%).
Conclusions: Our study firstly performed a systematic estimation of the incidence of SPM in NSCLC, which implied the necessity of a risk predicting model. We developed the first competing risk nomogram to predict the risk of SPM, which performed well in the evaluation and might be helpful for individualized SPM screening.
Keywords: Neoplasms; second primary carcinoma; non-small cell lung cancer (NSCLC); SEER program; risk
Submitted May 13, 2019. Accepted for publication Aug 15, 2019. doi: 10.21037/atm.2019.09.01
View this article at: http://dx.doi.org/10.21037/atm.2019.09.01
Introduction
Lung cancer is the second most common cancer and the primary cause of cancer mortality in US (1). The number of new cases and deaths of lung cancer in US are estimated
because of the improvement in treatment and medical care for NSCLC patients (2). With the improvement of survival for NSCLC, studies on second primary malignancy (SPM) in survivors from NSCLC patients are becoming urgent. A single-center study of 569 patients showed that the incidence for SPM in resected stage I NSCLC was 15% (3). Another research also reported an observed/ expected (O/E) ratio (2.04) of SPM for patients with stage IA NSCLC in the United States (US) (4). While in stage III NSCLC patients successfully treated with chemo-radiotherapy, the O/E ratio was 2.8, which increased with time (5). Hu et al. reported that 1,412 (3.33%) survivors from initial primary lung cancer developed metachronous second primary lung cancer (6). Besides, when considering about SPM, researchers mainly focus on the second primary lung cancer, but actually SPMs are not just limited at lung, but also involved other organs, which occupy a substantial proportion (7). Although there are several studies about SPM on patients with certain stage NSCLC (3-5), comprehensive evaluation of SPM in all stages of NSCLC patients is still warranted. Considering the increasing number of survivors from NSCLC, a risk predicting model for SPM in NSCLC patients is particularly needed for the guidance of screening.
The present study was designed to evaluate the risk of SPM in NSCLC patients utilizing the SEER database and identify the clinical and demographic factors associated with SPM risk. We tried to produce a competing risk nomogram to predict SPM in NSCLC patients based on subdistribution hazard methods. Moreover, we also
estimated the risk-stratification ability and clinical utility of
the risk predicting nomogram.
Methods
Data sources
The National Cancer Institute’s Surveillance, Epidemiology, and End Results (SEER) database is a population-based database that assembles data related to demographic, incidence and survival of cancer patients in the US. SEER-13 registries consist of patients from Atlanta, Connecticut, Detroit, Hawaii, Iowa, New Mexico, San Francisco-Oakland, Seattle-Puget Sound, Utah, Los Angeles, San Jose-Monterey, Rural Georgia and the Alaska Native Tumor Registry, which covers approximately 13.4% of the population in the US. Specifically, we extracted data from the SEER-13 registries database (https://seer.cancer.
gov/) by using the SEER*Stat software version 8.3.5 (accession number: 13693-Nov2015), to estimate the risk of SPM in patients whose initial primary cancers (IPC) are NSCLC (8,9).
Population cohort
We retrieved all records of patients diagnosed with NSCLC as IPC between January 2004 and December 2010. The study cohort composed of patients with the following
International Classification of Diseases for Oncology, Third
Edition (ICD-O-3), morphology codes: 8012/3, 8046/3, 8070/3, 8140/3, 8240/3, 8250/3, 8560/3 and 9053/3; and the site codes: C33.9, C34.0, C34.1, C34.2, C34.3, C34.8 and C34.9 (10). The exclusion criteria were as follows: (I) age at diagnosis younger than 18 years; (II) patients with incomplete survival data and follow-up information; and (III)
patients with only autopsy or death certificate records. The
year 2004 was selected as the first year of the study given that several employed covariates were introduced in SEER in 2004 [American Joint Committee on Cancer: AJCC Staging Manual (6th edition), http://www.cancerstaging. org] (11). The year 2014 was set as the follow-up cutoff date, ensuring that all included cases were followed up for at least 4 years. Demographic and clinicopathological data extracted from SEER database included age, gender, race, marital status, IPC tumor site, tumor size, histologic type, histologic grade, summary stage, TNM stage, surgery history, follow-up information and SPM.
Definition of SPM
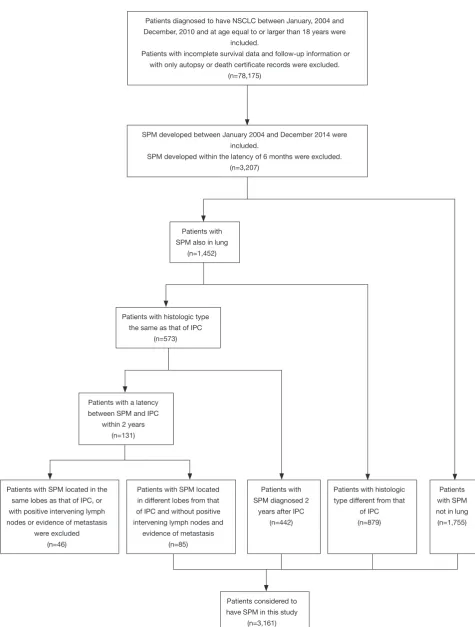
SPM of NSCLC is defined as a second primary cancer with more than 6 months latency between SPM and IPC based on Warren and Gates criteria (12). In addition, as is proposed by Nael Martini and Myron R Melamed, a second malignancy in lung specially can be considered to be SPM if it fits any of the three criteria listed below: (I) the histologic results of SPM and IPC are different; (II) the latency between SPM and IPC is more than 2 years; (III) the two tumors are located in different lobe and there is no record of positive intervening lymph nodes and evidence of metastasis (13). The selection criteria were summarized in
Figure S1.
Statistical analysis
of SPM cases among overall patients. The incidence of SPM was compared to the expected incidence computed using age-specific rates from a reference population in the calculation of standardized incidence ratio (SIR) and 95% confidence interval (CI). We calculated SIR of SPM by SEER*Stat MP-SIR session. In consideration of the different incidences and therapies outcomes between squamous cell carcinoma (SCC) (23.1%) and adenocarcinoma (ADC) (44.3%), we then analyzed SPM in patients with NSCLC overall and different histological groups respectively. In addition, we also analyzed how SPM are influenced by some demographic or clinical factors. Demographic and clinical factors considered here were site of SPM, age at diagnosis of IPC, gender, race, summary stage of IPC, latency and attained calendar year of IPC.
We adopted a proportional subdistribution hazards regression to obtain unbiased estimates of the risk of SPM in the presence of competing risks, in order to identify the clinical and demographic factors associated with SPM risk (14). We regarded SPM and any cause of death as two competing events in our competing-risk analysis. We used the cumulative incidence function (CIF) to show the probability for each event. The differences in CIF between the groups were estimated by Gray’s test. The variables to be included in the final prediction model were selected based on the Bayesian information criterion (15). Nomogram has been suggested as a reliable tool to quantify the risk (16-19). We then built a competing-risk nomogram based on Fine and Gray’s model to predict the 3-, 5-, 10-year probability for patients with SPM. Model performance was evaluated by discrimination and calibration using a bootstrap cross-validation approach with 100 bootstrap resamples. We used the index of probability of concordance between predicted probability and response (c-index) to evaluate discrimination. Calibration was evaluated using a calibration plot. We also examined the risk
stratification ability of the model because of some criticisms
of the c-index (20-22). Estimated risks are useful to identify the high-risk individuals for prevention. We divided patients into 10 groups by deciles based on estimated risks. We then estimated CIF for each group using the Gray method and compared them across the deciles (23). In order to assess the potential clinical utility of our prediction nomogram, we
applied decision curve analysis by calculating its net benefit
(24,25). A model is clinically useful if the application of the
model produces a larger net benefit (24).
All statistical analyses were performed using R version
3.4.2 software (Institute for Statistics and Mathematics,
Vienna, Austria; www.r-project.org). Statistical significance
was set at two-sided P<0.05.
Results
Population characteristic and SPM incidence
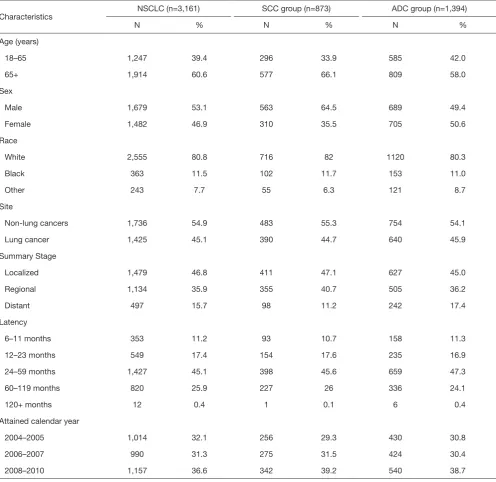
We identified 78,175 eligible NSCLC patients diagnosed between 2004 and 2010. Characteristics of the study population are listed in Table 1. The median follow-up was 10 months from the diagnosis of IPC (interquartile range, 3–32 months). There were 3,161 (4.04%) patients developing SPM during the follow-up period. The crude incidence of SPM is greater in NSCLC patients with the following characteristics, such as age at 60–74 (4.99%), female (4.09%), white (4.28%), married (4.54%), middle lung lobe (4.93%), small tumor size (1–2 cm, 9.05%), bronchioloalveolar (10.02%), well-differentiated (I–II, 7.78%), localized (11.18%), early stage (IA 13.48%, IB 10.65%) and surgery history (11.85%). A vast majority of the SPM is solid tumors. It’s worth noting that the sites of SPM are not only limited to the lung (1,425/3,161, 45.1%), but also other organs (1,736/3,161, 54.9%) (Table S1).
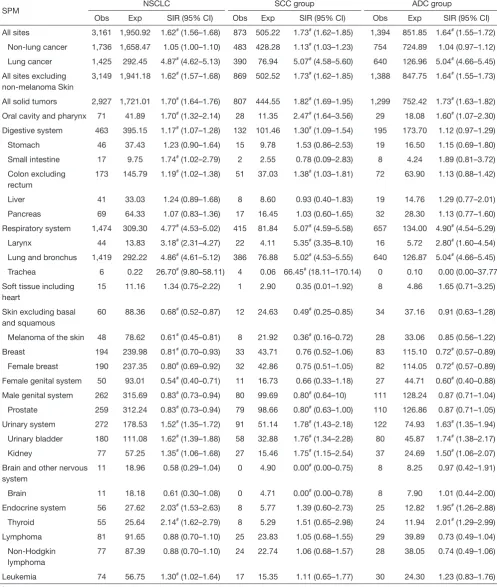
The SIR of SPM among NSCLC patients were listed in Table 2. SIR in overall NSCLC patients, SCC group and ADC group were 1.62, 1.73 and 1.64 respectively. The SIR of second primary lung cancer (4.87) was higher than that of other sites, followed by larynx (3.18) and thyroid (2.14) cancers. We also analyzed the SIR in different subgroups,
classified by clinical or demographic factors. SIR in patients
whose NSCLC were diagnosed at 18–65 years old was higher than that in patients diagnosed at 65+ years old (2.08 vs. 1.42; Table S2). Higher SIR was observed in female patients (1.71; Table S3). There was higher SIR for NSCLC patients who were black than white or other (American
Indian/AK Native, Asian/Pacific Islander) (1.80 vs. 1.61 vs.
1.53; Table S4). Those with localized IPC got the highest SIR (1.84; Table S5). In NSCLC patients, SIR of developing SPM during the latency of 6–11 months and 12–23 months were seen to be similar and relatively low, and SIR changed as latency extended (Table S6). The highest SIR belongs to patients with a latency of 60–119 months. SPM incidence has increased with time (Table S7). All these trends can also be observed in both SCC group and ADC groups. Subgroup SIR information was shown in Supplementary Materials in detail (Tables S2-S7).
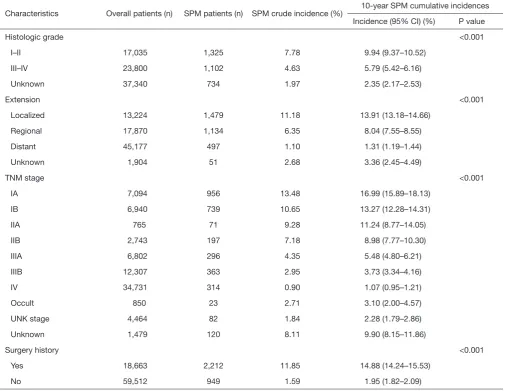
Table 1 Crude incidence and 10-year cumulative incidence of SPM among NSCLC patients
Characteristics Overall patients (n) SPM patients (n) SPM crude incidence (%) 10-year SPM cumulative incidences Incidence (95% CI) (%) P value
Total 78,175 3,161 4.04 5.05 (4.87–5.25)
Age (years) <0.001
<60 18,199 634 3.48 4.62 (4.23–5.03)
60–74 34,532 1,722 4.99 6.22 (5.91–6.54)
75+ 25,444 805 3.16 3.78 (3.50–4.06)
Sex 0.544
Male 41,962 1,679 4.00 4.89 (4.65–5.15)
Female 36,213 1,482 4.09 5.24 (4.95–5.53)
Race <0.001
White 59,670 2,555 4.28 5.31 (5.09–5.53)
Black 9,619 363 3.77 4.85 (4.31–5.42)
Others/unknown 8,886 243 2.73 3.46 (3.02–3.95)
Marital status <0.001
Married 40,104 1,822 4.54 5.70 (5.42–5.99)
Unmarried 38,071 1,339 3.52 4.37 (4.12–4.63)
Anatomic sites (IPC) <0.001
Upper 40,150 1,905 4.74 5.99 (5.70–6.29)
Middle 3,405 168 4.93 5.98 (5.09–6.96)
Lower 19,607 860 4.39 5.41 (5.03–5.81)
Bronchus/others 15,013 228 1.52 1.87 (1.62–2.14)
Size (cm) <0.001
0–1 2,168 176 8.12 10.13 (8.55–11.87)
1–2 9,617 870 9.05 11.33 (10.56–12.13)
2–3 11,670 677 5.80 7.45 (6.85–8.08)
3–4 10,149 454 4.47 5.53 (5.00–6.09)
4–5 7,981 285 3.57 4.17 (3.69–4.69)
5–7 9,869 289 2.93 3.68 (3.24–4.16)
7+ 7,815 158 2.02 2.62 (2.19–3.11)
Unknown 18,906 252 1.33 1.60 (1.39–1.83)
Histologic subtype <0.001
ADC 34,650 1,394 4.02 5.06 (4.78–5.36)
SCC 18,080 873 4.83 6.00 (5.59–6.43)
BAC 2,586 259 10.02 13.23 (11.58–15.00)
ASC 1,177 78 6.63 8.24 (6.48–10.27)
LCC 2,256 78 3.46 3.99 (3.14–4.99)
Others 19,426 479 2.47 3.02 (2.74–3.33)
Table 1 (continued)
Characteristics Overall patients (n) SPM patients (n) SPM crude incidence (%) 10-year SPM cumulative incidences Incidence (95% CI) (%) P value
Histologic grade <0.001
I–II 17,035 1,325 7.78 9.94 (9.37–10.52)
III–IV 23,800 1,102 4.63 5.79 (5.42–6.16)
Unknown 37,340 734 1.97 2.35 (2.17–2.53)
Extension <0.001
Localized 13,224 1,479 11.18 13.91 (13.18–14.66)
Regional 17,870 1,134 6.35 8.04 (7.55–8.55)
Distant 45,177 497 1.10 1.31 (1.19–1.44)
Unknown 1,904 51 2.68 3.36 (2.45–4.49)
TNM stage <0.001
IA 7,094 956 13.48 16.99 (15.89–18.13)
IB 6,940 739 10.65 13.27 (12.28–14.31)
IIA 765 71 9.28 11.24 (8.77–14.05)
IIB 2,743 197 7.18 8.98 (7.77–10.30)
IIIA 6,802 296 4.35 5.48 (4.80–6.21)
IIIB 12,307 363 2.95 3.73 (3.34–4.16)
IV 34,731 314 0.90 1.07 (0.95–1.21)
Occult 850 23 2.71 3.10 (2.00–4.57)
UNK stage 4,464 82 1.84 2.28 (1.79–2.86)
Unknown 1,479 120 8.11 9.90 (8.15–11.86)
Surgery history <0.001
Yes 18,663 2,212 11.85 14.88 (14.24–15.53)
No 59,512 949 1.59 1.95 (1.82–2.09)
NSCLC, non-small cell lung cancer; SPM, second primary malignancy; CI, confidence interval; ADC, adenocarcinoma; SCC, squamous cell carcinoma; BAC, bronchioloalveolar carcinoma; ASC, adenosquamous carcinoma; LCC, large cell carcinoma.
was 5.05% (95% CI: 4.87–5.25%). The 10-year estimates of the cumulative incidence of SPM by age, sex, race, marital status, IPC tumor site, tumor size, histologic type, histologic grade, TNM stage, surgery history was summarized in Table 1. The corresponding CIF curves were plotted in Figure 1. Patients with characteristics of younger age, white race and married were at a higher cumulative incidence of SPM. Small tumor size, earlier TNM stage, well differentiated histological grade, localized, large cell carcinoma and surgery history were also highly related with
higher SPM risk. CIF for SPM did not differ significantly
among different gender.
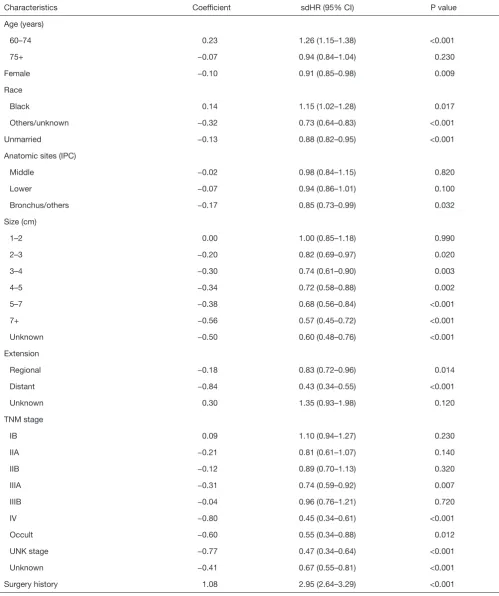
Factors associated with SPM
As the results of competing risk model displayed on
Table 3, the age of IPC diagnosis, sex, race, marital status,
Table 2 SIR for SPM in NSCLC patients
SPM NSCLC SCC group ADC group
Obs Exp SIR (95% CI) Obs Exp SIR (95% CI) Obs Exp SIR (95% CI) All sites 3,161 1,950.92 1.62# (1.56–1.68) 873 505.22 1.73# (1.62–1.85) 1,394 851.85 1.64# (1.55–1.72)
Non-lung cancer 1,736 1,658.47 1.05 (1.00–1.10) 483 428.28 1.13# (1.03–1.23) 754 724.89 1.04 (0.97–1.12)
Lung cancer 1,425 292.45 4.87# (4.62–5.13) 390 76.94 5.07# (4.58–5.60) 640 126.96 5.04# (4.66–5.45)
All sites excluding non-melanoma Skin
3,149 1,941.18 1.62# (1.57–1.68) 869 502.52 1.73# (1.62–1.85) 1,388 847.75 1.64# (1.55–1.73)
All solid tumors 2,927 1,721.01 1.70# (1.64–1.76) 807 444.55 1.82# (1.69–1.95) 1,299 752.42 1.73# (1.63–1.82)
Oral cavity and pharynx 71 41.89 1.70# (1.32–2.14) 28 11.35 2.47# (1.64–3.56) 29 18.08 1.60# (1.07–2.30)
Digestive system 463 395.15 1.17# (1.07–1.28) 132 101.46 1.30# (1.09–1.54) 195 173.70 1.12 (0.97–1.29)
Stomach 46 37.43 1.23 (0.90–1.64) 15 9.78 1.53 (0.86–2.53) 19 16.50 1.15 (0.69–1.80) Small intestine 17 9.75 1.74# (1.02–2.79) 2 2.55 0.78 (0.09–2.83) 8 4.24 1.89 (0.81–3.72)
Colon excluding rectum
173 145.79 1.19# (1.02–1.38) 51 37.03 1.38# (1.03–1.81) 72 63.90 1.13 (0.88–1.42)
Liver 41 33.03 1.24 (0.89–1.68) 8 8.60 0.93 (0.40–1.83) 19 14.76 1.29 (0.77–2.01) Pancreas 69 64.33 1.07 (0.83–1.36) 17 16.45 1.03 (0.60–1.65) 32 28.30 1.13 (0.77–1.60) Respiratory system 1,474 309.30 4.77# (4.53–5.02) 415 81.84 5.07# (4.59–5.58) 657 134.00 4.90# (4.54–5.29)
Larynx 44 13.83 3.18# (2.31–4.27) 22 4.11 5.35# (3.35–8.10) 16 5.72 2.80# (1.60–4.54)
Lung and bronchus 1,419 292.22 4.86# (4.61–5.12) 386 76.88 5.02# (4.53–5.55) 640 126.87 5.04# (4.66–5.45)
Trachea 6 0.22 26.70# (9.80–58.11) 4 0.06 66.45# (18.11–170.14) 0 0.10 0.00 (0.00–37.77)
Soft tissue including heart
15 11.16 1.34 (0.75–2.22) 1 2.90 0.35 (0.01–1.92) 8 4.86 1.65 (0.71–3.25)
Skin excluding basal and squamous
60 88.36 0.68# (0.52–0.87) 12 24.63 0.49# (0.25–0.85) 34 37.16 0.91 (0.63–1.28)
Melanoma of the skin 48 78.62 0.61# (0.45–0.81) 8 21.92 0.36# (0.16–0.72) 28 33.06 0.85 (0.56–1.22)
Breast 194 239.98 0.81# (0.70–0.93) 33 43.71 0.76 (0.52–1.06) 83 115.10 0.72# (0.57–0.89)
Female breast 190 237.35 0.80# (0.69–0.92) 32 42.86 0.75 (0.51–1.05) 82 114.05 0.72# (0.57–0.89)
Female genital system 50 93.01 0.54# (0.40–0.71) 11 16.73 0.66 (0.33–1.18) 27 44.71 0.60# (0.40–0.88)
Male genital system 262 315.69 0.83# (0.73–0.94) 80 99.69 0.80# (0.64–10) 111 128.24 0.87 (0.71–1.04)
Prostate 259 312.24 0.83# (0.73–0.94) 79 98.66 0.80# (0.63–1.00) 110 126.86 0.87 (0.71–1.05)
Urinary system 272 178.53 1.52# (1.35–1.72) 91 51.14 1.78# (1.43–2.18) 122 74.93 1.63# (1.35–1.94)
Urinary bladder 180 111.08 1.62# (1.39–1.88) 58 32.88 1.76# (1.34–2.28) 80 45.87 1.74# (1.38–2.17)
Kidney 77 57.25 1.35# (1.06–1.68) 27 15.46 1.75# (1.15–2.54) 37 24.69 1.50# (1.06–2.07)
Brain and other nervous system
11 18.96 0.58 (0.29–1.04) 0 4.90 0.00# (0.00–0.75) 8 8.25 0.97 (0.42–1.91)
Brain 11 18.18 0.61 (0.30–1.08) 0 4.71 0.00# (0.00–0.78) 8 7.90 1.01 (0.44–2.00)
Endocrine system 56 27.62 2.03# (1.53–2.63) 8 5.77 1.39 (0.60–2.73) 25 12.82 1.95# (1.26–2.88)
Thyroid 55 25.64 2.14# (1.62–2.79) 8 5.29 1.51 (0.65–2.98) 24 11.94 2.01# (1.29–2.99)
Lymphoma 81 91.65 0.88 (0.70–1.10) 25 23.83 1.05 (0.68–1.55) 29 39.89 0.73 (0.49–1.04) Non-Hodgkin
lymphoma
77 87.39 0.88 (0.70–1.10) 24 22.74 1.06 (0.68–1.57) 28 38.05 0.74 (0.49–1.06)
Leukemia 74 56.75 1.30# (1.02–1.64) 17 15.35 1.11 (0.65–1.77) 30 24.30 1.23 (0.83–1.76) #, P<0.05. Obs, observed, Exp, expected. NSCLC, non-small cell lung cancer; SPM, second primary malignancy; CI, confidence interval;
Figure 1 Cumulative incidence curves of SPM. SPM, second primary malignancy; LCC, large cell carcinoma; SCC, squamous cell carcinoma; ADC, adenocarcinoma; BAC, bronchioloalveolar carcinoma; ASC, adenosquamous carcinoma; ALL, all patients.
0.08
100 120 100 120 100 120
100 120 100 120 100 120
100 120 100 120 100 120
100 120 100 120 Time since diagnosis (months)
Time since diagnosis (months) Time since diagnosis (months) Time since diagnosis (months)
Time since diagnosis (months) Time since diagnosis (months) Time since diagnosis (months)
Time since diagnosis (months) Time since diagnosis (months) Time since diagnosis (months) Time since diagnosis (months) Time since diagnosis (months) Age
Unmarried
Married UpperMiddle Lower Bronchus/others
Summary stage Histological grade Histological subtypes Unknown
obability of SPM Probability of SPM
Pr
Table 3 Proportional subdistribution hazard models of probabilities of SPM for patients with NSCLC
Characteristics Coefficient sdHR (95% CI) P value
Age (years)
60–74 0.23 1.26 (1.15–1.38) <0.001
75+ −0.07 0.94 (0.84–1.04) 0.230
Female −0.10 0.91 (0.85–0.98) 0.009
Race
Black 0.14 1.15 (1.02–1.28) 0.017
Others/unknown −0.32 0.73 (0.64–0.83) <0.001
Unmarried −0.13 0.88 (0.82–0.95) <0.001
Anatomic sites (IPC)
Middle −0.02 0.98 (0.84–1.15) 0.820
Lower −0.07 0.94 (0.86–1.01) 0.100
Bronchus/others −0.17 0.85 (0.73–0.99) 0.032
Size (cm)
1–2 0.00 1.00 (0.85–1.18) 0.990
2–3 −0.20 0.82 (0.69–0.97) 0.020
3–4 −0.30 0.74 (0.61–0.90) 0.003
4–5 −0.34 0.72 (0.58–0.88) 0.002
5–7 −0.38 0.68 (0.56–0.84) <0.001
7+ −0.56 0.57 (0.45–0.72) <0.001
Unknown −0.50 0.60 (0.48–0.76) <0.001
Extension
Regional −0.18 0.83 (0.72–0.96) 0.014
Distant −0.84 0.43 (0.34–0.55) <0.001
Unknown 0.30 1.35 (0.93–1.98) 0.120
TNM stage
IB 0.09 1.10 (0.94–1.27) 0.230
IIA −0.21 0.81 (0.61–1.07) 0.140
IIB −0.12 0.89 (0.70–1.13) 0.320
IIIA −0.31 0.74 (0.59–0.92) 0.007
IIIB −0.04 0.96 (0.76–1.21) 0.720
IV −0.80 0.45 (0.34–0.61) <0.001
Occult −0.60 0.55 (0.34–0.88) 0.012
UNK stage −0.77 0.47 (0.34–0.64) <0.001
Unknown −0.41 0.67 (0.55–0.81) <0.001
Surgery history 1.08 2.95 (2.64–3.29) <0.001
distant 0.43). Patients who underwent surgery had a higher SPM incidence, with a sdHR of 2.95 (95% CI: 2.64–3.29), compared with those without surgery. Besides, survivors of IPC had significantly gradually reduced SPM risks as the tumor size increase.
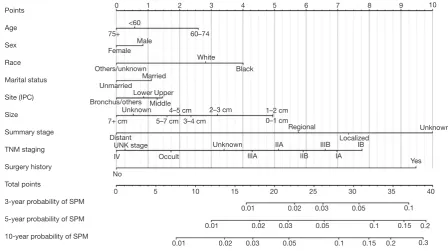
Competing risk nomogram
The nomogram based on Fine and Gray’s model is shown in Figure 2. We can use this predictive tool to predict the probability of 3-, 5-, 10-year SPM events for NSCLC survivors, by calculating the sum of points corresponding to patient’s characteristic.
Evaluation of the model
Our nomogram showed good accuracy with c-index of 0.80, which suggests good model discriminatory ability of the risk predicting model. As shown in Figure S2, the calibration curve was in good concordance with the 45° diagonal line, thus the nomogram was well-calibrated.
The CIF of SPM were estimated for each decile of the estimated risk using our risk model (Figure 3). The lowest CIF belonged to the first decile (1.04%) and the highest
CIF was observed in the tenth decile (16.70%). It shows a wide CIF interval between the first-decile and
tenth-decile group, which has a statistically significant difference
(P<0.05). All these indicated that NSCLC patients can be stratified to different risk groups according to their estimated SPM risk. The model may perform well in figuring out the high-risk NSCLC patients from the survivors of IPC.
We compared the clinical net benefit of the risk model
with those in two alternative scenarios: all-screening and no-screening scenarios. As shown in Figure 4, the net
benefit of our risk model was larger than that in other two
scenarios in a wide range of threshold probabilities (1% to 20%). Screening is recommended if an individual’s risk is above the given risk threshold (selected from 1% to 20%), then the calculated net benefit (the weighted sum of true positives subtracted by the number of false positives) is larger for the prediction model than that in other strategies (all screening or no-screening).
Discussion
Among 3,161 SPM cases from our present study, 1,736 (54.92%) cases were not in lung or bronchus. There were
Figure 2 Competing risk nomogram for predicting 3-, 5- and 10-year cumulative incidence of SPM in NSCLC. SPM, second primary malignancy; IPC, initial primary cancers; NSCLC, non-small cell lung cancer.
2,329 (73.68%) cases occurring within the latency of 6 to 59 months in our study. The SIR of SPM after the initial primary NSCLC was 1.62, which was larger than 1. The SIR which was larger than 1 indicated that patients once diagnosed with initial primary NSCLC are more likely to develop another primary cancer as compared with the
reference population and need surveillance.
Considering the elevated risk of developing SPM after NSCLC, it is necessary to build a risk predicting model for the guidance of screening. There has been a model for the prediction of second primary lung cancer for patients who survived over 5 years after the diagnosis of initial primary lung cancer (26). But we thought this model was significant and yet insufficient. Han’s model mentioned above mainly
focused on the second primary lung cancer. But prediction for SPM from other sites is obviously necessary, because more than half of SPM did not involve lung. Moreover, Han’s model merely predicts SPM developing 5 years after the diagnosis of IPC. However, we found that most of cases occurring within 5 years. Therefore, it is reasonable for us to predict SPM after the 6 months latency for patients diagnosed with IPC, to cover more potential risk population.
Traditional risk predicting models have been well documented, such as those predicting the overall survival of cancer patients. These models were mainly based on Kaplan-Meier method and COX proportional approach, which can handle only one outcome and may produce biased results in the presence of competing risks. However, in the study of SPM, competing risks are especially relevant, because a substantial proportion of the survivors of NSCLC often die as the result of other causes before developing SPM, such as heart disease (10). Therefore, competing risks methods based on the subdistribution hazard function is recommended, instead of the conventional ones (26,27). But
Figure 3 Risk stratification ability of the risk model. (A) Cumulative incidence of SPM by decile of the estimated risk using the risk model; (B) 10-year cumulative incidence of SPM by decile of the estimated risk using the risk model. SPM, second primary malignancy.
0–10%
Observed incidence of SPM (%)
1.3 1.9 1.4 1.8 2.1
0–10% 10–20% 20–30%30–40% 40–50%50–60%60–70%70–80% 80–90%90–100%
A
B
to our knowledge, there is no such risk predicting model for SPM in NSCLC patients presented as nomogram.
In this study, a risk predicting model was set up and presented in intuitive nomogram. Our results have indicated that, patients with IPC diagnosed when aged 60–74 years old, who are black or white, with smaller IPC tumor size, with surgery performed, early TNM stage or localized/ regional extension got higher sdHR for SPM. We observed the trend that patients with factors indicating better prognosis got higher sdHR, which coincides the former report (28). The explanation may be that these patients have more time to develop SPM. Therefore, NSCLC survivors with risk factors, like with IPC diagnosed when aged 60–74 years old, as mentioned above are in high need of intense surveillance for SPM.
Our model performed well in the evaluation. It was of good accuracy, calibration and strong ability in stratifying high-risk individuals from low-risk individuals. In recent years, there has been criticism that c-index is merely an estimation of the accuracy of risk predicting models and is not clinically relevant (24). Reporting c-index only is a neglect of the harm of false-positive result and false-negative result. For example, in situations when false-negative result is considered more harmful, a prediction model with higher sensitivity will be preferable, which c-index does not tell. So, we additionally performed the decision curve analysis for estimation of our model, which is clinically useful. In the
calculation of net benefit, benefit from screening individuals
who turn out to have true-positive result and loss caused by screening individuals who have the false-positive result were taken into consideration, using threshold probability as a reflection of how doctors and patients weight the benefit
and loss mentioned above. Finally, net benefit was presented
with the set threshold probability. In this way, doctors and
patients can refer to the net benefit of our model according
to their threshold probability, for the decision to use or not to use our model.
Our study is based on a large, population-based cohort from SEER database. The sampling error was minimized as compared with data from single-institution based studies. The estimated SIR and the distribution of demographic and clinical factors were closer and more similar to those in the population. What’s more, SEER registers are distributed throughout the US and collect data according to consistent criteria, ensuring the quality of the data.
However, there are still some limitations in our study. Although we fully trust in the quality of records in SEER database, some relapse, intrapulmonary metastasis or
distant metastasis may have been mistaken as SPM, due to the technical difficulty in discriminating between them. For this concern, we deleted 46 SPM records
according to the definition of second primary lung cancer
as has been proposed by Martini N and Melamed MR, which was explained in detail in the part of Material and Methods (13). Moreover, as has been mentioned, we observed that the extrapulmonary SPM sites with the highest SIR were larynx and thyroid, which are not the common sites of distant metastasis of lung cancer. This result may indicate that the SPM records in SEER database are not distant metastasis and are trustworthy. The SEER database does not provide detailed information about the smoking history, working environment, family history, complications, existing diseases, gene mutation, therapy, which may be risk factors of SPM (29-32). There is evidence that hazard ratio (HR) of SPM in radiotherapy-associated sites in early breast cancer patients got higher if radiotherapy was received (33). With these factors considered, our model may have gotten a better performance. The predicting model was built based on data collected in the US. The application of this model in other nations may cause some unknown bias. However, this study still helps figure out the potential risk factors of SPM after NSCLC in different national settings, and patients in different countries can simply get access to their estimated probability of SPM using our nomogram. Notably, the predicted risk based on our nomogram is only a reference, not an absolutely accurate prediction. Although it demonstrates a satisfactory performance when we used a bootstrap approach for internal validation, external validation based on external patient cohorts is still needed. That will be a major part in our future research.
Conclusions
In the present study, we firstly provided a systematic estimation of SPM in NSCLC patients using a large population-based cohort from the SEER database.
Moreover, we developed the first competing risk nomogram
to predict the risk of SPM, which might be a convenient and predictive tool for individualized SPM screening. Further external validation is warranted.
Acknowledgments
registries in providing high quality open resources for researchers. The authors would like to thank the editors and the anonymous reviewer for their valuable comments and suggestions to improve the quality of the paper.
Funding: This work was supported by the National Key
R&D Program of China (Grant No. 2016YFC0905500, 2016YFC0905503); Science and Technology Program of Guangdong (Grant No. 2017B020227001); Science and Technology Program of Guangzhou (Grant No. 201704020072).
Footnote
Conflicts of Interest: The authors have no conflicts of interest
to declare.
Ethical Statement: The authors are accountable for all
aspects of the work in ensuring that questions related to the accuracy or integrity of any part of the work are appropriately investigated and resolved. Institutional review board approval was waived for this study because SEER database is a public anonymized database. The author Zhou. has gotten the access to the SEER database (accession number: 13693-Nov2015). The authors are accountable for all aspects of the work.
References
1. Siegel RL, Miller KD, Jemal A. Cancer statistics, 2018. CA Cancer J Clin 2018;68:7-30.
2. Xia W, Yu X, Mao Q, et al. Improvement of survival for non-small cell lung cancer over time. Onco Targets Ther 2017;10:4295-303.
3. Rice D, Kim HW, Sabichi A, et al. The risk of second primary tumors after resection of stage I nonsmall cell lung cancer. Ann Thorac Surg 2003;76:1001-7; discussion 1007-8.
4. Khanal A, Uprety D, Basnet B, et al. Risk of second primary malignancy in patient with stage IA non-small cell lung cancer in US. J Clin Orthod 2016;34:e20027. 5. Kawaguchi T, Matsumura A, Iuchi K, et al. Second
primary cancers in patients with stage III non-small cell lung cancer successfully treated with chemo-radiotherapy. Jpn J Clin Oncol 2006;36:7-11.
6. Hu ZG, Li WX, Ruan YS, et al. Incidence trends and risk prediction nomogram of metachronous second primary lung cancer in lung cancer survivors. PLoS One 2018;13:e0209002.
7. Duchateau CS, Stokkel MP. Second primary tumors involving non-small cell lung cancer: prevalence and its influence on survival. Chest 2005;127:1152-8.
8. National Cancer Institute. Surveillance, Epidemiology, and End Results Program. SEER*Stat software version 8.3.5, 2018. Available online: http://www.seer.cancer.gov/ seerstat. Accessed May 08, 2018.
9. National Cancer Institute. Surveillance, Epidemiology, and End Results (SEER) Program (www.seer.cancer.gov) SEER*Stat Database: Incidence - SEER 18 Regs Research Data + Hurricane Katrina Impacted Louisiana Cases, Nov 2016 Sub (1973-2014 varying) - Linked To County Attributes - Total U.S., 1969-2015 Counties, National Cancer Institute, DCCPS, Surveillance Research Program, Surveillance Systems Branch, released April 2017, based on the November 2016 submission. Available online: https:// seer.cancer.gov/data/. Accessed May 08, 2018.
10. Zhou H, Zhang Y, Qiu Z, et al. Nomogram to Predict Cause-Specific Mortality in Patients With Surgically Resected Stage I Non-Small-Cell Lung Cancer: A Competing Risk Analysis. Clin Lung Cancer 2018;19:e195-203.
11. Aizer AA, Chen MH, McCarthy EP, et al. Marital status and survival in patients with cancer. J Clin Oncol 2013;31:3869-76.
12. Warren S, Gates O. Multiple primary malignant tumors. A survey of the literature and a statistical study. Am J Cancer 1932;16:1358-414.
13. Martini N, Melamed MR. Multiple primary lung cancers. J Thorac Cardiovasc Surg 1975;70:606-12.
14. Fine JP, Gray RJ. A proportional hazards model for the subdistribution of a competing risk. J Am Stat Assoc 1999;94:496-509.
15. Kuk D, Varadhan R. Model selection in competing risks regression. Stat Med 2013;32:3077-88.
16. She Y, Zhao L, Dai C, et al. Development and validation of a nomogram to estimate the pretest probability of cancer in Chinese patients with solid solitary pulmonary nodules: A multi-institutional study. J Surg Oncol 2017;116:756-62. 17. Han DS, Suh YS, Kong SH, et al. Nomogram predicting
long-term survival after d2 gastrectomy for gastric cancer. J Clin Oncol 2012;30:3834-40.
validation of a nomogram for predicting survival in patients with resected non-small-cell lung cancer. J Clin Oncol 2015;33:861-9.
20. Lobo JM, Jiménez-Valverde A, others. AUC: a misleading measure of the performance of predictive distribution models. Glob Ecol Biogeogr 2008;17:145-51. 21. Cook NR, Ridker PM. Advances in measuring the
effect of individual predictors of cardiovascular risk: the role of reclassification measures. Ann Intern Med 2009;150:795-802.
22. Chatterjee N, Shi J, García-Closas M. Developing and evaluating polygenic risk prediction models for stratified disease prevention. Nat Rev Genet 2016;17:392-406. 23. Gray RJ. A class of K-sample tests for comparing the cumulative incidence of a competing risk. Ann Stat 1988;16:1141-54.
24. Vickers AJ, Elkin EB. Decision curve analysis: a novel method for evaluating prediction models. Med Decis Making 2006;26:565-74.
25. Fitzgerald M, Saville BR, Lewis RJ. Decision curve analysis. JAMA 2015;313:409-10.
26. Han SS, Rivera GA, Tammemägi MC, et al. Risk Stratification for Second Primary Lung Cancer. J Clin Oncol 2017;35:2893-9.
27. Andersen PK, Geskus RB, de Witte T, et al. Competing risks in epidemiology: possibilities and pitfalls. Int J Epidemiol 2012;41:861-70.
28. Grundmann RT, Meyer F. Second primary malignancy among cancer survivors - epidemiology, prognosis and clinical relevance. Zentralbl Chir 2012;137:565-74. 29. Griffiths AJ, Gelbart WM, Miller JH, et al. Mutation and
cancer. New York: W. H. Freeman, 2000.
30. Sasco AJ, Secretan MB, Straif K. Tobacco smoking and cancer: a brief review of recent epidemiological evidence. Lung Cancer 2004;45 Suppl 2:S3-9.
31. Turati F, Edefonti V, Bosetti C, et al. Family history of cancer and the risk of cancer: a network of case–control studies. Ann Oncol 2013;24:2651-6.
32. Liang F, Zhang S, Xue H, et al. Risk of second primary cancers in cancer patients treated with cisplatin: a
systematic review and meta-analysis of randomized studies. BMC Cancer 2017;17:871.
33. Grantzau T, Mellemkjær L, Overgaard J. Second primary cancers after adjuvant radiotherapy in early breast cancer patients: a national population based study under the Danish Breast Cancer Cooperative Group (DBCG). Radiother Oncol 2013;106:42-9.
Patients diagnosed to have NSCLC between January, 2004 and December, 2010 and at age equal to or larger than 18 years were
included.
Patients with incomplete survival data and follow-up information or with only autopsy or death certificate records were excluded.
(n=78,175)
SPM developed between January 2004 and December 2014 were included.
SPM developed within the latency of 6 months were excluded. (n=3,207)
Patients with SPM also in lung
(n=1,452)
Patients with histologic type the same as that of IPC
(n=573)
Patients with a latency between SPM and IPC
within 2 years (n=131)
Patients with SPM located in the same lobes as that of IPC, or with positive intervening lymph nodes or evidence of metastasis
were excluded (n=46)
Patients with SPM located in different lobes from that of IPC and without positive intervening lymph nodes and
evidence of metastasis (n=85)
Patients with SPM diagnosed 2
years after IPC (n=442)
Patients with histologic type different from that
of IPC (n=879)
Patients considered to have SPM in this study
(n=3,161)
Patients with SPM not in lung (n=1,755)
Characteristics NSCLC (n=3,161) SCC group (n=873) ADC group (n=1,394)
N % N % N %
Age (years)
18–65 1,247 39.4 296 33.9 585 42.0
65+ 1,914 60.6 577 66.1 809 58.0
Sex
Male 1,679 53.1 563 64.5 689 49.4
Female 1,482 46.9 310 35.5 705 50.6
Race
White 2,555 80.8 716 82 1120 80.3
Black 363 11.5 102 11.7 153 11.0
Other 243 7.7 55 6.3 121 8.7
Site
Non-lung cancers 1,736 54.9 483 55.3 754 54.1
Lung cancer 1,425 45.1 390 44.7 640 45.9
Summary Stage
Localized 1,479 46.8 411 47.1 627 45.0
Regional 1,134 35.9 355 40.7 505 36.2
Distant 497 15.7 98 11.2 242 17.4
Latency
6–11 months 353 11.2 93 10.7 158 11.3
12–23 months 549 17.4 154 17.6 235 16.9
24–59 months 1,427 45.1 398 45.6 659 47.3
60–119 months 820 25.9 227 26 336 24.1
120+ months 12 0.4 1 0.1 6 0.4
Attained calendar year
2004–2005 1,014 32.1 256 29.3 430 30.8
2006–2007 990 31.3 275 31.5 424 30.4
2008–2010 1,157 36.6 342 39.2 540 38.7
SIR NSCLC SCC group ADC group 18–65 years >65 years 18–65 years >65 years 18–65 years >65 years
All sites 2.08# 1.42# 2.24# 1.55# 2.10# 1.41#
Non-lung cancer 1.23# 0.96 1.42# 1.02 1.17# 0.97
Lung cancer 8.49# 3.72# 8.25# 4.24# 9.05# 3.64#
All sites excluding non-melanoma skin 2.09# 1.42# 2.25# 1.55# 2.11# 1.41#
All solid tumors 2.16# 1.49# 2.31# 1.63# 2.20# 1.49#
Oral cavity and pharynx 1.91# 1.57# 3.13# 2.13# 1.55 1.64
Digestive system 1.52# 1.05 1.94# 1.11 1.32# 1.04
Stomach 1.33 1.20 1.44 1.56 1.65 0.98
Small intestine 2.97# 1.19 1.48 0.53 2.14 1.76
Colon excluding rectum 1.28 1.16 1.36 1.38 1.14 1.12
Liver 2.20# 0.64 1.63 0.54 2.05# 0.79
Pancreas 1.68# 0.88 2.01 0.77 1.81 0.90
Respiratory system 8.17# 3.65# 8.24# 4.22# 8.64# 3.56#
Larynx 4.91# 2.24# 8.62# 3.88# 4.16# 1.96
Lung and bronchus 8.44# 3.72# 8.01# 4.24# 9.06# 3.65#
Trachea 53.25# 13.37# 225.45# 0 0 0
Soft tissue including heart 1.23 1.39 0 0.46 1.99 1.49
Skin excluding basal and squamous 0.65 0.69# 0.33 0.54# 0.94 0.90
Melanoma of the skin 0.66 0.59# 0.35 0.37# 1.01 0.77
Breast 0.88 0.76# 0.78 0.74 0.89 0.60#
Female breast 0.88 0.75# 0.79 0.73 0.90 0.59#
Female genital system 0.66# 0.45# 0.77 0.61 0.63 0.58#
Male genital system 0.91 0.78# 1.02 0.69# 0.78 0.92
Prostate 0.91 0.78# 1.03 0.68# 0.79 0.92
Urinary system 1.82# 1.43# 1.88# 1.75# 2.24# 1.40#
Urinary bladder 2.10# 1.50# 1.86 1.74# 2.81# 1.45#
Kidney 1.48 1.27 1.67 1.78# 1.73 1.36
Brain and other nervous system 0.47 0.63 0 0 0.69 1.12
Brain 0.50 0.66 0 0 0.72 1.17
Endocrine system 2.30# 1.75# 1.28 1.46 2.38# 1.48
Thyroid 2.36# 1.92# 1.37 1.61 2.36# 1.62
Lymphoma 1.29 0.73# 2.00 0.76 0.79 0.70
Non-Hodgkin lymphoma 1.29 0.73# 1.94 0.80 0.84 0.69
Leukemia 1.85# 1.13 1.58 0.98 1.78 1.05
#, P<0.05. SIR, standardized incidence ratio; NSCLC, non-small cell lung cancer; SPM, second primary malignancy; SCC, squamous cell
SIR NSCLC SCC group ADC group
Male Female Male Female Male Female
All sites 1.55# 1.71# 1.64# 1.92# 1.57# 1.70#
Non-lung cancer 1.08# 1.01 1.13# 1.13 1.10 0.98
Lung cancer 4.30# 5.55# 4.58# 6.02# 4.36# 5.73#
All sites excluding non-melanoma skin 1.55# 1.71# 1.64# 1.93# 1.58# 1.70#
All solid tumors 1.63# 1.79# 1.73# 1.99# 1.68# 1.78#
Oral cavity and pharynx 1.78# 1.52 2.35# 2.88# 1.70# 1.43
Digestive system 1.22# 1.11 1.39# 1.13 1.16 1.08
Stomach 1.26 1.17 1.50 1.65 1.02 1.35
Small intestine 1.65 1.86 0.57 1.23 0.91 2.93#
Colon excluding rectum 1.23 1.14 1.55# 1.08 1.19 1.07
Liver 1.31 1.07 1.14 0 1.28 1.29
Pancreas 1.07 1.08 0.95 1.17 1.28 1.00
Respiratory system 4.15# 5.54# 4.50# 6.25# 4.19# 5.66#
Larynx 2.59# 6.21# 3.80# 18.92# 2.36# 4.69#
Lung and bronchus 4.28# 5.54# 4.53# 5.99# 4.36# 5.73#
Trachea 29.80# 22.10# 69.04# 59.73# 0 0
Soft tissue including heart 0.94 1.89 0 1.14 1.16 2.20
Skin excluding basal and squamous 0.55# 0.94 0.42# 0.71 0.69 1.28
Melanoma of the skin 0.48# 0.87 0.29# 0.61 0.68 1.13
Breast 1.52 0.80# 1.18 0.75 0.95 0.72#
Female breast 0 0.80# 0 0.75 0 0.72#
Female genital system 0 0.54# 0 0.66 0 0.60#
Male genital system 0.83# 0 0.80# 0 0.87 0
Prostate 0.83# 0 0.80# 0 0.87 0
Urinary system 1.50# 1.60# 1.68# 2.25# 1.68# 1.51#
Urinary bladder 1.60# 1.69# 1.71# 2.06 1.81# 1.54
Kidney 1.24 1.54# 1.45 2.65# 1.52 1.46
Brain and other nervous system 0.66 0.47 0 0 1.17 0.75
Brain 0.69 0.50 0 0 1.22 0.79
Endocrine system 2.10# 1.99# 1.45 1.33 2.40# 1.76#
Thyroid 2.24# 2.10# 1.64 1.40 2.40# 1.86#
Lymphoma 0.81 0.98 0.93 1.29 0.49# 0.98
Non-Hodgkin lymphoma 0.79 1.00 0.91 1.35 0.46# 1.02
Leukemia 1.18 1.49# 0.91 1.60 1.03 1.49
#, P<0.05. SIR, standardized incidence ratio; NSCLC, non-small cell lung cancer; SPM, second primary malignancy; SCC, squamous cell
SIR NSCLC SCC group ADC group White Black Other White Black Other White Black Other
All sites 1.61# 1.80# 1.53# 1.69# 1.87# 2.07# 1.65# 1.79# 1.39#
Non-lung cancer 1.02 1.31# 0.95 1.09 1.38# 1.17 1.03 1.34# 0.84
Lung cancer 4.94# 4.45# 4.72# 5.05# 4.43# 6.68# 5.22# 4.27# 4.44#
All sites excluding non-melanoma skin 1.61# 1.80# 1.53# 1.69# 1.87# 2.08# 1.65# 1.79# 1.39#
All solid tumors 1.69# 1.89# 1.60# 1.77# 1.97# 2.24# 1.75# 1.85# 1.41#
Oral cavity and pharynx 1.79# 1.58 0.88 2.57# 1.94 1.64 1.71# 1.89 0.54
Digestive system 1.15# 1.46# 1.01 1.31# 1.25 1.28 1.14 1.48 0.75
Stomach 1.25 1.68 0.84 1.40 2.95 0.79 1.21 1.52 0.78
Small intestine 1.57 0.67 6.44# 0.49 0 9.75 2.15 0 2.93
Colon excluding rectum 1.20# 1.21 1.02 1.45# 0.45 2.25 1.16 1.56 0.53
Liver 1.03 2.40# 1.12 0.82 0.81 1.55 0.89 2.57 1.55
Pancreas 1.12 1.13 0.64 1.18 0.53 0 1.19 1.64 0.29
Respiratory system 4.84# 4.34# 4.64# 5.03# 4.62# 6.59# 5.09# 4.04# 4.33#
Larynx 3.21# 3.23# 2.62 4.84# 7.80# 6.18 3.15# 1.14 2.51
Lung and bronchus 4.93# 4.45# 4.68# 5.00# 4.43# 6.45# 5.23# 4.27# 4.44#
Trachea 28.45# 0 52.30# 63.04# 0 304.41# 0 0 0
Soft tissue including heart 1.29 3.32 0 0.4 0 0 1.53 5.08 0
Skin excluding basal and squamous 0.67# 1.36 0.88 0.50# 0 0 0.88 3.18 1.62
Melanoma of the skin 0.59# 2.44 1.40 0.37# 0 0 0.80 5.77 2.57
Breast 0.77# 1.12 0.86 0.66# 1.36 1.33 0.68# 0.98 0.85
Female breast 0.76# 1.09 0.87 0.65# 1.4 1.36 0.67# 1.00 0.85
Female genital system 0.50# 0.99 0.31 0.62 1.15 0 0.52# 1.37 0.50
Male genital system 0.81# 1.08 0.57# 0.72# 1.19 0.92 0.93 0.9 0.32#
Prostate 0.80# 1.08 0.58# 0.72# 1.20 0.93 0.93 0.91 0.32#
Urinary system 1.54# 1.78# 1.02 1.74# 2.22# 1.78 1.64# 2.26# 0.95
Urinary bladder 1.68# 1.27 1.05 1.76# 1.04 3.01 1.86# 1.59 0.57
Kidney 1.22 2.37# 0.96 1.57 3.56# 0 1.24 2.98# 1.75
Brain and other nervous system 0.54 0 1.77 0.00# 0 0 0.84 0 3.21
Brain 0.56 0 1.91 0.00# 0 0 0.87 0 3.46
Endocrine system 1.58# 3.80# 3.94# 1.23 1.94 2.56 1.51 3.70# 3.36#
Thyroid 1.64# 4.28# 4.32# 1.33 2.23 2.88 1.50 4.14# 3.67#
Lymphoma 0.98 0.17# 0.40 1.14 0 0.80 0.84 0.40 0.00#
Non-Hodgkin lymphoma 0.98 0.19 0.42 1.14 0 0.82 0.85 0.43 0.00#
Leukemia 1.18 2.71# 1.47 1.10 1.75 0 0.92 3.53# 2.70
#, P<0.05. SIR, standardized incidence ratio; NSCLC, non-small cell lung cancer; SPM, second primary malignancy; SCC, squamous cell
SIR NSCLC SCC group ADC group
Localized Regional Distant Localized Regional Distant Localized Regional Distant
All sites 1.84# 1.67# 1.15# 1.95# 1.74# 1.19 1.89# 1.71# 1.15#
Non-lung cancer 1.15# 1.03 0.90 1.18# 1.19# 0.83 1.13# 0.98 0.98
Lung cancer 5.72# 5.34# 2.64# 6.08# 4.87# 3.27# 6.09# 5.88# 2.18#
All sites excluding non-melanoma skin
1.85# 1.67# 1.15# 1.95# 1.74# 1.20 1.89# 1.70# 1.15#
All solid tumors 1.94# 1.77# 1.17# 2.01# 1.87# 1.24 2.02# 1.81# 1.15#
Oral cavity and pharynx 2.03# 1.81# 1.06 2.63# 2.53# 2.13 2.46# 1.27 0.87
Digestive system 1.15 1.22# 1.08 1.17 1.68# 0.67 1.10 0.97 1.31
Stomach 1.38 1.00 1.17 1.95 1.27 1.26 0.94 1.07 1.43
Small intestine 1.74 1.46 1.88 0.94 0.97 0 1.79 1.35 1.96
Colon excluding rectum 1.15 1.26 1.13 1.26 1.79# 0.84 1.07 1.14 1.23
Liver 1.42 0.77 1.38 1.49 0.55 0 1.11 0.59 2.01
Pancreas 1.33 1.00 0.80 1.27 0.92 0.77 1.50 0.92 0.90
Respiratory system 5.61# 5.21# 2.59# 6.08# 4.88# 3.30# 5.95# 5.67# 2.15#
Larynx 3.90# 3.18# 2.22 6.76# 4.64# 4.28 3.70# 2.46 2.07
Lung and bronchus 5.71# 5.31# 2.64# 6.05# 4.78# 3.28# 6.10# 5.88# 2.18#
Trachea 21.79# 50.59# 0 40.25# 122.32# 0 0 0 0
Soft tissue including heart 1.07 0.78 2.47 0.82 0 0 1.04 1.19 2.53
Skin excluding basal and squamous
0.58# 0.78 0.66 0.48 0.60 0.27 0.80 0.93 1.04
Melanoma of the skin 0.57# 0.62# 0.62 0.32# 0.44 0.30 0.82 0.78 0.91
Breast 1.00 0.72# 0.58# 1.02 0.68 0.28 0.8 0.68# 0.63#
Female breast 0.99 0.71# 0.59# 0.99 0.69 0.29 0.81 0.66# 0.64
Female genital system 0.62# 0.36# 0.63 0.53 0.80 0.37 0.69 0.32# 0.90
Male genital system 1.00 0.84 0.58# 0.84 0.86 0.52# 1.05 0.96 0.50#
Prostate 1.00 0.84 0.57# 0.85 0.85 0.52# 1.06 0.97 0.48#
Urinary system 1.48# 1.69# 1.37# 1.58# 1.83# 2.24# 1.67# 1.81# 1.35
Urinary bladder 1.66# 1.83# 1.17 1.78# 1.96# 1.19 1.71# 2.03# 1.41
Kidney 1.22 1.37 1.63# 1.12 1.25 4.67# 1.80# 1.61 0.97
Brain and other nervous system 0.76 0.45 0.24 0 0 0 1.55 1.05 0
Brain 0.80 0.47 0.25 0 0 0 1.62 1.09 0
Endocrine system 2.97# 1.27 1.67 1.72 1.26 1.01 2.98# 0.90 1.99
Thyroid 3.10# 1.37 1.80 1.88 1.38 1.10 2.98# 0.97 2.13
Lymphoma 1.17 0.73 0.51# 1.57 0.84 0.27 1.01 0.58 0.42
Non-Hodgkin lymphoma 1.19 0.73 0.43# 1.54 0.88 0.28 1.05 0.53 0.44
Leukemia 1.20 1.27 1.68# 1.36 0.82 1.26 0.81 1.19 2.12#
SIR NSCLC
6–11 months 12–23 months 24–59 months 60–119 months 120+ months
All sites 1.06 1.20# 1.83# 2.20# 1.72
Non-lung cancer 0.92 0.95 1.11# 1.14# 1.01
Lung cancer 1.85# 2.61# 5.89# 8.18# 5.69#
All sites excluding non-melanoma skin 1.06 1.20# 1.83# 2.20# 1.73
All solid tumors 1.12# 1.20# 1.94# 2.32# 1.81
Oral cavity and pharynx 0.85 1.44 2.27# 1.59 0
Digestive system 1.27# 1.02 1.21# 1.17 2.08
Stomach 1.25 1.59 1.07 1.12 0
Small intestine 1.93 2.27 2.03 0.50 0
Colon excluding rectum 1.06 0.95 1.41# 1.14 0
Liver 1.28 1.04 1.36 1.08 8.34
Pancreas 1.36 0.75 0.96 1.36 3.93
Respiratory system 1.88# 2.61# 5.74# 7.91# 6.30#
Larynx 2.38 3.27# 3.50# 2.84# 22.1
Lung and bronchus 1.86# 2.61# 5.86# 8.15# 5.69#
Trachea 0 0 43.94# 43.23# 0
Soft tissue including heart 3.30# 1.56 0.89 0.45 0
Skin excluding basal and squamous 0.50 0.70 0.56# 1.04 0
Melanoma of the skin 0.48 0.68 0.47# 0.93 0
Breast 0.57# 0.66# 0.93 0.92 0
Female breast 0.57# 0.67# 0.91 0.91 0
Female genital system 0.42# 0.43# 0.63# 0.58 0
Male genital system 0.55# 0.71# 1.01 0.95 0
Prostate 0.55# 0.72# 1.01 0.94 0
Urinary system 1.53# 1.33 1.61# 1.58# 1.51
Urinary bladder 1.18 1.32 1.89# 1.78# 2.38
Kidney 2.37# 1.34 0.92 1.36 0
Brain and other nervous system 0.94 0.23 0.39 1.10 0
Brain 0.98 0.24 0.41 1.14 0
Endocrine system 3.85# 2.20# 1.60 1.28 0
Thyroid 4.17# 2.37# 1.62 1.37 0
Lymphoma 0.53 0.95 0.73 1.43 0
Non-Hodgkin lymphoma 0.56 0.89 0.77 1.38 0
Leukemia 0.76 1.47 1.53# 1.13 0
SIR NSCLC SCC group ADC group
2004–2005 2006–2007 2008–2010 2004–2005 2006–2007 2008–2010 2004–2005 2006–2007 2008–2010
All sites 1.56# 1.67# 1.64# 1.59# 1.79# 1.80# 1.61# 1.67# 1.64#
Non-lung cancer 1.00 1.07 1.06 1.04 1.21# 1.13 1.02 1.03 1.07
Lung cancer 4.68# 5.02# 4.93# 4.60# 4.97# 5.55# 4.91# 5.31# 4.94#
All sites excluding non-melanoma skin
1.56# 1.67# 1.64# 1.60# 1.78# 1.80# 1.61# 1.66# 1.64#
All solid tumors 1.64# 1.73# 1.73# 1.69# 1.84# 1.90# 1.72# 1.73# 1.72#
Oral cavity and pharynx 1.78# 1.67# 1.64# 2.88# 2.05 2.46# 1.28 1.87 1.65
Digestive system 1.10 1.29# 1.14 1.04 1.49# 1.37# 1.17 1.16 1.06
Stomach 1.28 1.31 1.11 1.58 1.69 1.37 0.97 1.41 1.10
Small intestine 0 2.41 2.65# 0 1.32 0.98 0 2.44 2.86
Colon excluding rectum 1.07 1.47# 1.05 1.06 1.75# 1.35 1.20 1.20 1.01
Liver 1.54 0.71 1.40 0.38 0.40 1.73 1.61 1.15 1.15
Pancreas 1.15 1.14 0.96 0.98 1.41 0.78 1.50 1.08 0.89
Respiratory system 4.60# 4.91# 4.80# 4.71# 4.87# 5.55# 4.77# 5.18# 4.79#
Larynx 3.45# 3.30# 2.83# 6.78# 3.17 5.91# 2.74 3.48# 2.30
Lung and bronchus 4.66# 4.99# 4.92# 4.57# 4.89# 5.52# 4.92# 5.31# 4.94#
Trachea 28.04# 45.16# 11.5 55.79# 114.44# 40.34# 0 0 0
Soft tissue including heart 1.67 0.59 1.67 0 0 0.88 2.03 0.7 2.05
Skin excluding basal and squamous
0.64 0.64 0.74 0.55 0.4 0.51 0.80 0.82 1.07
Melanoma of the skin 0.61# 0.51# 0.70 0.62 0.15# 0.34# 0.80 0.61 1.05
Breast 0.86 0.82 0.75# 0.73 0.78 0.76 0.85 0.74 0.61#
Female breast 0.86 0.82 0.74# 0.75 0.79 0.71 0.86 0.75 0.59#
Female genital system 0.43# 0.54# 0.63# 0.57 0.61 0.76 0.51 0.69 0.61
Male genital system 0.86 0.73# 0.89 0.92 0.80 0.69 0.75 0.81 1.02
Prostate 0.86 0.72# 0.90 0.90 0.81 0.70 0.76 0.79 1.04
Urinary system 1.44# 1.45# 1.65# 1.51 1.99# 1.84# 1.89# 1.17 1.77#
Urinary bladder 1.49# 1.59# 1.76# 1.27 2.18# 1.84# 2.02# 1.24 1.91#
Kidney 1.51# 0.92 1.55# 2.08 1.28 1.83 1.98# 0.68 1.73#
Brain and other nervous system
0.48 0.69 0.58 0 0 0 0.78 1.62 0.62
Brain 0.50 0.72 0.6 0 0 0 0.81 1.69 0.65
Endocrine system 1.38 2.67# 2.05# 0 2.94 1.28 1.87 2.39# 1.69
Thyroid 1.50 2.75# 2.20# 0 3.21# 1.39 2.02 2.29 1.81
Lymphoma 0.93 1.04 0.71 1.08 1.10 0.98 0.73 0.93 0.58
Non-Hodgkin lymphoma 0.91 1.02 0.74 1.13 1.01 1.03 0.68 0.97 0.60
Leukemia 1.08 1.63# 1.23 0.63 1.50 1.18 0.67 1.67 1.35
#, P<0.05. SIR, standardized incidence ratio; NSCLC, non-small cell lung cancer; SPM, second primary malignancy; SCC, squamous cell carcinoma;
Figure S2 Calibration plot for the risk model. The solid line represents equality between the predicted and observed probability.
18.75
12.5
6.25
0
0 6.25 12.5 18.75 25 Predicted event probability (%)
Observed events pr