Volume 5, No. 3, March-April 2014
International Journal of Advanced Research in Computer Science
RESEARCH PAPER
Available Online at www.ijarcs.info
Open Source Secure Cloud Storage used to Dynamic Load Balancing Model
S.Pragadeeswaran¹, M.Sakthivel²
Assistant Professor, Assistant Professor and Head of The Department 1,2 Department of Computer Science and Engineering
Sengunthar Engineering College-Tiruchengode, India
Abstract: Load balancing in the cloud computing environment has an Essential collision on the recital. load balancing introduce cloud computing more and well-organized and improves user contentment This paper improve a enhanced load balance model for the public cloud based on the cloud partitioning concept with a switch and portioning mechanism to choose different strategies for different situations like Critical warning ,Up , down The mode applies load balancing strategy to improve the efficiency in the public cloud environment.
Using Cloud Storage, users can remotely store their data and enjoy the on-demand high quality applications and services from a shared pool of configurable computing resources without the burden of local data storage and maintenance we are introduce the openstack it provide the single node multi node based on that it generate the token id and tenen id through this resource allocator allocate the requesting resource . assigned resource is in warning or Critical state generate one Interrupt signal to the cloud server by nagios monitoring tool providing web user interface the web user interface along with set of web controls it act as user interface collection . This data information forward to activity work flow in that frame work decide approval or reject with help of development frame work this information forwarded to open stack folson entire state is monitor by nagios monitoring it providing privacy and secure cloud storage . In this paper, we first discuss related works and present the scope of this overview. Also, we outline the main component of openstack and nagios monitoring installation main system model. Resource allocator with controller. challenges of the field as these multi node version the various approaches that are reported in literature. Finally, we briefly describe the most commonly how to interact tenid in multi node in secure cloud storage
Key Words : load balancing model; public cloud; cloud partition; game theory Data storage, open source ,open stack, nagios monitoring state, public Activity work flow ,cloud computing.
I. INTRODUCTION
Cloud computing is an attracting technology in the field of computer science. In Gartner’s report[1], it says that the cloud will bring changes to the IT industry. The cloud is changing our life by providing users with new types of services. Users get service from a cloud without paying attention to the details[2]. NIST gave a definition of cloud computing as a model for enabling ubiquitous, convenient, on-demand network access to a shared pool of configurable computing resources (e.g., networks, servers, storage, applications, and services) that can be rapidly provisioned and released with minimal management effort or service provider interaction [3]. More and more people pay attention to cloud computing [4, 5]. Cloud computing is efficient and scalable but maintaining the stability of processing some any jobs in the cloud computing environment is a very complex problem with load balancing receiving much attention for researchers.
Since the job arrival pattern is not predictable and the capacities of each node in the cloud differ, for load balancing problem, workload control is crucial to improve system performance and maintain stability. Load balancing schemes depending on whether the system dynamics are important can be either static and dynamic[6]. Static schemes do not use the system information and are less complex while dynamic schemes will bring additional costs for the system but can change as the system status changes. A dynamic scheme is used here for its flexibility. The model has a main controller and balancers to gather and analyze the information. Thus, the dynamic control has little influence on the other working nodes. The system status then provides a basis for choosing the right load balancing strategy. The
load balancing model given in this article is aimed at the public cloud which has numerous nodes with distributed computing resources in many different geographic locations. Thus, this model divides the public cloud into several cloud partitions. When the environment is very large and complex, these divisions simplify the load balancing. The cloud has a main controller that chooses the suitable partitions for arriving jobs while the balancer for each cloud partition chooses the best load balancing strategy.
OpenStack Compute is open source software designed to provision and manage large networks of virtual machines, creating a redundant and scalable cloud computing platform. It gives you the software, control panels, and APIs required to orchestrate a cloud, including running instances, managing networks, and controlling access through users and projects. OpenStack Compute strives to be both hardware and hypervisor agnostic, currently supporting a variety of standard hardware con-gurations and seven major hypervisors
II. OPENSTACK COMPONENTS
A. OpenStack Compute (code-name Nova):
B. More Folsom Features:
a. OpenStack Block Storage (code-name Cinder): The first full release of OpenStack Block Storage implements advanced, extensible block and volume storage capabilities, while still supporting previously deployed OpenStack Volumes. Previously a sub-component of OpenStack Compute, the Block Storage capabilities of OpenStack have been promoted to a full project with a dedicated development team that will increase the rate of innovation as the OpenStack development community grows
b. OpenStack Dashboard (code-name Horizon): The second full release of OpenStack Dashboard brings usability improvements in launching Compute instances, working Object Storage resources, and managing OpenStack projects and users. Other feature advances include support for public and private image uploads and management of advanced networks. End users will appreciate better cross-browser support, timezone support, dynamic quota displays, improved error handling, and performance improvements.
c. OpenStack Image Service (code-name Glance): There were major advancements in usability and functionality to the Image Service, including a new API, a new client library, new replication options for increased performance and security improvements reaching from the client to the image storage system.
d. OpenStack Object Storage (code-name Swift): Among many operational enhancements, operators can now connect OpenStack Object Storage to a statsd server and receive hundreds of real-time metrics about their cluster to help with troubleshooting, diagnostics, day-to-day operational issues, and long-term capacity management. To improve performance, clusters with high write requirements or large quantities of stored objects can now take advantage of solid-state drives (SSDs) for storing metadata without incurring a high overhead in disk space. Additionally, the ability to place data in cluster locations that are “as unique-as-possible,” makes it easier to deploy small clusters and provides better flexibility for all clusters when handling hardware failure.
e. OpenStack Networking (code-name Quantum): An advanced network automation platform that empowers users to choose their back-end technology, OpenStack Networking includes support for Open vSwitch, the Ryu open source network operating system, standard Linux bridge networking and commercial solutions from Cisco, Nicira, and NEC via a plug-in architecture. Additionally, the release includes significant updates to control Layer 2 networking, IP address management, API quotas, notifications, extension support for Layer 3 forwarding, Secure Network Address Translation (SNAT), and floating IPs.
f. OpenStack Identity (code-name Keystone):
The second full release of OpenStack Identity brings improved support for Public Key Infrastructure (PKI) authentication and improved integration and management across OpenStack services.–
III. CONCEPTUAL ARCHITECTURE
The OpenStack project as a whole is designed to "deliver(ing) a massively scalable cloud operating system." To achieve this,fig 1 shows each of the constituent services are designed to work together to provide a complete Infrastructure as a Service (IaaS). This integration is facilitated through public application programming interfaces (APIs) that each service offers (and in turn can consume). While these APIs allow each of the services to use another service, it also allows an implementer to switch out any service as long as they maintain the API. These are (mostly) the same APIs that are available to end users of the cloud.
A. Compute:
Figure 1.Openstack conceptual view
Nova is the most complicated and distributed component of OpenStack. A large number of processes cooperate to turn end user API requests into running virtual machines. Below is a list of these processes and their functions: nova-api accepts and responds to end user compute API calls. It supports OpenStack Compute API, Amazon's EC2 API and a special Admin API (for privileged users to perform administrative actions). It also initiates most of the orchestration activities (such as running an instance) as well as enforces some policy (mostly quota checks).
The nova-compute process is primarily a worker daemon that creates and terminates virtual machine instances via hypervisor's APIs (XenAPI for XenServer/XCP, libvirt for KVM or QEMU, VMwareAPI for VMware, etc.). The process by which it does so is fairly complex but the basics are simple: accept actions from the queue and then perform a series of system commands (like launching a KVM instance) to carry them out while updating state in the database.
Cinder, will eventually replace nova-volume functionality. In the Folsom release, nova-volume and the Block Storage service will have similar functionality.
The nova-network worker daemon is very similar to nova-compute and nova-volume. It accepts networking tasks from the queue and then performs tasks to manipulate the network (such as setting up bridging interfaces or changing iptables rules). This functionality is being migrated to Quantum, a separate OpenStack service. In the Folsom release, much of the functionality will be duplicated between nova-network and Quantum.
The nova-schedule process is conceptually the simplest 8piece of code in OpenStack Nova: take a virtual machine instance request from the queue and determines where it should run (specifically, which compute server host it should run on).
The queue provides a central hub for passing messages between daemons. This is usually implemented with RabbitMQ today, but could be any AMPQ message queue (such as Apache Qpid). New to the Folsom release is support for Zero MQ (note: I've only included this so that Eric Windisch won't be hounding me mercilessly about it's omission).
The SQL database stores most of the build-time and run-time state for a cloud infrastructure. This includes the instance types that are available for use, instances in use, networks available and projects. Theoretically, OpenStack Nova can support any database supported by SQL-Alchemy but the only databases currently being widely used are sqlite3 (only appropriate for test and development work), MySQL and PostgreSQL.
Nova also provides console services to allow end users to access their virtual instance's console through a proxy. This involves several daemons (console, nova-vncproxy and nova-consoleauth).
Nova interacts with many other OpenStack services: Keystone for authentication, Glance for images and Horizon for web interface. The Glance interactions are central. The API process can upload and query Glance while nova-compute will download images for use in launching images.
B. Object Store:
The swift architecture is very distributed to prevent any single point of failure as well as to scale horizontally. It includes the following components:
Proxy server (swift-proxy-server) accepts incoming requests via the OpenStack Object API or just raw HTTP. It accepts files to upload, modifications to metadata or container creation. In addition, it will also serve files or container listing to web browsers. The proxy server may utilize an optional cache (usually deployed with memcache) to improve performance.
Account servers manage accounts defined with the object storage service.
Container servers manage a mapping of containers (i.e folders) within the object store service.
Object servers manage actual objects (i.e. files) on the storage nodes.
There are also a number of periodic process which run to perform housekeeping tasks on the large data store. The most important of these is the replication services, which ensures consistency and availability through the cluster. Other periodic processes include auditors, updaters and reapers.
The object store can also serve static web pages and objects via HTTP. In fact, the diagrams in this blog post are being served out of Rackspace Cloud's Swift service.
Authentication is handled through configurable WSGI middleware (which will usually be Keystone).
C. Image Store:
The Glance architecture has stayed relatively stable since the Cactus release. The biggest architectural change has been the addition of authentication, which was added in the Diablo release. Just as a quick reminder, Glance has four main parts to it:
Glance-api accepts Image API calls for image discovery, image retrieval and image storage.
Glance-registry stores, processes and retrieves metadata about images (size, type, etc.).
A database to store the image metadata. Like Nova, you can choose your database depending on your preference (but most people use MySQL or SQlite).
A storage repository for the actual image files. In the diagram above, Swift is shown as the image repository, but this is configurable. In addition to Swift, Glance supports normal filesystems, RADOS block devices, Amazon S3 and HTTP. Be aware that some of these choices are limited to read-only usage.
There are also a number of periodic process which run on Glance to support caching. The most important of these is the replication services, which ensures consistency and availability through the cluster. Other periodic processes include auditors, updaters and reapers.
As you can see from the diagram in the Conceptual Architecture section, Glance serves a central role to the overall IaaS picture. It accepts API requests for images (or image metadata) from end users or Nova components and can store its disk files in the object storage service, Swift.
D. Identity:
Keystone provides a single point of integration for OpenStack policy, catalog, token and authentication.
Keystone handles API requests as well as providing configurable catalog, policy, token and identity services.
Each Keystone function has a pluggable backend which allows different ways to use the particular service. Most support standard backends like LDAP or SQL, as well as Key Value Stores (KVS).
Most people will use this as a point of customization for their current authentication services.
E. Network:
Quantum provides "network connectivity as a service" between interface devices managed by other OpenStack services (most likely Nova). The service works by allowing users to create their own networks and then attach interfaces to them. Like many of the OpenStack services, Quantum is highly configurable due to it's plug-in architecture. These plug-ins accommodate different networking equipment and software. As such, the architecture and deployment can vary dramatically. In the above architecture, a simple Linux networking plug-in is shown.
Quantum-server accepts API requests and then routes them to the appropriate quantum plugin for action.
depending on the vendor and technologies used in the particular cloud. Quantum ships with plugins and agents for: Cisco virtual and physical switches, Nicira NVP product, NEC OpenFlow products, Open vSwitch, Linux bridging and the Ryu Network Operating System. Midokua also provides a plug-in for Quantum integration. The common agents are L3 (layer 3), DHCP (dynamic host IP addressing) and the specific plug-in agent.
Most Quantum installations will also make use of a messaging queue to route information between the quantum-server and various agents as well as a database to store networking state for particular plugins.
Quantum will interact mainly with Nova, where it will provide networks and connectivity for its instances.
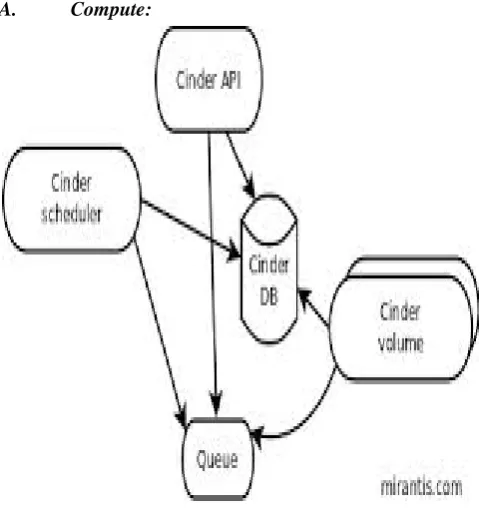
F. Block Storage:
Cinder separates out the persistent block storage functionality that was previously part of Openstack Compute (in the form of nova-volume) into it's own service. The OpenStack Block Storage API allows for manipulation of volumes, volume types (similar to compute flavors) and volume snapshots.
Cinder-api accepts API requests and routes them to cinder-volume for action.
Cinder-volume acts upon the requests by reading or writing to the Cinder database to maintain state, interacting with other processes (like cinder-scheduler) through a message queue and directly upon block storage providing hardware or software. It can interact with a variety of storage providers through a driver architecture. Currently, there are drivers for IBM, SolidFire, NetApp, Nexenta, Zadara, linux iSCSI and other storage providers.
Much like nova-scheduler, the cinder-scheduler daemon picks the optimal block storage provider node to create the volume on.
Cinder deployments will also make use of a messaging queue to route information between the cinder processes as well as a database to store volume state.
Like Quantum, Cinder will mainly interact with Nova, providing volumes for its instances.
IV. NAGIOS PROVIDES
a. By using Nagios, you can:
Plan for infrastructure upgrades before outdated systems cause failures Respond to issues at the first sign of a roblem Automatically fix problems when they are etected Coordinate technical team responses Ensure your organization's SLAs are being metEnsure IT infrastructure outages have a minimal effect on your organization's bottom line Monitor your entire infrastructure and business processes.
b. How It Works:
A. Monitoring:
IT staff configure Nagios to monitor critical IT infrastructure components, including system metrics, network protocols, applications, services, servers, and network infrastructure.
B. Alerting
Nagios sends alerts when critical infrastructure components fail and recover, providing administrators with notice of important events. Alerts can be delivered via email, SMS, or custom script.
C. Response:
IT staff can acknowledge alerts and begin resolving outages and investigating security alerts immediately. Alerts can be escalated to different groups if alerts are not acknowledged in a timely manner.
D. Reporting:
Reports provide a historical record of outages, events, notifications, and alert response for later review. Availability reports help ensure your SLAs are being met.
E. Maintenance:
Scheduled downtime prevents alerts during scheduled maintenance and upgrade windows.
F. Planning:
Trending and capacity planning graphs and reports allow you to identify necessary infrastructure upgrades before failures occur.
Nagios is an awesome Open Source monitoring tool, its provides you more comprehensive monitoring environment to always keep an eye on your all machines /
networks whether you are in a your data center or just your small labs.
warnings and indicates if something goes wrong in your
servers which eventually helps us to detect some problems before they occur. It helps us to reduce downtime and
business losses.
Recently, Nagios released its latest versions Nagios 4.0.1 on 15th October 2013, and its latest stable release of
Nagios plugins 1.5.
This article is intended to guide you with easy instructions on how to implement and install latest Nagios 4.0.1 from source (tarball) on RHEL 6.4/6.3/6.2/6.1/6/5.8, CentOS 6.4/6.3/6.2/6.1/6/5.8 and Fedora 19,18,17,16,15,14,13,12 distributions. Within 30 minutes you will be monitoring your local machine, no any advanced installation procedure only basic installation that will work 100% on most of the today’s Linux servers.
Please Note: The installation instructions were shown in here are written based on CentOS 6.4 Linux distribution. If you follow these instructions correctly, you will end up with following information.
a) Nagios and its plugins will be installed under /usr/local/nagios directory.
b) Nagios will be configured to monitor few services of your local machine (Disk Usage, CPU Load, Current Users, Total Processes, etc.)
c) Nagios web interface will be available at http://localhost/nagios
Step 1: Install Required Dependencies
We need to install Apache, PHP and some libraries like gcc, glibc, glibc-common and GD libraries and its development libraries before installing Nagios 4.0.1 with source. And to do so we can use yum default package installer.
[root@tecmint]# yum install -y httpd php gcc glibc glibc-common gd gd-devel ma
Step 2:
Create Nagios User and Group Create a new nagios user and nagcmd group account and set a password.
[root@tecmint]# useradd nagios [root@tecmint]# groupadd nagcmd
Next, add both the nagios user and the apache user to the nagcmd group.
[root@tecmint]# usermod -G nagcmd nagios [root@tecmint]# usermod -G nagcmd apache
Step 3: Download Nagios Core 4.0.1 and Nagios Plugin 1.5
Create a directory for your Nagios installation and all its future downloads.
[root@tecmint]# mkdir /root/nagios [root@tecmint]# cd /root/nagios
Now download latest Nagios Core 4.0.1 and Nagios plugins 1.5 packages with wget command.
[root@tecmint nagios~]# wget
[root@tecmintnagios~]#wgethttps://www.nagios-plugins.org/download/nagios-plugins-1.5.tar.gz
Step 4: Extract Nagios Core and its Plugins We need to extract downloaded package with tar command as follows.
[root@tecmint nagios~]# tar –xvf nagios-4.0.1.tar.gz [root@tecmint nagios~]# tar –xvf nagios-plugins-1.5.tar.gz When you extract these tarballs with tar command, two new folders will appear in that directory.
[root@tecmint nagios ~]# ll total 3712 drwxrwxr-x 18 root root 4096 Oct 17 03:28 nagios-4.0.1
-rw-r--r-- 1 root root 1695367 Oct 15 19:49 nagios-4.0.1.tar.gz drwxr-xr-x 15 200 300 4096 Oct 14 10:18
nagios-plugins-1.5
-rw-r--r-- 1 root root 2428258 Oct 2 11:27 nagios-plugins-1.5.tar.gz
Configure Nagios Core
Now, first we will configure Nagios Core and to do so we need to go to Nagios directory and run configure file and if everything goes fine, it will show the output in the end as sample output. Please see below.
[root@tecmint nagios~]# cd nagios-4.0.1
[root@tecmint nagios-4.0.1 ]# ./configure --with-command-group=nagcmd
Sample output:
Nagios executable: nagios Nagios user/group: nagios,nagio Command user/group: nagios,nagcmd Event Broker: yes
Install ${prefix}: /usr/local/nagios
Install${includedir}:/usr/local/nagios/include/nagios Lockfile: ${prefix}/var/nagios.lock
Check result directory: ${prefix}/var/spool/checkresults Init directory: /etc/rc.d/init.d
Apache conf.d directory: /etc/httpd/conf.d Mail program: /bin/mail
Host OS: linux-gnu Web Interface Options: --- HTML
CGI
Traceroute (used by WAP): /bin/traceroute
Review the options above for accuracy. If they look okay, type 'make all' to compile the main program and CGIs. Now, after configuring we need to Compile and install all the binaries with make command and make install command will install all the needed libraries in your machine and we can proceed further.
[root@tecmint nagios-4.0.1 ]# make all [root@tecmint nagios-4.0.1 ]# make install Sample output:
*** Main program, CGIs and HTML files installed *** You can continue with installing Nagios as follows (type 'make'without any arguments for a list of all possible options):
make install-init - This installs the init script in /etc/rc.d/init.d
make install-commandmode
- This installs and configures permissions on the directory for holding the external command file
make install-config - This installs sample config files in /usr/local/nagios/etc
Following command will install the init scripts for Nagios. [root@tecmint nagios-4.0.1 ]#
make install-init To make nagios work from command line we need to install command-mode.
[root@tecmint nagios-4.0.1 ]# make install-commandmode
Next, install sample nagios files, please run following command.
Sample output:
/usr/bin/install -c -m 775 -o nagios -g nagios -d /usr/local/nagios/etc
/usr/bin/install -c -m 775 -o nagios -g nagios -d /usr/local/nagios/etc/objects
/usr/bin/install -c -b -m 664 -o nagios -g nagios sample-config/nagios.cfg /usr/local/nagios/etc/nagios.cfg
/usr/bin/install -c -b -m 664 -o nagios -g nagios sample-config/cgi.cfg /usr/local/nagios/etc/cgi.cfg
/usr/bin/install -c -b -m 660 -o nagios -g nagios sample-config/resource.cfg /usr/local/nagios/etc/resource.cfg /usr/bin/install -c -b -m 664 -o nagios -g nagios sample-config/template-object/templates.cfg
/usr/local/nagios/etc/objects/templates.cfg
/usr/bin/install -c -b -m 664 -o nagios -g nagios sample-config/template-object/commands.cfg
/usr/local/nagios/etc/objects/commands.cfg
/usr/bin/install -c -b -m 664 -o nagios -g nagios sample-config/template-object/contacts.cfg
/usr/local/nagios/etc/objects/contacts.cfg
/usr/bin/install -c -b -m 664 -o nagios -g nagios sample-config/template-object/timeperiods.cfg
/usr/local/nagios/etc/objects/timeperiods.cfg
/usr/bin/install -c -b -m 664 -o nagios -g nagios sample-config/template-object/localhost.cfg
/usr/local/nagios/etc/objects/localhost.cfg
/usr/bin/install -c -b -m 664 -o nagios -g nagios sample-config/template-object/windows.cfg
/usr/local/nagios/etc/objects/windows.cfg
/usr/bin/install -c -b -m 664 -o nagios -g nagios sample-config/template-object/printer.cfg
/usr/local/nagios/etc/objects/printer.cfg
/usr/bin/install -c -b -m 664 -o nagios -g nagios sample-config/template-object/switch.cfg
/usr/local/nagios/etc/objects/switch.cfg *** Config files installed ***
Remember, these are *SAMPLE* config files. You'll need to read the documentation for more information on how to actually define services, hosts, etc. to fit your particular needs.
Step 5: Customizing Nagios Configuration
Open the “contacts.cfg” file with your choice of editor and set the email address associated with the nagiosadmin contact definition to receiving email alerts.
# vi /usr/local/nagios/etc/objects/contacts.cfg
# Just one contact defined by default - the Nagios admin (that's you)
# This contact definition inherits a lot of default values from the 'generic-contact'
# template which is defined elsewhere. define contact{
contact_name nagiosadmin ; Short name of user use generic-contact ; Inherit default values from generic-contact template (defined above)
Step 6: Install and Configure Web Interface for Nagios: We are done with all configuration in the backend, now we will configure Web Interface For Nagios with following command. The below command will Configure Web interface for Nagios and a web admin user will be created “nagiosadmin”.
[root@tecmint nagios-4.0.1 ]# make install-webconf In this step, we will be creating a password for “nagiosadmin”. After executing this command, please provide a password twice and keep it remember because this password will be used when you login in the Nagios Web interface.
[root@tecmint nagios-4.0.1]# htpasswd -s -c /usr/local/nagios/etc/htpasswd.users nagiosadmin
New password: Re-type new password:
Adding password for user nagiosadmin
Restart Apache to make the new settings take effect. [root@tecmint ]# service httpd start (On RedHat / CentOS) [root@tecmint ]# systemctl start httpd.service (On Fedora)
Step 7: Compile and Install Nagios Plugin
We have downloaded nagios plugins in /root/nagios, Go there and configure and install it as directed below.
[root@tecmint nagios]# cd /root/nagios [root@tecmint nagios]# cd nagios-plugins-1.5
[root@tecmint nagios]# ./configure --with-nagios-user=nagios --with-nagios-group=nagios
[root@tecmint nagios]# make [root@tecmint nagios]# make install
Step 8: Verify Nagios Configuration Files:
Now we are all done with Nagios configuration and its time to verify it and to do so please insert following command. If everything goes smooth it will show up similar to below output.
[root@tecmint nagios]# /usr/local/nagios/bin/nagios -v /usr/local/nagios/etc/
Step 9: Add Nagios Services to System Startup:
To make Nagios work across reboots, we need to add
nagios and httpd with chkconfig command. [root@tecmint ]# chkconfig --add nagios [root@tecmint ]# chkconfig --level 35 nagios on [root@tecmint ]# chkconfig --add httpd
[root@tecmint ]# chkconfig --level 35 httpd Restart Nagios to make the new settings take effect.
[root@tecmint ]# service nagios start (On RedHat /
CentOS)
Figure 2 system with load balancing model
V. SYSTEM MODEL
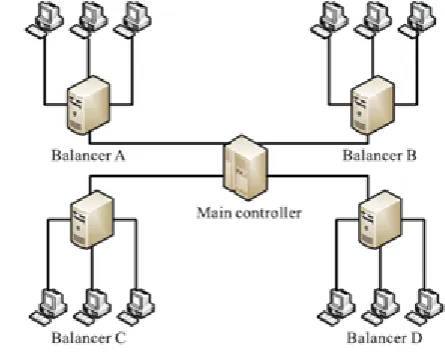
There are several cloud computing categories with this work focused on a public cloud. A public cloud isbased on the standard cloud computing model, with service provided by a service provider[3]. A large public cloud will include many nodes and the nodes indifferent geographical locations. Cloud partitioning is used to manage this large cloud. A cloud partition is a subarea of the public cloud with divisions based on the geographic locations. The architecture is shown in
The load balancing strategy is based on the cloud partitioning concept. After creating the cloud partitions ,the load balancing then starts: when a job arrives at
Figure 3 Controller and Balancer portioning the cloud
A. Main controller and balancers:
The load balance solution is done by the main controllerand the balancers.The main controller first assigns jobs to thesuitable cloud partition and then communicates withthe balancers in each partition to refresh this statusinformation. Since the main
Figure 4.Algoritham portioning based on the state controller deals withinformation for each partition, smaller data sets willlead to the higher
processing
Figure: 5
Figure 5 Algorithm compute Load degree rates. The balancers ineach partition gather the status information from everynode and then choose the right strategy to distribute the jobs. The relationship between the balancers and the main controller is shown in
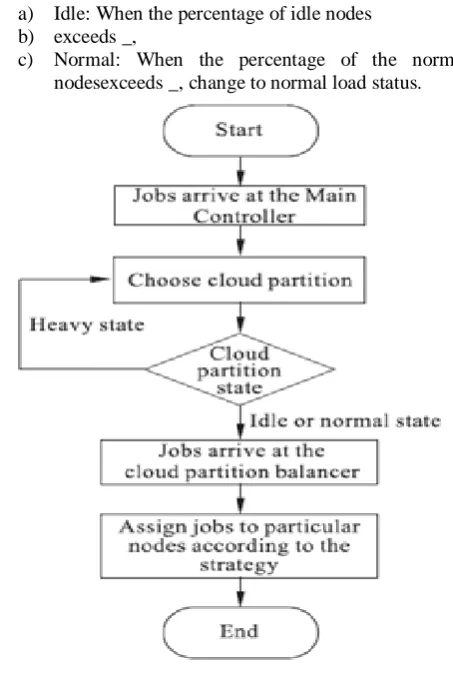
B. Assigning jobs to the cloud partition:
a) Idle: When the percentage of idle nodes b) exceeds _,
c) Normal: When the percentage of the normal nodesexceeds _, change to normal load status.
Figure 6 Resource allocated by Requested state
d) Overload: When the percentage of the overl oaded nodes exceeds , change to overloaded status.The parameters _, _, and are set by the cloud partition balancers.
The main controller has to communicate with the balancers frequently to refresh the status information. The main controller then dispatches the jobs using the following strategy: When job i arrives at the system, the main controller queries the cloud partition where job is located. If this location’s status is idle or normal, the job is handled locally. If not, another cloud partition is found that is not overloaded. The algorithm is shown in
Algorithm 1
C. Assigning jobs to the nodes in the cloud:
Partition The cloud partition balancer gathers load information from every node to evaluate the cloud partition status. This evaluation of each node’s load status is very important. The first task is to define the load degree of each nodes. The node load degree is related to various static parameters and dynamic parameters. The static parameters include the number of CPU’s, the CPU processing speeds, the memory size, etc. Dynamic parameters are the memory utilization ratio, the CPU utilization ratio, the network bandwidth, etc. The load degree is computed from these parameters as below:
Load degree high 6 Load degree’s /; the node is not available and cannot receive jobs untilit returns to the normal.
The load degree results are input into the Load Status Tables created by the cloud partition balancers. Each balancer has a Load Status Table and refreshes it each fixed period T . The table is then used by the balancers to calculate the partition status. Each partition status has a different load balancing solution. When a job arrivesat a cloud partition, the balancer assigns the job to then odesbased onit current load strategy. This strategy is changed by the balancers as the cloud partition status Changes
VI. CONCLUSION
In this paper, we propose a secure- for data storage security in Cloud Computing. We utilize Activity workflow it will optimize the user manager and administrator it will provide authorization and requesting resource allocation approval or reject to the corresponding request this entire information is request and resource allocation fully automated processor controlled by negios monitoring tool cloud server during the efficient allocation process, which not only eliminates the
burden of cloud user from the tedious and possibly expensive task, but also alleviates the users’ fear of their outsourced data leakage. Considering Token id tenen id may concurrently handle multiple sessions from different users for their outsourced data files, we further extend our privacy-preserving load balancing system into a multi-user setting, where that automatically providing the allocated resource to corresponding manager or user that can perform multiple resource allocation tasks in a batch manner for better efficiency. Extensive analysis shows that our schemes are provably secure and highly efficient.
VII. REFERENCE
[1]. KEN people Technologist::Cyclist::Zombie Hunter“http://ken.pepple.info/openstack/2012/09/25/openst ack-folsom-architecture/
[2]. Nagios Monitoring tool in load balancing for public cloud http://www.nagios.org
[3]. “A Load Balancing Model Based on Cloud partitioning for the public cloud” Ieee Transactions On Cloud Computing Year 2013 Gaochao Xu, Junjie Pang, and Xiaodong Fu* [4]. R. Hunter, The why of cloud ,www.gartner.com Display
Document?doc_cd=226469&ref=g_noreg,2012
[5]. Z. Chaczko, V. Mahadevan, S. Aslanzadeh, and C. Mcdermid, Availability and load balancing in cloud computing, presented at the 2011 International Conference on Computer and Software Modeling, Singapore, 2011 [6]. R.Hunter, The why of cloud, www.gartner.com
isplayDocument?doc cd=226469&ref= g noreg, 2012.