Volume 6, No. 1, Jan-Feb 2015
International Journal of Advanced Research in Computer Science
RESEARCH PAPER
Available Online at www.ijarcs.info
ISSN No. 0976-5697
Network Analysis by Using Various Models of the Online Social Media Networks
Dr. Mamta Madan and Meenu Chopra*
Professor,2Assistant Professor Vivekananda Institute of Professional Studies
GGSIP University,India
Abstract: This paper is organized as follows: Firstly, it presents related literature on the current topics related to online social media networks (OSMNs) and the latest works, which define the social networks. Secondly, it introduces the important traits depicted by the most of the Online Social Media Networks. After that we are describing some generative models to represent OSMNs. Lastly, we have tried to analyze aspects in which OSMNs can fit as well as the areas where it fails.
Keywords: Online Social Media Networks (OSMNs); Social Network Analysis (SNA)
I. INTRODUCTION
Social Network Analysis (SNA), a novel branch of computer Social Sciences, which is actually used to study large and complex OSMNs. Studying such online networks, can be useful to compare and analyze the differences and similarities with real-life networks. SNA not only defines the some interesting aspects, but also provides the various techniques to introspect the OSMNs, either from a qualitative or a quantitative perspective (e.g. properties like Diameter, Navigability and Degree Distributions etc.). In this paper, we have tried to focus on the graph structure which represents OSMNs, for that we consider specific characteristics and metrics such as diameter, degree Distributions and community structure are the topological measures for defining networks.
II. BACKGROUND AND RELATED WORK
Summarized below are some of the latest trends in the social network analysis (SNA):
a) Few Researchers [1, 7] had done analysis on OSMNs by using link symmetries, degree distributions, group formations, cluster coefficients etc.
b) Kumar et al. [4], proposed the framework which depicts the structure of OSMNs, moreover with proper validations with actual data. On the same notion, Leskovec et al. [5] tried to explain the dynamic and structural properties of the large-scale OSMNs which further affect the online communities.
c) Mining large and complex social graphs with infinite number of nodes and edges gave birth to Graph mining techniques. Some authors [2, 5] discovered
Metropolis-Hastings and Random Walks algorithms
having better performance for, both static and dynamic graphs.
d) Some researchers [3, 6] try to figure out those features of the social networks that could predict what nodes are more probably to be connected by trusted relationships, which is called as Link Prediction (LP)
problem.
All about the OSMNs models literature is a part of social sciences. One of the major development in the field of
study of OSMNs came from the researcher Stsnley Miligram in the 1960’s [8, 9], his goal was to detect the average length of the shortest-path of friends between a pair of people. He actually analyzed the characteristics of real-life OSMNs by performing number of experiments and finally proposing the term “small-world” phenomena. Later
on researchers think that Miligram’s results are intuitive and obvious and were able to replicate experiment on a smaller scale across a university campus, or within a single ethnic community in a city using similar methods [10,11,12,13,14], and a recent larger-scale small-world experiment conducted via email has shown similar results [15].
III. FEATURES OF ONLINE SOCIAL MEDIA NETWORKS
In this section, we have done a brief survey of some important properties of OSMNs that have been extensively used in the social network models and for the ease of reference. Mathematically in graph-theoretic terminology, an OSMN is just represents a simple graph (V, E), where all nodes (or vertex, actor, site) in network depicts people, and an edge (or arc, tie bond) (i, j) belongs to E, denotes some kind of social relationship between the people i and j. The key features that characterize social networks. i.e. i) defining “small-world” with Diameter and Navigability effect (SW-DN), ii) Clustering Coefficient (CC) and lastly iii) Degree Distributions (DD).
The other properties which we observed in real world OSMNs are a) Giant Component (GC )(related to the size of the social network’s connected components and it includes almost all the nodes in the network i.e. there exists a path between most pairs of nodes), b) Assortative mining (AM)
(which define the degree of correlations among the nodes which are neighbors’) and lastly c) layout or community structure (CS) in OSMns. In [16] Newman and Park, discussed that AM and CS are the important statistical properties for the OSMNs.
A. “Small-world” Phenomena with Diameter and
Navigation Effect (SW-DN):
there exists a relatively short path connecting any pair of nodes within the social network. In fact, technically, a “small-world” network is defined as a graph in which most of the nodes are not reciprocal neighbors to each other, and could be reached from every node by a few number of hops. The diameter D, that represents the so called “small-world” phenomena, directly proportional to the logarithm of the length of the network which is reflected as
D
Where ardinality of V
D Diameter
Milgram’s historically proved with the help of his experimentation that the: random graphs have small diameter. It yet not completely clear that OSMNs have a small diameter in term of longest shortest path in the graph theory. Unfortunately, the research on social networks often use the word “diameter” in reference to four measurable quantities i) the longest shortest-path which reflects the trueness of diameter in graph theory but un-measurable in disconnected OSMNs, ii) the longest-shortest path between connected vertexes or nodes, which is measurable in length, iii) the average shortest-path length, and iv) the average shortest-path length between connected nodes. In [17,18], Albert et.al and Border et.al stated that most of the other intriguing networks have shown average shortest-path length, for which the average (directed) shortest-path length was calculated to be less than twenty and it is partially related to the OSMNs
Another characteristic noted in OSMNs is that they are navigable small worlds: not only pairs of people are connected by short paths but also using local and global information for e.g. topological or geographical information. Watts, Dodds and Newman [19] defined that navigation is possible based on the multiple communities like hobbies, location, occupation, etc.) into which people fall and a algorithm that follows greedy approach and try to attempts to get nearer to the target node from any random dimension. This model in terms of simulations has shown the navigation in the social networks, but theoretically no proof have been established. random –graph of social networks is the CC, which is much than the prediction value in a random graph G (V, E). The CC for a vertex or node v V of a random graph G (V, E) is
CC=
It implies that the number of edges that exist within the neighborhood T (v) of v, i.e., between two nodes adjacent to u. The CC of the full network is the average CC taken over all nodes in the graph. Mostly networks have CC in the range of 10-1 which is orders of magnitude greater than the CC that a random graph G (n, p) would exhibit when the link probability p is set in a reasonable range to approximate the sparsity of these networks [20]. In other words, G (n, p), the probability of the existence of the edge ( i ,j) ( where i and j represents a pair of people) is independent of the graph distance i.e. an edge between i and j is highly negatively
correlated with graph distance. This shows that the correlation captures the notion that the people separated by a smaller social distance are more likely to be friends.
C. Degree Distribution (DD)- Scale Free Distribution:
Many network models reflect the important feature i.e.
degree of distribution (DD) of network- it means the layout the nodes in the social network are interconnected. In a random graph, the DD is the proportion of nodes in the network that have a particular degree k (i.e. the number of people with exactly k friends). In a typical social network,, the proportion P(k) of nodes with degree at least k is reasonably well approximated by the power-law distribution P (k)= k-β For a constant β > 0 (β ≈ 2.1-2.5)
Models based on power-law degree distribution are referred as scale-free networks because they depict the node degree distributions (DD) of large and complex social networks. Since these power laws are free of any characteristic scale, such a online network with a power law degree distribution is known as scale-free network [21].
IV. SOCIAL NETWORKS AND MODELS
Properties like the shortest average length, the correlation or CC and the degree of distribution (DD) have been applied to rigorously to model the OSMNs. Many researchers have presented different models, but in this paper we focus on the three most widely accepted modeling paradigms :i) The Erdos-Renyi Model- Random Graphs, ii)
“Small-World" social networks and, iii) power law degree distribution networks. Because of the ease of adoption the Erdos-Renyi model which represents random graphs, are widely used in several experimental studies. After the adapted to explain the scale-free behaviors of the networks. This is to concentrate on the dynamics of the social network, to describe the phenomena such as the power laws and other non-Poisson degree distributions.
Before we discuss specific models that might explain the small-world phenomenon, we note that real social networks are dense graphs. Generally it has been found [22] that on an average, a person has an approximate at most a thousand friends , therefore a realistic or theoretic model cannot be used on a sparse graph to explain the small world phenomena.
A. Erdos and Renyi: Random Graphs:
The first models of network, the random graph, was given by Erdos and Renyi [23]. They both proposed two models for the networks: i) the simple one consists of a graph containing n vertices which are connected randomly and ii) the generally used model, indeed, is defined as a graph G n, p in which each existing edge between two
The following are the characteristics of this model: a. As random graphs have small diameters, so it is easy
to work upon them
b. They do not properly simulate the exact structure of real-world large scale complex networks, because of two reasons I) the DD (degree of distribution) follows the Poisson Law, which partially differs from the power law distribution of random networks proved by statistical or empirical data, II) these do not depict the CC (clustering Coefficient) effect, taking into account
that all the nodes of the graph is associated with equal weight and therefore reducing the effect of the property i.e. Giant Component (which consider the network to be giant cluster).
c. This model is not good and unfeasible to be used in current studies because of the very low probability, higher CC of a random graph which have tendency towards homophily ( all nodes have relatively similar features).
Figure 1: Random graph with a fixed-outdegree variant of the G (n, p) model of Erdos and Renyi.and degree of distribution (DD) is linear. Ucinet [32]
B. Newman-Watts-Strogatz: The Rewired Ring Lattice:
Like -wise random graphs most of the real-world OSMNs are very well connected , sparse and have shortest average diameter length, but they also have exceptionally large CC (clustering coefficients), a feature that is ignored by above mention Erdos-Renyi Model. Its role is crucial in the study of “small-world” phenomena. This network model as follows:
a) It is grid architecture model in which n-people were placed on a k-dimensional grid where k=1, but this model can be applied to higher dimensions as well where each person i in the grid can connect to all other people within the threshold Manhatttan distance >1, considering the fact that all others people are “local neighbors’ of the person u in the network [24]. b) In this model for each edge (i,j) in the graph is having
some probability p, is randomly “rewire” to some other edge to become (i,j`), where j` is selected
uniformly and randomly from all the possible set of nodes in the network .
c) In random graphs we have high CC i.e. p=0, that means for any two local neighbors i and j, almost all the nodes in the network are at closer proximity with i as well as with j. As population size is in the polynomial , so we have high length diameter because left out edges in the graph are local links that cover the distance θ(1) in the grid [26].
d) If p ≈ 1, we have small diameter and low CC as in case of random graph, therefore similar to G (n, p) random graph.
e) This model depicts the best of two worlds, by having possible intermediate values for rewiring probability (p) that that have high CC and low diameter length. The high CC exists because rewiring probability p is small due to local links in the network remain unchanged.
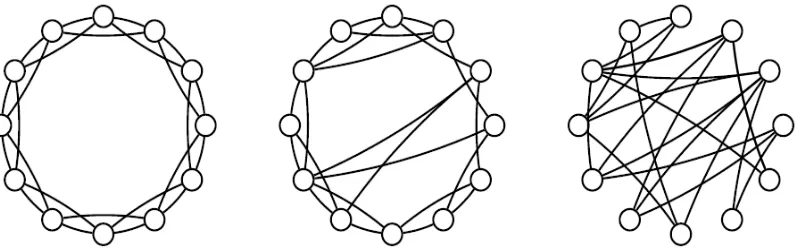
(a) The trivial rewiring probability (b) An intermediate rewiring prob- (c) The trivial rewiring probability p = 0, in which each node is con-ability p = 0:1, where most edge p = 1, in which each edge connects nected to its nearest neighbors. still connect nearby neighbors, but each node to a node chosen uni-a small
Figure 2: The Watts/Strogatz social-network model of a randomly rewired ring lattice. A circle is formed of n people, each of whom is connected to the θ(1) nearest neighbors in each direction. Then, with some probability p, each edge is “rewired" by replacing one of the edge's endpoints with a connection to a node chosen uniformly at random from the entire network [26].
Such type of models extensively been used sin the mathematics and computer science, in which graph is an n-node cycle and by random matching diameter of a network has been θ (log n) with probability tends to one as n nodes approaches to infinity [25].
C. Kleinberg: A Navigable Small World:
Milgram in his experiment missed out some observation which Kleinberg [28, 29] had noticed in the modeling of OSMNs. Milgram’s shows the world two things in OSMNs: i) short links exists between random pairs of a network, and ii) clients or people in the network themselves able to fetch or design short path by using only “local” information about their own neighbor’s or friends. Kleinberg instead of taking length of diameter of network, he analyzed the result by rating the success of a specific type of routing alogorithm when it is actually fired on the graph. This model can be explained as below:
a) He used local-information routing algorithm-that already knows the topology of the graph no rewiring done-needed to do number of polynomial steps.
b) It is an extension of Watts-Strogatz model, having a network with n-dimensional mesh of people, in which each person have the local information about his topological neighbors’ in random direction and the probability Pr Pr [i →j] α d ( i, j)-β where i and j is linking nodes
β ≥ 0 ( some constant) d(i,j) ~ Manhattan distance c) This model was the improvised version (adding edge)
of Watts-Strogatz model, in which new edges were added with probability p with β=0.
d) Kleinberg’s local information routing algorithm was based on greedy approach, can able to construct Short average paths between people in the graph.
e) Kleinberg’s theorem says if β=k, then local information greedy algorithm will find the path of length O(log2n) with high probability and if β≠ k, then length will be Ώ (nε) for some constant ε >0 with high probability.
This model holds positive results only for one single long-range link that to be chosen for every node in the network and goes negative for any other constant number of long-range links. Kleinberg (27) analyzed the “small-world" effect from an algorithmic perspective, providing important algorithms to compute metrics on graphs representing social networks, the so called social graphs.
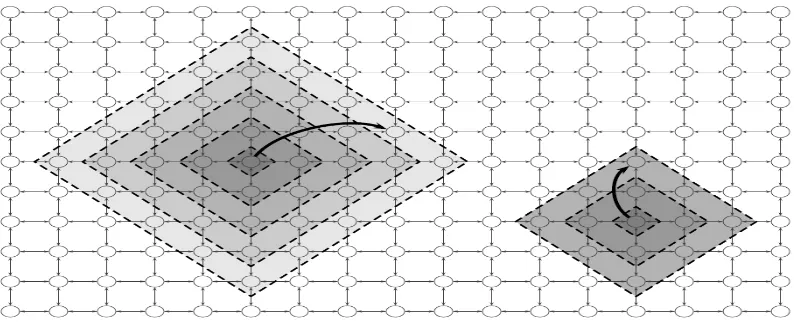
Figure 3: The Kleinberg social-network model. Starting with a k-dimensional mesh (here k = 2), we connect each node to its nearest neighbor in each cardinal
direction. Then, for each node u, we select a long-range link probabilistically, where the probability that i's long-range link is j is proportional to d (i, j)-β, for a
parameter β ≥ 0, where d (i, j) denotes the Manhattan distance between i and j. In the figure, the long-range links are shown for two of the nodes, along with dashed diamonds that show the distances to all nodes at least as close to the source as the randomly selected long-range link. Darker shading indicates a higher
probability of a link [27].
D. The Barabasi-Albert -Preferential Attachment
Model:
The above discussed models only incorporate the properties of the OSMNs which they observed from real-world networks but none of them discussed about the origin and evolution of these properties. They both recommended the two main aspects of the self-organized scale-free network are i) expansion ii) prefential attachment. Mostly real-world networks kept on growing continuously by adding new nodes which are attached preferentially to the previous or existing connected nodes in the dense or sparse network. This dynamic scale-free network model discuss below:
a) This model gives another way of generating a power-law degree distribution simply means that in a network
each node u, one can simply generate “stub” half number of edges (in each edge u is fixed) by selecting a degree d(u) given by power-law degree distribution and then randomly connecting the final or stub edges to produce the network [30,31,32,33].
b) Barabasi-Albert [23], proposed at every time frame t, a new node or person ut is added to a network with a
exactly one edge. The neighbor’s of ut has a
probability P[ut →v] α d(v).
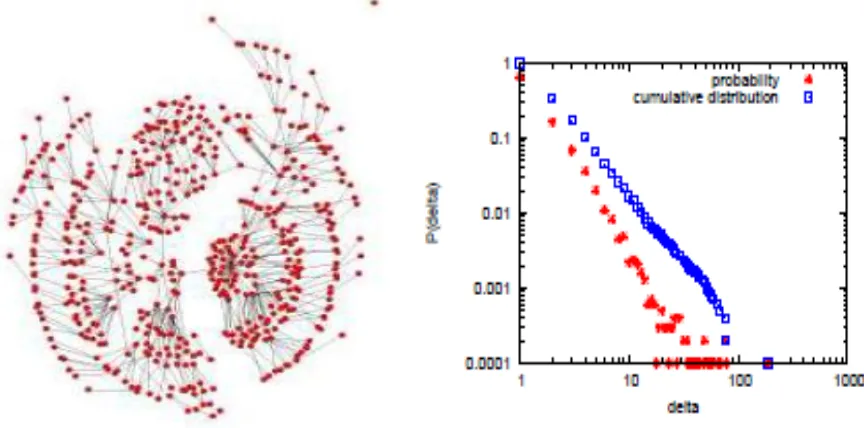
Figure 4: The preferential-attachment model of Barabasi and Albert with degree of distribution plot is log/log and also average outdegree variant. Ucinet [32]
V. CONCLUSION AND FUTURE WORK
In this paper we tried connect the real-world networks mechanics with the theoretical modeling of small-world phenomena observations both empirically and analytically and also tried to portrait a summarized picture of mostly used OSMNs models which represent the important characteristics of the real-world networks. We have discussed some of the previous research done on the OSMNs and also stated some the terminology and topological features that are important to the real-world network. Stanley Milgram’s suggested the small-world problem, but there is a disconnection between mathematical proposed models and real-world mechanics or experiments. Several network models have being exploited i.e. i) Erdos-Renyi-Random graphs model, ii) Watt-Strogatz, iii) Kleinberg Model, iv) Barabasi-Albert-preferential attachment model. We observed that number of empirical and mathematical models have been recommended with their potential explanation, but none of the proposed models have shown the topological features that could be matched with real-world networks. While studying these models we analyze that none of them represent all the crucial features of the OSMNs which are namely i) “small-world”
phenomena, ii) degree of distribution (DD), iii) clustering of coefficient (CC), and lastly iv) detection of Community structure. We have found out that the Kleinberg’s result doesn’t explain the small-world phenomena properly and also people doesn’t have friendships network according the power-law degree distribution model. Because OSMNs are highly dynamic structures, they grow rapidly and changed quickly through the addition of new edges which significantly means appearance of new friendships or interactions in the underlying network compel us to understand the mechanisms by which they evolve is a fundamental research question that is still not well understood and it forms the motivation for the work to be done.
In future, we will try to do three things firstly, by providing a new explanation of the small-world phenomena, either by proposing a new model or framework by using
local or global geographic information or by detecting community structure that will support both empirically and theoretically to our real-small world. Secondly, as OSMNs are evolving using variety of graph-theoretic techniques of the existing friendships networks to predict new interactions more accurately rather than by guessing random. Thirdly, with the help of computational theoretical models, we will try to infer social connections in a network, attempting to extract a social network via observation of the topics of conversation by the members of the network, and thereby inferring flow of Information through the network.
VI. REFERENCES
[1] Ahn, Y., Han, S., Kwak, H., Moon, S., Jeong, H.: Analysis of topological characteristics of huge online social networking services. In: Proc. of the 16th international conference on World Wide Web, pp. 835-844. ACM (2007).
[2] Gjoka, M., Kurant, M., Butts, C., Markopoulou, A.: Walking in facebook: a case study of unbiased sampling of OSNs. In: Proc. of the 29th conference on Information communications, pp. 2498-2506. IEEE (2010).
[3] Golbeck, J., Hendler, J.: Inferring binary trust relationships in web-based social networks. Transactions on Internet Technology 6(4), 497-529 (2006).
[4] Kumar, R., Novak, J., Tomkins, A.: Structure and evolution of online social networks Link Mining: Models, Algorithms, and Applications pp. 337-357 (2010).
[5] Leskovec, J., Faloutsos, C.: Sampling from large graphs. In: Proc. of the 12th SIGKDD international conference on Knowledge discovery and data mining, pp. 631-636. ACM (2006).
[6] Liben-Nowell, D., Kleinberg, J.: The link-prediction problem for social networks. Journal of the American Society for Information Science and Technology 58(7), 1019-1031 (2007).
social networks. In: Proc. of the 7th SIGCOMM conference on Internet measurement, pp. 29-42. ACM (2007).
[8] Milgram, S.: The small world problem. Psychology Today 2(1), 60-67 (1967).
[9] Travers, J., Milgram, S.: An experimental study of the small world problem. Sociometry 32(4), 425-443 (1969).
[10] J. M. Guiot. A modification of Milgram's small world method. European Journal of Social Psychology, 6:503-507, 1976.
[11] P. Killworth and H. Bernard. Reverse small world experiment. Social Networks, 1:159-192, 1978.
[12] C. Korte and S. Milgram. Acquaintance links between white and negro populations: Application of the small world method. Journal of Personality and Social Psychology, 15:101-118, 1970.
[13] Nan Lin, Paul W. Dayton, and Peter Greenwald. The urban communication network and social stratification: a “small world experiment". In B. D. Ruben, editor, Communication Yearbook, volume 1, pages 107-119. Transaction Books, New Brunswick, 1978.
[14] R. L. Shotland. University communication networks: The small world method. Wiley, New York, 1976.
[15] Peter Sheridan Dodds, Roby Muhamad, and Duncan J. Watts. An experimental study of search in global social networks. Science, 301:827-829, 8 August 2003.
[16] M. E. J. Newman and Juyong Park. Why social networks are different from other types of networks. Physical Review E, 68(036122), 2003. Available as cond-mat/0305612.
[17] Reka Albert, Hawoong Jeong, and Albert-Laszlo Barabasi. The diameter of the world wide web. Nature, 401:130-131, 1999. Available as cond-mat/9907038.
[18] Andrei Broder, Ravi Kumar, Farzin Maghoul, Prabhakar Raghavan, Sridhar Rajagopalan, Raymie Stata, Andrew Tomkins, and Janet Wiener. Graph structure in the web. Proceedings on the 9th International World Wide Web Conference (WWW9), June 2000.
[19] Duncan J. Watts, Peter Sheridan Dodds, and M. E. J. Newman. Identity and search in social networks. Science, 296:1302-1305, 17 May 2002.
[20] Duncan J. Watts and Steven H. Strogatz. Collective dynamics of `small-world' networks. Nature, 393:440-442, 1998.
[21] Barabasi, A., Albert, R.: Emergence of scaling in random networks. Science 286(5439), 509 (1999)
[22] Manfred Kochen, editor. The Small World: A Volume of Recent Research Advances Commemorating Ithiel de Sola Pool, Stanley Milgram, Theodore Newcomb. Ablex, Norwood (NJ),1989.
[23] Erdos, P., Renyi, A.: On random graphs. Publicationes Mathematicae 6(26), 290-297 (1959).
[24] Watts, D., Strogatz, S.: Collective dynamics of small-world networks. Nature 393(6684), 440-442 (1998).
[25] Bela Bollobas and Fan Chung.The diameter of a cycle plus
a random matching. SIAM Journal on Discrete
Mathematics, 1:328-333, 1988.
[26] Duncan J. Watts and Steven H. Strogatz. Collective dynamics of `small-world' networks. Nature, 393:440-442, 1998.
[27] Kleinberg, J.: The small-world phenomenon: an algorithm perspective. In: Proc. of the 32nd annual symposium on Theory of computing, pp. 163-170. ACM (2000).
[28] Jon Kleinberg. The small-world phenomenon: An
algorithmic perspective. In Proceedings of the 32nd Annual Symposium on the Theory of Computation (STOC'00), May 2000.
[29] Jon M. Kleinberg. Navigation in a small world. Nature, 406:845, 24 August 2000.
[30] Bill Aiello, Fan R. K. Chung, and Linyuan Lu. A random graph model for power law graphs. Experimental Mathematics, 10:53-66, 2001. Appears under the title \A random graph model for massive graphs" in Proceedings of the 32nd Annual Symposium on the Theory of Computation (STOC'00).
[31] Tomasz Luczak. Component behavior near the critical point of the random graph process. Random Structures and Algorithms, 1:287-310, 1990.
[32] M. Molloy and B. Reed. The size of the largest component of a random graph on a fixed degree sequence. Combinatorics, Probability and Computing, 7:295-306, 1998.