!
"
#"#
$ % %#
&
''' (
A Marker Controlled Watershed Algorithm with Priori Shape Information for
Segmentation of Clustered Nuclei
M. Mohideen Fatima Alias Niraimathi*
Assistant Professor, National College of Engineering, Maruthakulam,
Tamilnadu, India.
Dr.V.Seenivasagam
Professors, Dept. of Computer Science and Engineering, National Engineering College, Kovilpatti, Tamilnadu, India.
Abstract: Microscopy cell image analysis is a fundamental tool for biological research. This analysis is used in studies of different aspects of cell cultures. Visual inspection of individual cells is very time consuming, insufficient to detect or describe delicate changes in cellular morphology. The main challenges in segmenting nuclei in histometry are due to the fact that the specimen is a 2-D section of a 3-D tissue sample. The 2-D sectioning can result in partially imaged nuclei, sectioning of nuclei at odd angles, and damage due to the sectioning process. Furthermore, sections have finite thickness resulting in aggregating or overlapping nuclei in planar images. Hence a set of image objects that differ considerably from the ideal of round blob-like shapes occur. Their sizes and shapes in images can be irregular. The classic methodology for cell detection is image segmentation, which is a fundamental and difficult problem in computer vision. Image segmentation is a fundamental and difficult problem in computer vision. The difficulty in automatic segmentation of images of cells is often uneven due to auto fluorescence from the tissue and fluorescence from out-of-focus objects. This unevenness makes the separation of foreground and background a non-trivial task. The intensity variations within the nuclei further complicate the segmentation as the nuclei may be split into more than one object, leading to over-segmentation. Due to the cell nuclei are often clustered, make it difficult to separate the individual nuclei. Hence an automatic segmentation of cell nuclei is an essential step in image histometry and cytometry. This paper presents a robust method to segment clustered overlapping or aggregating nuclei cells using priori information of shape markers and marking function in a watershed-like algorithm. The shape markers are extracted using adaptive H-minima transform and prior information about the usual shape of normal/pathological nuclei cells. A new marking function based on outer distance transform, to avoid jagged boundaries of segmented objects is created. Thus the right sets of markers and a marking function are used to accurately separate clustered nuclei.
Keywords: Active contours, aggregating/overlapping nuclei, adaptive H-minima, markers, marking function, watershed segmentation.
I. INTRODUCTION
Visual inspection of individual cells is often insufficient to detect or describe delicate important changes in cellular morphology. The primary step in quantitative analysis of cell cultures is usually the identification or segmentation of individual cells or cell nuclei. Currently, this is mostly performed manually or using semiautomatic tools available in microscopic image analysis software. However, manual segmentation of nuclei in microscopic images could be very labor-intensive, time consuming and even infeasible.
Segmentation tools are mostly based on classical techniques such as correlation matching, threshold, or morphological operations. Correlation matching fails for cells that change shape in noisy environment. Segmentation methods based on global threshold fail for images that exhibit strong intensity gradients and or noise. Preprocessing with smoothing filters and adaptive thresholding helps but could lead to merging touching cells or nuclei. Watershed transforms are used to prevent such merging but it usually lead to over segmentation unless markers are manually chosen. Due to manual intervention, the benefits of automation such as speed, reproducibility, and objectivity are lost. Hence, the development of more reliable and automated image analysis techniques for cellular imaging remains an important goal in computational molecular biology. In recent years, many image analysis approaches have been adopted for cell and nuclei segmentation from microscopic images. Image segmentation is a fundamental and difficult problem in computer vision.
The difficulty in automatic segmentation of images of cells is often uneven due to auto fluorescence from the tissue and fluorescence from out-of-focus objects. This unevenness makes the separation of foreground and background a non-trivial task. The intensity variations within the nuclei further complicate the segmentation as the nuclei may be split into more than one object, leading to over-segmentation. Due to the cell nuclei are often clustered, make it difficult to separate the individual nuclei.
Hence an automatic segmentation of cell nuclei is an essential step in image histometry and cytometry.
The manuscript is organized as follows. Section II describes the related work. Section III explains briefly the proposed method in detail. Section IV deals with results and in Section IV, conclusions and future work are presented
II. RELATED WORK
M. Mohideen F. A. Niraimathiet al, International Journal of Advanced Research in Computer Science, 2 (1), Jan. –Feb, 2011,349-355
smoothness of the local areas. The use of color quantization caused a major problem when regions of varying shades, due to illumination, appeared in the image. When the boundaries are fuzzy the traditional edge-based active contour methods [4],[5], render poor results on fluorescence microscopy images. In traditional deformable models, which consist in finding the boundaries of the object of interest by evolving contours or surfaces guided by internal and external forces [6], it is difficult to design a strategy with generalization ability to work for all images. The image energy terms are computed using intensity variances inside and outside the contour the model of active contours without edges [7] and this region-based approach provides strong robustness to noise and allows segmentation of cells with blurred edges. The methods used for cell or nuclei segmentation are unable to handle the edges of overlapping nuclei with minimal or no edge information include watershed algorithm [8], [9], multiscale analysis [10], dynamic programming-based methods [11], [12], graph-cut methods [13], and Markov random fields [14]. A nuclear segmentation algorithm based on Gaussian Markov random fields suffers from under segmentation and high false positives [14]. The gradient flow tracking method [15], find difficult in processing images composed of textured blob cells. Watershed transforms can prevent merging, but usually lead to over segmentation unless the markers are manually chosen. It makes use of some external knowledge on the collection of images under study, in the sense that it requires and initial marking step. One has to use the knowledge available on the problem-shape of the desired objects, noise present on the image, darkness of the background, etc.-to design a robust algorithm for extracting markers of the different regions to be segmented. By marker of a region, we mean a connected set of pixels (or even one single pixel) included in this region. The most critical aspect of nuclear segmentation algorithms is the process of detecting a set of points in the image, usually one per cell nucleus and close to its center, that are variously referred to as “markers” or “seeds.” These points are used by subsequent algorithms to delineate the spatial extent of each cell nucleus. The accuracy of the segmentation depends mainly on the accuracy and reliability of the initial markers.
A lot of approaches have been used to detect seed points. The early work in this field [16], [17] relied upon the peaks of the Euclidean distance map, which is often used in conjunction with the watershed algorithm [18] due to its computational efficiency and ready availability. But it has the disadvantage of detecting too many seeds, leading to over-segmentation. Another technique is to detect local maxima points in the gray-scale image using the h-maxima transform [19], [20]. This method was found to be overly sensitive to image texture, and resulted in over seeding. The classical watershed algorithm directly uses region minima or ultimate eroded points (UEPs) as seed points [21], but over segmentation is likely to happen. There are two proposals to handle this problem: region merging and marker-controlled watershed. Region merging approaches could be based on shape or sizes of cells or nuclei [9], [22], [23]. A marker-controlled watershed algorithm replaces region minima or UEP with predefined markers, each representing an object [24]. The proposed method in [25] successfully extracts cell makers, and thereby segments cells but is limited for objects with descending intensity and
having round shape. A marker extraction method based on condition erosion was proposed in [26] but the results were sensitive to the sizes of erosion structures and the thresholds of condition erosions. The marker detection algorithm in [27] combines the photometric and shape information in a framework of pattern classification that decides whether markers should be merged. The watershed transform [21] has proven to be a powerful and fast technique for both contour detection and region-based segmentation. It is simple and intuitive and can be parallelized, to produce an entire partition of the image. It has been applied to biological images [34], [35] and has given good results, especially on blurred grey level images. However, it has some drawbacks of over segmentation, sub-segmentation, and sensitivity to noise. This transform can be further improved, by the introduction of prior information [33].
However, the marking function used for watershed flooding was not mentioned and no graphic segmentation results are given to indicate the accuracy of watershed lines. Our goal is to develop a fully automatic method for segmentation of nuclei in tissues from 2-D microscopy images. We specially address the issue of segmentation of aggregating or overlapping nuclei or the phase of cell division. The initial segmentation is based on active contours. In order to detect and separate clustered nuclei in a more robust and precise way, in this paper, we enhance the shape markers and a new marking function is used in a watershed-like segmentation.
An automated technique to segment cell nuclei in fluorescence microscopy images, which is capable of accurately separating clustered nuclei proposed [31]. One of the main factors, which make it hard to accurately segment the nuclei, is the existence of clustered nuclei in the cell images [31]–[33]. The watershed algorithm is one of the most widely used segmentation techniques for nuclei extraction [32]. An adaptive H-minima transform is also proposed to accurately find shape markers, avoiding over segmentation. The shape markers convey not only the number and location of nuclei but also represent shapes of the nuclei. A new marking function based on outer distance transform on the initial segmentation is introduced in place of traditional inner distance transform. The new algorithm produces smooth or straight boundaries unlike other watershed-based methods that usually produce jagged boundaries. This method generates smoother watershed lines, and thus obtains higher accuracy in nuclei separation than the earlier methods. But the method is based on the presumption that there exists one-to-one correspondence between shape markers and objects. Therefore, when the size and the shape of nuclei vary a lot in one cluster, the algorithm could fail to detect the correct number of nuclei.
III. PROPOSED METHOD
A. Watershed- An introduction
M. Mohideen F. A. Niraimathiet al, International Journal of Advanced Research in Computer Science, 2 (1), Jan. –Feb, 2011,349-355
of the image. Watershed segmentation can be implemented with sorted pixel lists (Vincent & Soille, 1991). This implies that the segmentation can be performed very rapidly. In the method described by Vincent & Soille (1991), pixels/ voxels that are located at an equal distance from two catchment basins become part of the watershed lines. This means that we sometimes get thick watershed lines, leading to pixels/voxels that are not part of any catchment basin. In our implementation of the watershed algorithm, we keep track of the pixels/voxels that are ambiguous, i.e. located at an equal distance from two or more catchment basins, and let water flow around them. As a last step of the watershed, the most common neighbouring label is assigned to the ambiguous pixels/voxels, and every pixel/voxel is thereby made part of a catchment basin. This is necessary for the subsequent merging step described below. In our seeded version of the watershed segmentation, water will rise from pixels marked as seeds, as well as from non seeded regional minima found in the image. Separating dams, or watersheds, are built only between catchment basins associated with different seeds. As soon as the water level of a seeded catchment basin reaches the weakest point of the border towards a non-seeded regional minimum, it will be flooded. The water will continue to rise until each seeded catchment basin in the gradient magnitude image meets another seeded catchment basin A popular region growing method, which has proved to be very useful in many areas of image segmentation and analysis, is the so-called watershed algorithm. Watershed segmentation has then been refined and used in very many situations (for an overview see Meyer & Beucher, 1990; Vincent, 1993). The main difference between the watershed method and ordinary region growing is that the watershed method works per intensity layer instead of per neighbor layer. If the intensity of the image is interpreted as elevation in a landscape, the watershed algorithm will split the image into regions similar to the drainage regions of this landscape. The watershed borders will be built at the crests in the image. In a gradient magnitude image, water will start to rise from minima representing areas of low gradient, i.e. the interior of the objects and the background, and the watershed borders will be built at the maxima of the gradient magnitude. However, if watershed segmentation is applied directly to the gradient magnitude image, it will almost always result in over-segmentation, owing to the intensity variations within both objects and background. Instead of letting water rise from every minimum in the image, water can be allowed to rise only from places marked as seeds. Seeded watersheds have previously been described (e.g. Meyer & Beucher, 1990; Beucher, 1992; Vincent, 1993).Fully automatic foreground seeding is tricky, and using morphological filtering, one often ends up with more than one seed per object, or objects containing no seed at all. More than one seed per foreground object will in many methods (i.e. Meyer & Beucher, 1990) result in background seeds passing through foreground components, leading to incorrect segmentation results. Cell nuclei are usually convex and do not show narrow waists.
The shape of the cell nuclei itself can therefore be used for a priori modeling, or as an object-specific feature, in the search for a suitable segmentation method discriminating between single nuclei and clusters of nuclei. The method begins with an initial segmentation of nuclei, using active contours without edges. Then, an enhanced
marker-controlled watershed algorithm with a new marking function capable of accurately separating clustered nuclei is applied. The flow chart of the proposed method is as shown in Fig 1.
Figure 1
B. Object Segmentation
For the segmentation of nuclei from background, the model of active contours without edges was adopted [7]. In traditional edge-based active contours, image energy is taken as the integral of locally computed features along the contour. In contrast, region-based methods compute image energy from surface integrals over the entire image. More specifically, image energy is defined using intensity variances inside and outside of the contour. However, watershed usually yields over segmentation since regional minima or ultimate eroded points are employed for segmenting nuclei directly. This is because it is difficult to have one-to-one correspondence between regional minima and nuclei. In addition, it becomes worse when the nuclei are clustered. To handle the over segmentation problem, region merging and marker-controlled watershed techniques have been reported in the literature [31], [32]. The region merging techniques are highly sensitive to the sizes of nuclei. The marker-controlled watershed schemes formulate the segmentation as a marker extraction problem. In the marker-controlled watershed methods, nuclei should be initially represented by the markers appropriately [31], [32].
Thus, the step for elimination of spurious markers that result in over segmentation of nuclei needs to be employed in the marker-controlled watershed. Meanwhile, mathematical morphology has been involved to obtain the markers accurately [32]. In [32], a maker detection technique based on condition erosion has been introduced. However, the segmentation results tend to rely on incorporated morphological structuring elements and erosion thresholds.
The H-minima or H-maxima transform is a powerful mathematical tool to suppress undesired minima or maxima [31], Cheng and Rajapakse [31] proposed a marker-controlled watershed technique using the H minima
Initial Segmentation
Morphological operations
Watershed transform Markers
Segmented image Marking function
M. Mohideen F. A. Niraimathiet al, International Journal of Advanced Research in Computer Science, 2 (1), Jan. –Feb, 2011,349-355
transform. Therefore, region-based models are robust to noise and allow segmentation of objects with blurred edges. The active contours are implicitly represented by a single level set function and changes in objects appear automatically as the level set function evolves. This enables automatic detection of an arbitrary number of objects from an arbitrary initial front. We chose to initialize the level set function as a small circle at the center of the image. The energy function of the active contour is based on a reduced form of the Mumford–Shah function for image segmentation
( ,
I,
0)
( )
x y mean intensity of pixels inside and outside the zero level set.H and
δ
are the Heaviside and Dirac functions.λ
I ,λ
0 , andα
are fixed positive parameters.The minimization of image energy is accomplished by letting the level set function evolve as a function of an abstract time t, starting from an initialization
2 2 contours. The other two forces on the right-hand side move the contour toward the actual boundary of objects. After nuclei are segmented by active contours, the segmentation was refined by a series of morphological operations. First, the holes within segmented nuclei are filled as they could affect the result of subsequent distance transforms and cause incorrect separation of clusters. Thereafter, tiny objects unlikely to be the fragments of real nuclei are discarded by performing morphological opening with a disc structuring element.
[a] Shape Markers
The watershed segmentation algorithm uses a relief function f, usually the gradient of the intensity, giving the altitudes of a topographic surface from its regional minima. The watershed line is generally a set of points equidistant to the regional minima of the relief function measured by a topographic distance and often used in segmentation objects in images [15]. Marker-controlled watersheds flood from the markers that can be regarded as the first estimation of the image partitioning [18]. We use the initial segmentation of nuclei obtained by active contours to generate markers by using an inner distance transform. The inner distance transform converts the binary image, consisting of
foreground and background pixels, into a distance map measured using Euclidean distance, where every foreground pixel has a value corresponding to the minimum distance from the background. The regional minima of the inverse of the inner distance map are regarded as markers. H-minima transform is often used to prevent over segmentation. It suppresses all minima, less than a particular depth h of the relief function [22]. In other words, the intensity of the transformed image is controlled by a minima suppression parameter h, lower values of which could lead to over segmentation while higher values may fail to separate touching objects. In this way, H-minima transform suppresses undesired minima. We presume that there exists one-to-one correspondence between the markers and the objects. To accurately find the value of h, an adaptive
H-minima transform is introduced to extract the correct
M. Mohideen F. A. Niraimathiet al, International Journal of Advanced Research in Computer Science, 2 (1), Jan. –Feb, 2011,349-355
and shape of nuclei, and are used as the set of minima to impose onto the marking function.
[b] Enhanced Shape Markers
Overlapping/aggregating nuclei have intersecting contours in points of high concavity. To select those involved in the segmentation process among the all set of concavity points, prior information about normal or abnormal nuclei has to be used [36]. For example, normal nuclei have a slightly elongated but regular shape with a quite small area, while abnormal nuclei might be much bigger and/or lobulated. In fact, points of significant concavity that are extracted can correspond to aggregating or overlapping nuclei areas, but also to lobulated areas of abnormal nuclei. For this purpose, two templates of high biological plausibility have been established:
- overlapping template, - aggregating template.
The overlapping template shown in Fig 2 is based on the hypothesis that if two nuclei overlap, the connected component has to be enough elongated to contain two nuclei. [AB] is the potential segment of separation that connects two significant concavity points. All the points C, D, E, F, G, and H of the template have to be inside the connected component. At the moment, the distances CD, EF=GH are evaluated by observing a high number of nuclei.
Figure 2
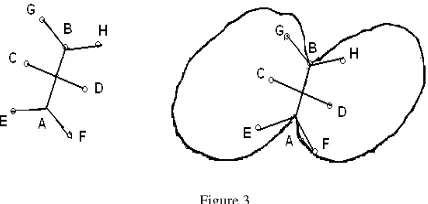
The aggregating template shown in Fig 3 illustrates the fact that in aggregating areas, there is a narrow passage. The distances CD, EA=AF=GB=BH are also evaluated by observing a high number of nuclei. The angles are measured in function of tangent vectors left and right of concavity points A and B. As the template could be too rigid, some flexibility is introduced with the following rule: "Only one point among the points C, D, E, F, G, and H could be outside the connected component".
If a potential segment of separation [AB] fits the overlapping template, the aggregating template, which is more restrictive, is then tested. If the aggregating template is fitted, the segment [AB] is validated as a line of separation between nuclei in contact.
Figure 3
On the contrary, it could be validated as a segment of separation between overlapping nuclei. But, in some cases of very big and lobulated nucleus, a potential segment of separation might fit the overlapping template, though there is no overlapping area. Therefore, in order to distinguish these two configurations, a study of the grey levels intensity along [AB] is performed. In case of overlapping nuclei, the grey level intensity is far higher in the area of overlapping than the mean intensity of the connected component. In case of a big lobulated nucleus, no significant variation of grey levels can be observed, and then the potential segment of separation is rejected.
C. Marking Function
The segmentation by watershed algorithm depends not only on the markers but also on the marking function f—the topographic surface flooded by water. A good marking function should synthesize physical characteristics of the objects to segment and have different markers and catchment basins characterizing the desired objects. For separation of partially overlapping objects in binary images, the inverse inner distance map is chosen as the classical marking function [21]. In the hill climbing implementation of watershed [28], an approximation is necessary to provide an ordered queue to pixels of the same gray level. This approximation of the marking function often results in jagged watershed lines [39], as it uses a chessboard distance pattern in place of Euclidean distance to compute the distance function across plateaus. A new marking function based on outer distance transform, [31] to avoid jagged boundaries of segmented objects is created. The outer distance transformconverts a binary image into a distance map where every background pixel has a value corresponding to the minimum distance from shape markers. As the outer distance transform measures the distance from the shape markers, resulting distance map resembles the shape of nuclei.
Given an initial segmentation and shape markers M= (M1 ,M2, . . . ,MK ), the new marking function is generated as follows.
[a] Calculate the Euclidean distance transform
( ) i n f ( , )
i
i y M
D x D x y
∈
=
where D(x, y) is the Euclidean distance between points x and y, and Di(x) corresponds to the minimum distance between x and the shape marker Mi .
[b] Obtain the marking function by ( ) m i n { i i( ) }
i
f x = d + D x
where di is the level (value) of the marking function f
M. Mohideen F. A. Niraimathiet al, International Journal of Advanced Research in Computer Science, 2 (1), Jan. –Feb, 2011,349-355
IV. CONCLUSION AND FUTURE WORK
An algorithm based on nuclei size, the distance to nuclei centers, etc., may distinguish them from holes inside nuclei. A priorbiological knowledge of the cells based on the watershed transform that can deal with aggregating or overlapping nuclei is introduced into the segmentation process. Prior information about nuclei is used to improve information such as texture of intensities Future works will be devoted to the introduction of a formal learning step in order to obtain optimal aggregating/ overlapping templates based on biological knowledge extracted as rules or image Image Applications (CVBIA), 2005, pp. 535–543. [2] G. Xiong, X. Zhou, L. Ji, P. Bradley, N. Perrimon, and
S. Wong, “Segmentation of drosophila RNAI fluorescence images using level sets,” in Proceedings IEEE International Conference on Image Processing, 2006, pp. 73–76.
[3] Y. Deng and B. Manjunath, “Unsupervised segmentation of color-texture regions in images and video,” IEEE Trans. Pattern Anal. Mach. Intell., vol. 23, no. 8, pp. 800–810, Aug. 2001.
[4] M.Kass, A.Witkin, and D.Terzopoulos, “Snakes:Active contour models,” Int. J. Comput. Vis., vol. 1, no. 4, pp. 321–331, 1987.
[5] S. Osher and J. A. Sethian, “Fronts propagating with curvature-dependent speed: Algorithms based on Hamilton–Jacobi formulations,” J. Comput. Phys., vol. 79, pp. 12–49, 1988.
[6] P. Moore and D. Molloy, “A survey of computer-based deformable models,” in International Machine Vision and Image Processing Conference (IMVIP), 2007, pp. 55–66.
[7] T. F. Chan and L. A. Vese, “Active contours without edges,” IEEE Trans. Image Process., vol. 10, no. 2, pp. 266–277, Feb. 2001.
[8] A. Pinidiyaarachchi and C. W¨ahlby, “Seeded watersheds for combined segmentation and tracking of cells,” in Proc. Int. Conf. Image Anal. Process. (ICIAP), 2005, vol. 3617, pp. 336–343.
[9] G. Lin, M. K. Chawla, K. Olson, J. F. Guzowski, C. A. Barnes, and B. Roysam, “Hierarchical, model-based merging of multiple fragments for improved three-dimensional segmentation of nuclei,” Cytometry Part A, vol. 63A, pp. 20–33, 2005.
[10] P. R. Gudla, K. Nandy, J. Collins, K. J. Meaburn, T. Misteli, and S. J. Lockett, “A high-throughput system for segmenting nuclei using multiscale techniques,” Cytometry Part A, vol. 73A, pp. 451–466, 2008. [11] D. Baggett, M. Nakaya, M. McAuliffe, T. P. T. Misteli, and S. Lockett, “Segmentation of whole cells and cell nuclei from 3-D optical microscope images using dynamic programming,” IEEE Trans.Med. Imag., vol. 27, no. 5, pp. 723– 734, May 2008.
[13] Y. Boykov and G. Funka-Lea, “Graph cuts and efficient N-D image segmentation,” Int. J. Comput. Vis., vol. 70, no. 2, pp. 109–131, 2006. [13] [14] B. L. Luck, K. D. Carlson, A. C. Bovik, and R. R. Richards-Kortun, “An image model and segmentation algorithm for reflectance confocal imagesof in vivo cervical tissue,” IEEE Trans. Image Process., vol. 14, no. 9,pp. 1265– 1276, Sep. 2005.
[15] G. Li, T. Liu, A. Tarokh, J. Nie, L. Guo, A. Mara, S. Holley, and S. T. Wong. (2007). 3D cell nuclei segmentation based on gradient flow tracking. BMC Cell Biol. [Online]. 8(40). Available: http://www. biomedcentral.com/1471-2121/8/40
[16] H. Ancin, B. Roysam, T. E. Dufresne, M. M. Chestnut, G. M. Ridder D. H. Szarowski, and J. N. Turner, “Advances in automated 3-D image analyses of cell populations imaged by confocal microscopy,” Cytometry, vol. 25, no. 3, pp. 221–234, Nov. 1, 1996. [17] N. Malpica, C. O. de Solorzano, J. J. Vaquero, A.
Santos, I. Vallcorba, J. M. Garcia-Sagredo, and F. del Pozo, “Applying watershed algorithms to the segmentation of clustered nuclei,” Cytometry, vol. 28, no. 4, pp. 289– 297, Aug. 1, 1997.
[18] G. Lin, U. Adiga, K. Olson, J. F.Guzowski, C. A. Barnes, and B. Roysam, “A hybrid 3D watershed algorithm incorporating gradient cues and object models for automatic segmentation of nuclei in confocal image stacks,” Cytometry A, vol. 56, no. 1, pp. 23–36, Nov. 2003.
[19] C. Wahlby, I. M. Sintorn, F. Erlandsson, G. Borgefors, and E. Bengtsson, “Combining intensity, edge and shape information for 2D and 3D segmentation of cell nuclei in tissue sections,” J. Microsc. Oxford, vol. 215, pp. 67–76, Jul. 2004.
[20] P. Soille, Morphological Image Analysis: Principles and Applications. Berlin, Germany: Springer-Verlag Telos, 1999.
[21] L. Vincent and P. Soille, “Watersheds in digital spaces: An efficient algorithm based on immersion simulations,” IEEE Trans. Pattern Anal.Mach. Intell., vol. 13, no. 6, pp. 583–598, Jun. 1991.
[22] X. Chen, X. Zhou, and S. T. C. Wong, “Automated segmentation, classification, and tracking of cancer cell nuclei in time-lapse microscopy,” IEEE Trans. Biomed. Eng., vol. 53, no. 4, pp. 762–766, Apr. 2006.
[23] P. S. U. Adiga and B. B. Chaudhuri, “An efficient method based on watershed and rule-based merging for segmentation of 3-D histo-pathological images,” Pattern Recognit., vol. 34, pp. 1449–1458, 2001. [24] F. Meyer and S. Beucher, “Morphological
segmentation,” J. Vis. Commun. Image Representation, vol. 1, no. 1, pp. 21–46, 1990.
M. Mohideen F. A. Niraimathiet al, International Journal of Advanced Research in Computer Science, 2 (1), Jan. –Feb, 2011,349-355
clustered nuclei,” Cytometry, vol. 28, pp. 289–297, 1997.
[26] X. Yang, H. Li, and X. Zhou, “Nuclei segmentation using marker controlled watershed, tracking using mean-shift, and Kalman filter in time-lapse microscopy,” IEEE Trans. Circuits Syst. I, Reg. Papers, vol. 53, no. 11, pp. 2405–2414, Nov. 2006.
[27] K. Z. Mao, P. Zhao, and P.-H. Tan, “Supervised learning-based cell image segmentation for p53 immunohistochemistry,” IEEE Trans. Biomed. Eng., vol. 53, no. 6, pp. 1153–1163, Jun. 2006.
[28] S. Beucher and F. Meyer, “The morphological approach to segmentation: The watershed transformation,” in Proc. Math. Morphol. Image Process.,1993, pp. 433– 481.
[29] R. Beare and G. Lehmann. (2006, Jan.–Jun.). The watershed transform in ITK—Discussion and new developments. Insight J. [Online]. Available: http://www.insight-journal.org/browse/journal/4 [30] F. Meyer, “Topographic distance and watershed lines,”
Signal Process., vol. 38, no. 1, pp. 113–125, 1994. [31] Jierong Cheng and Jagath C. Rajapakse, “Segmentation
of Clustered Nuclei With Shape Markers and Marking Function” IEEE Trans. Biomed. Eng., vol. 56, no. 3, pp. 741–748, Mar. 2009.
[32] X. Yang, H. Li, and X. Zhou, “Nuclei segmentation using markercontrolled watershed, tracking using mean-shift, and Kalman filter in time-lapse microscopy,” IEEE Trans. Ciruits Syst. I: Reg. Papers, vol. 53, no. 11, pp. 2405–2414, Nov. 2006.
[33] F. Cloppet and A. Boucher, “Segmentation of overlapping/aggregating nuclei cells in biological images,” in Proc. IEEE Int. Conf. Pat. Rec., 2008, pp. 1–4.
[34] J. AF Costa, ND Mascarenhas, and ML De Andrade Netto, Cell nuclei segmentation in noisy images using morphological watersheds, Proc. SPIE vol. 3164, pp. 314-324, 1997.
[35] Xiaowei Chen; Xiaobo Zhou; Wong, S.T.C.,Automated segmentation, classification, and tracking of cancer cell nuclei in time-lapse microscopy, IEEE Transactions on Biomedical Engineering, Volume 53, Issue 4, April 2006 Page(s): 762 – 766