JACKSON, MAKENZIE ELIZABETH BRYSON. Developing Methods for Measuring the Physical Stability of Protein Ingredients Alone or in Beverages (Under the direction of Dr. E. Allen Foegeding).
Protein beverages are a rapidly growing segment in the area of functional foods. It has been shown that consumers desire ≥ 20 grams of protein per serving, with a preference for whey proteins. However, an issue presents itself as protein beverages are colloidal systems and the thermal process denatures proteins and can cause unwanted phase separation, gelation, or large aggregates. The physical destabilization process over time is not well understood, thus the purpose of this study is to investigate the meso- scale for physical stability of high-protein beverages by analysis of protein particles immediately post processing for thermal stability and over the course of eight weeks for understanding of shelf stability.
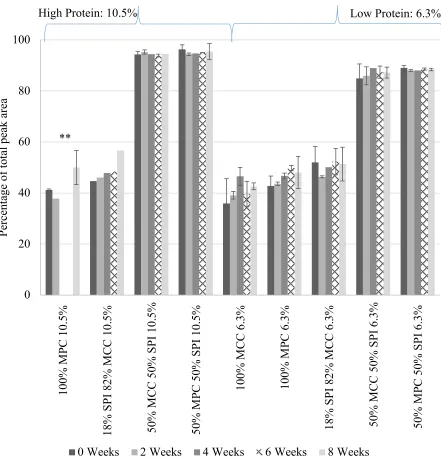
This study was split into two phases. In phase one, high-protein beverages (6.3% and 10.5% (wt/wt) protein) either classified as high-casein or high-whey protein were ultra-high temperature processed (141°C for 2.5 seconds) and analyzed for eight weeks under storage at 4°C using particle size analysis by laser diffraction, soluble protein fractionation, and size exclusion chromatography methods. Particle size analysis and mass balance of soluble protein showed that casein-enriched beverages were more thermally stable. Size exclusion
chromatography showed that over the eight weeks, the casein-enriched beverages also had less aggregation over time, indicating a higher level of stability.
some differences in thermal stability, with milk protein concentrate alone being more thermally stable, but no temporal results were seen. Size-exclusion chromatography demonstrated that secondary aggregation was occurring in all samples, and that the blend of whey protein and milk protein aggregated more rapidly. Settling behavior showed two patterns of destabilization, an increase in particle size overall and settling of particles over time. The most stable protein solution was milk protein concentrate at 6% (wt/wt) protein, at 11% (wt/wt) protein, the solution was too viscous to measure. The blend of milk protein concentrate and whey protein isolate was also more stable at 6% (wt/wt) protein, at 11% (wt/wt) protein, a greater settling pattern was recorded, and a greater extent of secondary aggregation was also recorded.
by
Makenzie Elizabeth Bryson Jackson
A thesis submitted to the Graduate Faculty of North Carolina State University
in partial fulfillment of the requirements for the degree of
Master of Science
Food Science
Raleigh, North Carolina 2019
APPROVED BY:
_______________________________ _______________________________ Dr. E. Allen Foegeding, Dr. MaryAnne Drake
Committee Chair
BIOGRAPHY
Makenzie Jackson is a Raleigh native and NC State University alum. After graduation from high school and spending a half-year abroad teaching in Burundi, Africa, she discovered the discipline of food science while pursuing a degree in nutrition science. After taking Dr. Foegeding’s Food Chemistry course, it sealed the deal: food science was what she wanted to study, especially analytical chemistry. After three years of interning with the Analytical team at the Golden Leaf Biomanufacturing Training and Education Center with Dr. Nathaniel Hentz, she interned for a summer at PepsiCo in Valhalla, New York in the forensics lab. When the
opportunity came for her to work under the guidance of Dr. Foegeding as a graduate student, it was a perfect fit.
ACKNOWLEDGMENTS
No man is an island, and the journey of creating this thesis has shown me how true that is. I wouldn’t be here without so many wonderful people who invested in me over the years and who provided endless encouragement and pushed me when it was needed. I would specifically like to say:
Thank you to my parents for investing in my education and fostering the environment for growing up with curiosity and wonder.
Thank you, Dr. Foegeding for mentoring me as an undergraduate, which ended with me as your student. I am proud to be student number 65 (!) of your research program.
Thank you to my knowledgeable and helpful committee members, Dr. Drake, Prof vZ, and Dr. Hentz. Without Dr. Hentz’s persistence in telling me to pursue graduate school, I likely wouldn’t be writing this thesis (and he wouldn’t be having to read it).
Thank you to Ms. Paige Luck for her encouragement, knowledge, and meticulous organization that kept the lab running so well. Thank you to Ashley (Dr. Young!), who befriended me as she worked on her post-doc in the Foegeding Lab and who shared so much wisdom about thriving in graduate school.
MAJOR thank you to Will Jackson: without his love, support, kindness, and humor, this journey would have been infinitely harder.
TABLE OF CONTENTS
LIST OF TABLES ... vii
LIST OF FIGURES ... viiii
Chapter 1. LITERATURE REVIEW ... 1
1. INTRODUCTION ... 1
1.1. An industrial problem: shelf stability of thermally processed protein beverages ... 1
2. MILK PROTEINS AND INGREDIENTS ... 2
2.1. Bovine milk proteins ... 2
2.2. Dairy protein ingredients ... 4
2.3. Casein-based ingredients, including milk protein concentrates ... 4
2.4. Whey/serum proteins ... 7
2.4.1. Whey protein concentrates ... 9
2.4.2. Whey protein isolates ... 9
3. PROTEIN BEVERAGE THERMAL PROCESSING ... 10
3.1. Pasteurization and ultra-pasteurization ... 11
3.2. Commercial sterilization and retort processing ... 12
3.2.1. Retort processing ... 13
3.2.2. Ultra-high temperature processing ... 13
4. PHYSICAL STABILITY OF PROTEIN BEVERAGES ... 14
4.1. Thermal stability ... 15
4.2. Colloidal shelf stability ... 16
4.3. Aggregation ... 17
4.4. Precipitation or sedimentation ... 18
4.5. Gelation and age-gelation ... 18
4.6. Factors contributing to stability ... 19
4.6.1. Protein type and concentration ... 19
4.6.2. Effect of pH ... 20
5. CHARACTERIZING THERMAL AND COLLOIDAL SHELF STABILITY FOR PROTEINS IN BEVERAGES ... 21
5.1. Changes in solubility... 22
5.2. Turbidity ... 23
5.3. Particle size ... 24
5.4. State diagrams ... 25
6. MOTIVATIONS AND APPROACH ... 25
6.1. Beverage formulation ... 26
6.2.Heating methods ... 27
6.3.Particle size by laser diffraction ... 27
6.4. Particle fractionation/mass balance ... 27
7. FIGURES ... 30
8. TABLES ... 33
9. REFERENCES ... 35
CHAPTER 2. ANALYSIS OF PROTEIN PARTICLES REVEALS AGGREGATION PATTERNS ASSOCIATED WITH PHYSICAL STABILITY ... 43
1. ABSTRACT ... 43
2. INTRODUCTION ... 44
3. MATERIALS AND METHODS ... 48
3.1. Ingredients ... 48
3.1.1. Micellar casein ... 48
3.1.2. Milk protein concentrate ... 49
3.1.3. Serum protein isolate ... 49
3.1.4. Additional ingredients and beverage formulation ... 49
3.2. Beverage preparation ... 50
3.3. Sampling ... 50
3.4. Particle size analysis ... 50
3.5. Protein aggregate size fractions ... 51
3.6. Mass balance and total nitrogen ... 51
3.7. Size exclusion high performance liquid chromatography ... 52
4. RESULTS AND DISCUSSION ... 52
4.1. Particle size ... 52
4.2. Protein mass balance ... 54
4.3. Size exclusion high performance liquid chromatography ... 55
5. CONCLUSIONS ... 56
6. FIGURES ... 58
7. TABLES ... 64
8. REFERENCES ... 67
CHAPTER 3. INDICATORS OF PHYSICAL STABILITY IN RETORT PROCESSED BEVERAGES ... 69
1. ABSTRACT ... 69
2. INTRODUCTION ... 70
3. MATERIAL AND METHODS ... 71
3.1. Protein ingredients ... 71
3.2. Protein solutions ... 72
3.3. Retort processing ... 73
3.4. Z-scanned backscattering measurement ... 74
3.5. Particle size analysis ... 74
3.6. Soluble protein quantification and aggregation by size exclusion chromatography ... 75
4. RESULTS AND DISCUSSION ... 75
4.2. Particle size analysis ... 78
4.3. Soluble protein quantification and aggregation by size exclusion chromatography ... 79
5. CONCLUSIONS ... 80
6. FIGURES ... 81
7. TABLES ... 88
8. REFERENCES ... 90
CHAPTER 4. CONCLUSIONS AND FUTURE WORK ... 91
1. CONCLUSIONS ... 91
2. FUTURE WORK ... 94
3. TABLES ... 95
4. REFERENCES ... 96
APPENDICES ... 97
Appendix 1. Soluble Protein Fractions (percent of total protein) For Beverages Averaged Over Eight Weeks of Storage ... 98
Appendix 2. Soluble Protein Fractions for Beverages Containing 6.3% (wt/wt) Protein ... 99
Appendix 3. Soluble Protein Fractions for Beverages Containing 10.5% (wt/wt) Protein ... 100
Appendix 4. Protein and mineral content of protein ingredients ... 101
Appendix 5: Map of Autoclaved Samples ... 102
LIST OF TABLES
Table 1.1 Typical compositions of milk protein concentrate (g/100g) ... 33
Table 1.2 Composition of different whey powders (g/100g) ... 33
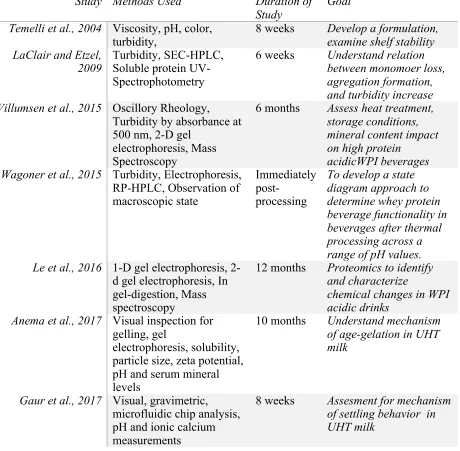
Table 1.3 Summary of Shelf Life Studies ... 34
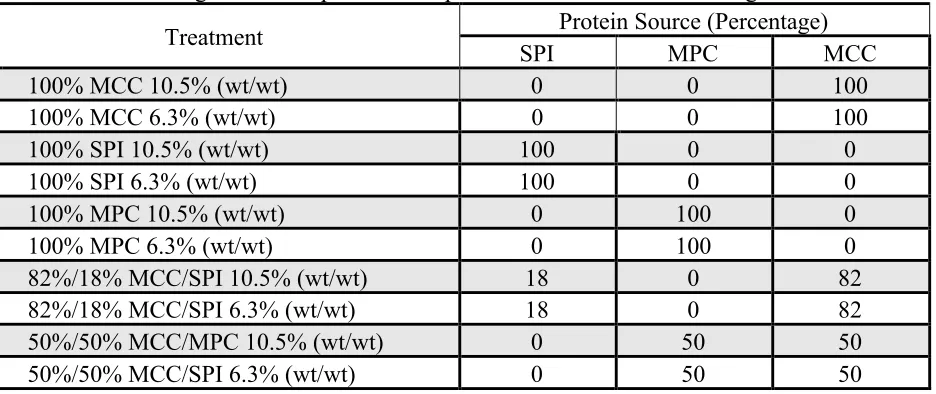
Table 2.1 Protein ingredient composition and protein concentration of beverages ... 64
Table 2.2 Particle diameter (µm) of beverages reported as the Dx (90) ... 64
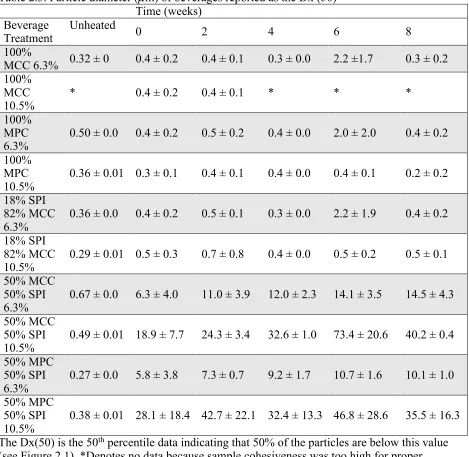
Table 2.3 Particle diameter (µm) of beverages reported as the Dx (50) ... 65
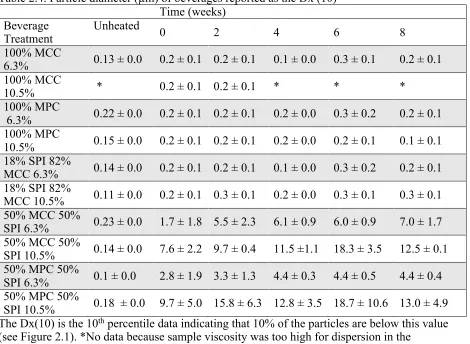
Table 2.4 Particle diameter (µm) of beverages reported as the Dx (10) ... 66
Table 3.1 Retort thermal processing schedule ... 88
Table 3.2 Particle diameter at Dx(90) for retort processed beverages ... 88
Table 3.3 Particle diameter at Dx(50) for retort processed beverages ... 88
Table 3.4 Particle diameter at Dx(10) for retort processed beverages ... 89
LIST OF FIGURES
Figure 1.1 Turbidity of 1% (wt/wt) WPI solutions from pH 3.3 to 4.0 post-heating ... 30
Figure 1.2 State Diagrams from Wagoner et al. (2015). ... 31
Figure 1.3 Illustration of principle for mass balance of protein ... 32
Figure 2.1 Values of Dx(10), Dx(50) and Dx(90) represented on the distribution curve ... 58
Figure 2.2 Chromatogram of 100% micellar casein, 50% milk protein concentrate plus 50% serum protein isolate, and molecular weight markers at 280 nm ... 59
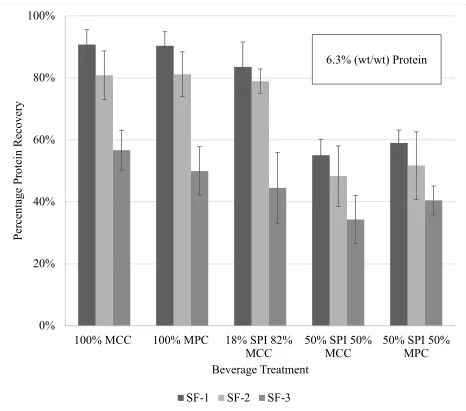
Figure 2.3 Beverages containing 6.3% (wt/wt) protein solutions mass balance recovery ... 60
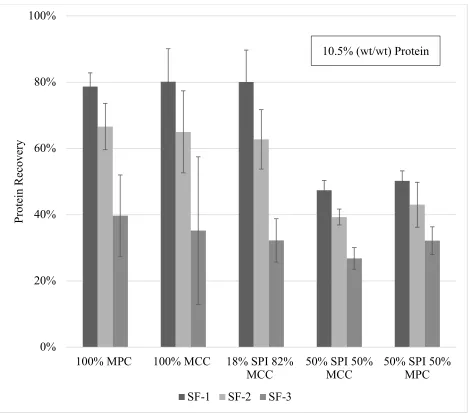
Figure 2.4 Beverages containing 10.5% (wt/wt) protein solutions mass balance recovery ... 61
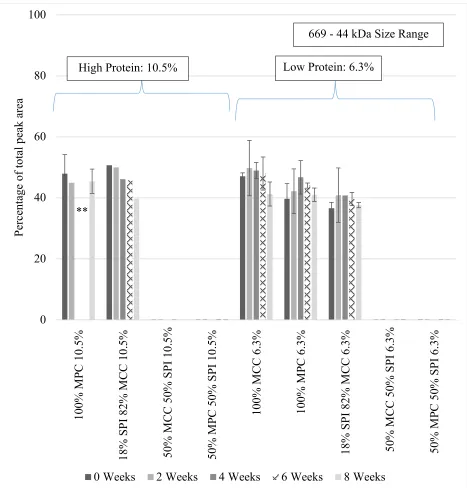
Figure 2.5 Changes in the 669-44kDa size class from size exclusion chromatography ... 62
Figure 2.6 Changes in percentage of total peak area for >669kDa size class from size exclusion chromatography ... 63
Figure 3.1a Change in backscattering for 100% MPC at 6% (wt/wt) protein ... 81
Figure 3.1b Change in backscattering for 50% WPI 50% MPC at 6% (wt/wt) protein ... 81
Figure 3.1c. Change in backscattering for 50% WPI 50% MPC at 11% (wt/wt) protein ... 82
Figure 3.1d. Change in backscattering for 100% MPC at 11% (wt/wt) ... 82
Figure 3.2a Global Turbiscan Stability Index (TSI) for changes across the length of a tube observed for 77 days ... 83
Figure 3.2b Turbiscan Stability Index (TSI) for changes across the bottom portion of each tube observed over 77 days ... 83
Figure 3.2c Turbiscan Stability Index (TSI) for changes across the middle portion of each tube observed over 77 days ... 84
Figure 3.3 Recorded change in backscattering for all samples ... 85
Figure 3.4 Recovered protein post 0.45 µm filtration prior to loading on SEC-HPLC averaged across 8 weeks ... 86
CHAPTER 1. LITERATURE REVIEW
1. INTRODUCTION
Protein beverages are a growing segment within functional foods (Beverage Industry, 2017). The format of protein beverages is a popular option for those who are seeking to increase their protein intake. Beverages such as protein-fortified smoothies, meal replacement drinks, and pre-and-post workout beverages all fall under the umbrella of functional food. One major
challenge with protein beverages is that they are colloidal systems rather than true solutions, and therefore are inherently unstable and constantly undergoing phase separation. Protein beverages are sols, a solid particle phase dispersed in a continuous fluid, and the solid phase is undergoing settling and possibly aggregation.
There are two general forms of physical stability described in reference to protein beverages – thermal stability reflecting the ability of a formulation to undergo thermal
processing and remain a homogeneous sol and shelf stability that can be defined as the time post processing that the sol remains fluid and visually homogeneous. The goal of this thesis was to develop and evaluate a method that could be used to gain more insight into physical
1.1. An industrial problem: shelf stability of thermally processed protein beverages
Dairy protein is a growing commodity, with 51% of U.S. consumers trying to incorporate more protein into their diets (Gerdes, 2012). Additionally, the Food and Agriculture
Organization (FAO) projects a 33% increase in the world population, rising to 9.8 billion by 2050 (UnitedNations, 2017). With this increase, food production will need to be able to meet the demands for sources of high-quality proteins. An excellent source of protein can be found in bovine milk, rated as 10-30% higher quality on the Digestible Amino Acid Score over plant proteins such as soy, pea, and rice (Lagrange et al., 2015). Because dairy products are considered a complete protein source and can improve muscle protein synthesis, they are an ideal choice for everyone from athlete to infant (Litwin et al., 2015).
Recent market research projects a compound annual growth rate of 5 percent in the ready to drink protein beverages market over the years 2018-2022, with whey protein-based beverages taking a 41 percent share of the market (Entertainment Close-Up, 2018). While there is no current legal standard for protein content for a drink to qualify as a “protein beverage,” Oltman et al. (2015) found that consumers desire ≥ 20 grams of protein per serving and have a preference for whey as the primary protein source.
These beverages must be processed to inactivate spoilage and pathogenic
microorganisms, which presents a challenge because thermal processing may influence colloidal stability of beverages by denaturing proteins and causing various extents of aggregation
depending on conditions such as pH, ionic strength, and protein concentration (Singh et al., 2015). While types of thermal treatments vary, most heating processes are above the
viscosity, it is aggregation that produces the undesirable states of precipitation, phase separation, or gelation.
2. MILK PROTEINS AND MILK INGREDIENTS
2.1. Bovine milk proteins
Milk protein ingredients may be in the form of individual proteins, protein classes, or combinations of proteins. Dairy proteins have been studied since the start of protein chemistry. In 1838, the scientist who coined the term “protein,” J.G. Mulder, created a method for the preparation of proteins from milk using acid (McSweeney and O’Mahony, 2016). The acid-induced coagulum was referred to as casein (McSweeney and O’Mahony, 2016). It was believed that the proteins extracted were the only proteins found in milk; however, Olav Hammarsten showed in 1880 that the proteins in milk can be fractionated into two well-defined groups by dropping milk to a pH of 4.6 (Hammarsten, 1883). The proteins that precipitate at pH 4.6 were referred to as isoelectric casein while those which remained soluble in these conditions were referred to as whey or serum proteins.
In bovine milk, the ratio of casein to whey proteins is approximately 80:20. It was initially assumed that casein consisted of only one type of protein, but further investigation revealed this casein was actually a heterogenous mixture of proteins (Osborne and Wakeman, 1918).
Following research revealed that isoelectric casein is comprised of a- and ß-caseins. Within the
a-casein, it was determined that there were calcium sensitive (as) fractions that were two
separate proteins, as1- and as2-. A calcium insensitive fraction (k-) was also found that is
Up until the 1950s, the whey fraction of milk proteins was typically discarded as it was considered the byproduct (waste stream) of cheesemaking; however, advancements in separation, concentration, and purification techniques have allowed whey to become the source of several valuable ingredients (Smithers, 2008). Cheese whey (or milk serum) contains a variety of proteins, including: b-lactoglobulin, a-lactalbumin, serum albumin,
immunoglobulins, lactoferrin, lactoperoxidase and others, with b-lactoglobulin, a-lactalbumin,
serum albumin being the most abundant (Hahn et al., 1998). The functionality of whey protein ingredients will be covered in section 2.4.
2.2. Dairy protein ingredients
Dairy protein ingredients are typically prepared from a whey stream or skim milk. Whole milk may be used, but issues may arise with using whole milk because fat may interfere with some separation procedures (O’Mahony and Fox, 2014). Dairy ingredients are based on either simply drying the initial fluid (milk or a whey stream) or are the result of removing some components and thereby concentrating others. Several methodologies of casein and whey separation have been developed, creating different categories and terminology for ingredients enriched in either casein or whey proteins. The methods for creating each dairy ingredient are discussed under the subheadings below for the three primary dairy ingredients used in this investigation: micellar casein, milk protein concentrate, and whey/serum proteins.
2.3. Casein-based ingredients, including milk protein concentrates
As mentioned in section 2.1, individual casein proteins are classified as1-, as2-, ß-, and
k-caseins. They are individually on the size order of about 20 kDa but appear in milk as micelles. Casein micelles are colloidal particles containing both protein and minerals with an average diameter of 120 nm, but the size ranges from 50-500 nm (Fox and Brodkorb, 2008). The native structure and function of casein micelles has been extensively discussed (de Kruif, C. G. and Holt, C., 2003; Fox and Brodkorb, 2008; Dalgleish and Corredig, 2012; De Kruif and Huppertz, 2012; Holt et al., 2013; Huppertz et al., 2017).
While the specific structural arrangement of the micelle is still not agreed upon, it is accepted that that the k-casein appears on the outer part of the micelle and stabilizes the micelles
electrostatically and sterically. Destabilization of the k-casein from the micelle by charge
neutralization combined with the subsequent release of calcium ions present in the micelle is the basis for creating both acid and rennet casein (Huppertz et al., 2017). Additional factors that may destabilize the micelle include addition of alcohol, anionic detergents, and high pressure, but the micelle has been shown to be heat stable (Fox and Brodkorb, 2008).
The recovery of caseins has traditionally been based on the above described disruption of k-casein via precipitation-based isolation in rennet-based casein, acid-based casein, and creation
of sodium caseinate and calcium caseinate. The oldest method of separation, rennet casein, is created by the addition of a mixture of proteolytic enzymes known as rennet, traditionally used in cheese-making. These enzymes cause the release of glycomacropeptides (GMP) by cleavage of a peptide bond in the k-casein. Glycomacropeptides are highly negatively charged and their
Isoelectric precipitation, also known as acid coagulation, is typically done with direct addition of hydrochloric acid, sulfuric acid or the addition of a Lactococcus culture which
converts lactose to lactic acid. In all cases, the pH is dropped to the isoelectric point of the casein (pH 4.6) at temperatures around 30°C.
Historically, for both acid and rennet casein, a cooking step takes place following precipitation. This is followed by de-wheying and washing. Finally, the curds are dewatered, dried, tempered, and ground to the desired particle size. Dried caseins are packaged according to particle size, typically 30, 60, 80, or 90 mesh, with 90 being the finest grain. Carr and Golding (2016) provide a complete review of these processes.
Calcium-caseinates and sodium caseinates are manufactured typically from acid casein. Before drying, calcium hydroxide or sodium hydroxide are added to raise the pH, followed by drying. These have uses in products such as dried creamers and meat emulsions and have excellent water-binding capacity and heat stability (Patel, 2016).
The above casein-extraction methods disrupt the native casein micelle structure and require additional processing to render them soluble. As bovine casein micelles in their native state are electrostatically and sterically stabilized, they are better suited for beverage
applications. Therefore, milk protein ingredients intended for beverage applications should be processed in a way that keeps the native micelle structure as intact as possible. The methods below give an overview of processing that does not disrupt the micelle.
size. The smaller particles such as salts, lactose, and water flow through (permeate), while those too large to pass through the pore are retained (retentate). For casein-only retentate, a membrane size of about 0.1 µm is used. But a variety of membrane pore sizes are available, therefore manufacturers may choose to retain or remove whey proteins, allowing for the production of milk protein concentrate, containing both whey and casein, or micellar casein products (Carr and Golding, 2016).
Milk protein concentrates (MPC) are generally obtained via ultrafiltration by the methods outlined above using a membrane with a pore size in the range of 0.05 μm to 0.1 µm which retains both the whey and casein proteins while allowing soluble salts and lactose to be removed. The retentate of this process contains proteins in approximately the same ratio found in bovine milk. The retentate is then spray dried (Meena et al., 2017). For specific detail on membrane processing as it relates to the dairy industry, Tamime (2013) gives a thorough overview.
Milk protein concentrate functionality has been well-reviewed and studied alongside casein-based ingredients (Martin et al., 2010; Huppertz and Gazi, 2015; Carr and Golding, 2016; Meena et al., 2017; Carter et al., 2018). In Table 1.1, the ingredients are listed as MPC followed by a number that indicates the percentage of protein in the ingredient on a dry mass basis. It can be seen that the lactose content decreases with increasing protein content and that moisture, fat, and ash stay relatively the same.
2.4. Whey/serum proteins
remained in the liquid portion of the acid or rennet milk, along with soluble salts and lactose. There are two types of whey obtained from these processes, acid whey and sweet (rennet) whey, both have a standard of identity in the United States Code of Federal Regulations
(21CFR184.1979).
Sweet whey is more commonly produced between the two types of whey (Kilara, 2009); however, the amount of acid whey produced has increased due to the popularity of Greek-style yogurt. In this process, 75% of the milk volume used in making Greek yogurt is removed as whey (Boynton and Novakovic, 2013). The composition of sweet and acid whey depends on the processes occurring before whey separation. For example, in yogurt processing heating will cause whey proteins to aggregate with casein micelles and the resulting whey stream will be lower in protein (Nishanthi et al., 2017). If whey proteins are not heat processed prior to
precipitation of casein, both acid and sweet whey are similar with the exceptions that sweet whey contains the negatively charged glycomacropeptides (GMP) from k-casein (Huppertz et al.,
2017) and is at a pH of 5.9 - 6.0 while acid whey is pH 4.6 - 4.7 (Królczyk et al., 2016). All whey-based ingredients follow a combination of general processing steps: 1)
clarification, 2) separation of fat, 3) concentration of solids, and 4) fractionation of solids for the purposes of protein recovery, recovering or removal of lactose, and demineralization (Bansal and Bhandari 2016). The following is an overview of the commonly found whey-based ingredients.
less lactose by design, but it is still a high amount for a high heat application such as thermally processed beverages. Demineralized whey has lower mineral content than dried whey, but still a high lactose concentration. As these ingredients were not used in this research, the reader is referred to Bansal and Bhandari (2016) for a detailed overview for the production of these whey powders as well as considerations for each.
2.4.1. Whey protein concentrates
2.4.2. Whey protein isolates
Whey protein isolates (WPI) are at a higher protein content and contain lower levels of lactose and minerals over WPCs. They are produced by membrane processing and ion exchange methods (Bansal and Bhandari, 2016). The basic principle of ion exchange chromatography is that pH-adjusted whey is passed through a column such that the proteins adsorb to the counter-ionic charge on the column while the lactose and minerals and pass through. Whey proteins are then eluted from the column by either changing pH or addition of counter ions. Stanic et al., (2012) provides an overview of this technology as well as the advantages and disadvantages of the ion-exchange methods.
A more recent approach is to remove whey proteins directly from milk, leaving a concentrated casein fraction (Nelson and Barbano, 2005; Marcelo and Rizvi, 2008). Whey protein ingredients isolated by this approach have been called native whey proteins, virgin whey proteins, and serum proteins, but recently the term milk whey proteins have been suggested. In this thesis, these will be referred to as serum protein isolates (SPI). The purpose of this
burgeoning method is to prevent whey protein exposure to the potentially destructive cheesemaking process and start with the unmodified proteins (Foegeding et al., 2011). The processing is done via ultrafiltration and extensive diafiltration. More detail on membrane processing can be found in Hurt and Barbano, (2010).
As mentioned previously, whey/serum proteins include b-lactoglobulin, a-lactalbumin,
they have been well-reviewed (Madureira et al., 2010; Stanic et al., 2012; Arrutia et al., 2016; Mohanty et al., 2016).
3. PROTEIN BEVERAGE THERMAL PROCESSING
To create a desirable drink for consumers, manufacturers use a variety of processes that inactivate pathogenic organisms and reduce microbial load to increase shelf life. Beverage manufacturers use thermal processes with a combination of temperature and time to create a safe product, and hopefully, one that has maximum physical stability (Barraquio, 2014). Different thermal processing techniques, such as pasteurization, ultra-high temperature (UHT), retort, and ultrapasteurization, will result in different beverage properties. An overview of commonly used processes is presented below.
3.1. Pasteurization and ultra-pasteurization
Pasteurization is a mild heating process that is designed to inactivate pathogenic bacteria and reduce the microbial load of spoilage microorganisms to extend shelf life, here defined as the length of time a product can be stored and maintain acceptable quality (Cornell University, 2007). The USDA defines pasteurization as, “any process, treatment, or combination thereof, that is applied to a food to reduce the most resistant microorganism(s) of public health
significance to a level that is not likely to present a public health risk under normal conditions of distribution and storage” (Sugarman, 2004). Thus, the purpose of this heating method is to eliminate pathogenic organisms to protect consumers.
The first batch pasteurization procedures were instituted by Louis Pasteur and Franz von Soxhlet in the late 1800s. This method is now referred to as low temperature long time
the 1920s, continuous flow pasteurizers, also known as high-temperature short-time (HTST) pasteurizers, were developed (Lewis, 2003). They typically operate with the use of a positive displacement or centrifugal pump that moves product through holding tubes for 15 s at 72°C (Fellows, 2009). Different time-temperature combinations may be used because a logarithmic relationship exists between increased temperature and destruction of bacteria (Fellows, 2009). If pasteurized dairy beverages are properly cooled and stored under refrigeration, they may have a shelf life of 10-28 days (Partridge, 2016).
Pasteurization processes ≤100°C have minimal effect on flavor, color, and protein denaturation; however, the short shelf life of 10-28 days is the primary drawback (Livney et al., 2003). As dairy proteins relate to this thermal process, the casein micelle is largely unaffected by heating at the pasteurization temperatures of 70-100°C. The whey fraction, however, is sensitive to heating, particularly proteins b-lactoglobulin and a-lactalbumin, which are denatured and
cause small levels of aggregation with other whey proteins or bind to casein micelles (Vasbinder and De Kruif, 2003).
Heating a beverage a minimum of 138°C for 2 seconds is classified as
3.2. Commercial sterilization and retort processing
Commercial sterilization is required if a long shelf life at ambient (~25°C) temperatures is desired. It is defined by the United States Food and Drug Administration as, “the condition achieved by application of heat, chemical sterilant(s), or other appropriate treatment that renders the equipment and containers free of viable microorganisms having public health significance, as well as microorganisms of non-health significance, capable of reproducing in the food under normal nonrefrigerated conditions of storage and distribution." (Food and Drug Administration, 2018). Heat sterilization may be accomplished by in-container heating to inactivate microbes and enzymes or by thermal sterilization of the product followed by filling under aseptic conditions.
3.2.1. Retort processing
As retorting relates to dairy proteins, at temperatures > 120°C, protein destabilization has been observed because whey proteins bind to k-casein and larger casein micelles may precipitate
because they are no longer stabilized by the k-caseins (O’Connell and Fox, 2001). Retort
processing of dairy ingredients containing lactose also results in a distinctive cooked flavor and a darker coloring as a result of browning reactions (Deeth and Lewis, 2017).
3.2.2. Ultra-high temperature processing
Ultra-high temperature (UHT) processing is the concept of commercially sterilizing the food product using direct or indirect heating, holding to achieve desired lethality, cooling rapidly, and then filling into an aseptic package in a sterile environment (Awuah et al., 2007). This involves continuous heating at temperatures above 135°C for at least 1s followed by filling into an aseptic container. The advantage of this process is that the product is not exposed to high temperatures for as long as it is with retort processing. The temperature can be adjusted so long as the product is able to be shown to be commercially sterile and the process is filed with the FDA by a Process Authority (Lund and Singh 1993). Regulations for UHT processing may be found in Title 21 CFR sections 108 and 113.
Aseptically processed products are stored at ambient temperatures and have an expected shelf life of six months or greater; however, chemical and physical changes do occur over shelf life. Viscosity change in milk has been attributed to modification of k-casein, causing potential
a-tend to gel more rapidly than indirect-heat processed milks (Anema, 2017). In the following section, thermal and colloidal stability will be discussed in greater detail.
4. PHYSICAL STABILITY OF PROTEIN BEVERAGES
There are two forms of physical stability relating to protein beverages. The most commonly investigated is thermal or heat stability, which is defined as the ability of a protein solution, or beverage, to withstand thermal processing and remain a homogeneous fluid
(colloidal state of a sol). The second form of physical stability is shelf life, which can be defined as the time period after thermal processing where the physical properties and appearance remain acceptable.
The colloidal state of matter is defined as consisting of, “a single dispersed phase of particles in a second continuous phase called the dispersion medium (Dickinson, 1992).” This is the simplest form, foods often have more complexity in the dispersed and continuous phases. For example, bovine milk contains two dispersed phases (casein micelles and milk fat globules) and a continuous phase solution with protein (whey proteins), mineral, and sugar solutes. One common feature of colloidal systems is that they are not inherently stable, and the dispersed phase is separating at a rate that is regulated by several factors. Food colloidal systems are
precipitate or gel immediately after thermal processing (Foegeding, 2015). Therefore, physical stability depends on the formation of soluble aggregates that remain stable and suspended in solution over the shelf life of the product.
4.1. Thermal stability
Depending on the specific discipline, “protein stability” can mean many different things. In the context of a thermally processed beverage, the emphasis is on colloidal stability instead of maintaining protein structure as it would be for biopharmaceuticals. For the purposes of this study, thermally stable proteins (ingredients) are defined as those that remain dispersed in the beverage through thermal processing.
4.2. Colloidal shelf stability
The second form of physical stability is shelf life, which can be defined as the time period after thermal processing where the physical properties and appearance remain acceptable. The ability of a particle to remain suspended in solution is due to properties of the solvent and dispersed particles, as modeled by Stokes’ law (Equation 1.4). There are three proposed mechanisms for physical destabilization in beverages that do not undergo polymer-polymer segregated phase separation: 1) phase separation based on Stokes’ law, 2) phase separation based on secondary aggregation and Stokes’ law, and 3) gel formation.
𝑣
"=
$%&'()*+,-./&01-2.3*4 6 789: (1.4)
Where:
vs is the velocity of sedimentation, m s-1
ρ particle = density of soluble complex, kg m-3
ρ solvent = density of continuous phase, kg m-3
g = gravity, m s-2
r = hydrodynamic radius, m
η = continuous phase Newtonian viscosity, Pa s
Stokes’ law can be used to evaluate the effects of particle size, density differences between phases, and continuous phase viscosity in relationship to shelf life being terminated by formation of a visible precipitated phase in the bottom of a beverage. However, Stokes’ law only precisely predicts settling velocity of hard spheres at phase volumes (f) less than approximately
Protein aggregation can also produce a continuous gel network. Often the beverage appearance remains homogenous but becomes a solid gel. This is related to secondary aggregation at a protein concentration above the critical gel concentration and the rate of secondary aggregation occurring rapidly enough that a gel is formed before settling as a precipitate.
4.3. Aggregation
Two or more colloidal particles sticking together is defined as aggregation (Dickinson 1992). Aggregation can occur at several steps of protein beverage processing. It is a universal term that encompasses all proteins that have formed inter-molecular covalent bonds or
noncovalent interactions and create a protein particle (Mahler et al., 2009). It is a complex process, as there is no one pathway for aggregation that applies to all proteins (Roberts, 2007).
Aggregates may be soluble and remain dispersed over an appropriate time scale, or insoluble, leading to precipitation (Mahler et al., 2009). The methods of non-covalent
4.4. Precipitation or sedimentation
Sedimentation is explained by Stokes’ equation as particles fall out of the dispersed state and settle to the bottom of the container at a given velocity. Sedimentation has been commonly reported in dairy proteins and increases with time and temperature of heating (Ramsey and Swartzel, 1984). Regular disturbance of beverages will decrease sedimentation, as it resuspends the particles (Deeth and Lewis, 2016). The mechanisms for sedimentation in milk are not well-understood or characterized (Nieuwenhuijse and van Boekel, 2003).
4.5. Gelation and age-gelation
As mentioned previously, gelation occurs when protein concentration is above the critical gelation concentration and aggregation produces a continuous three-dimensional network
(Panouille et al., 2005).
Another form of gelation seen over storage is age-gelation which is characterized by an irreversible gel that causes the beverage to lose fluidity and become a solid. The gel is present throughout the container and not as a layer on the bottom of the container (Anema, 2017). The mechanism of age-gelation is not completely understood (Nieuwenhuijse and van Boekel, 2003; Chavan et al., 2011). Age-gelation may be a product of several different mechanisms; one study found it was caused by protein proteolysis by enzymes not inactivated by UHT processing (plasmin and bacterial proteinases) but when the product was stored at temperatures above 30°C, gelation did not happen as quickly (Deeth and Lewis, 2016). Another mechanism proposed by
Anema, (2017) is non-enzymatic but the age-gelation is caused by dissociation of k-casein from
casein micelles, thek-casein-depleted micelles in turn cross-link, leading to age-gelation. The
4.6. Factors contributing to stability 4.6.1. Protein Type and Concentration
It has been demonstrated that casein-based ingredients are more heat stable than whey protein-based ingredients. Milk is heat instable, the instability is due to the whey proteins denaturing and interacting with κ-casein, thus destabilizing the electrostatic stability of micelles (Singh et al., 2004). Specifically, b-lactoglobulin will bind to the κ-casein on the exterior of
casein micelles (Gaspard et al., 2017).
One functional advantage of micellar casein concentrate (MCC) is the reduced amount of whey proteins. Sauer and Moraru (2012) studied heat stability of MCC at a pH range 6.5-7.3 and heating temperatures of 110°C-150°C. High temperatures caused change in mineral equilibrium and release of both k-casein and as-casein, which are proposed to contribute to aggregation.
Treatments at pH less than 6.7 consistently produced aggregation while treatments greater than pH 6.9 did not show aggregation across the temperature range. It was suggested that when high temperatures for processing are required, the pH of solution should greater than 6.9.
The aggregation of whey proteins, representing whey protein ingredients, has been well-studied, and many mechanisms of aggregation and gelation are well-understood (Roefs and Peppelman, 2000; Fitzsimons et al., 2007; Dissanayake and Vasiljevic, 2009; LaClair and Etzel, 2009; Wijayanti et al., 2014). Whey proteins aggregate due to non-covalent and disulfide
bonding. b-Lactoglobulin is more prone to form aggregates than a-lactalbumin and
disulfide-linked b-lactoglobulin oligomers are formed at neutral pH (Singh and Creamer, 2001). When
4.6.2. Effect of pH
Beverage pH is important to protein stability because it changes the protein’s net charge. Low and high pH values are typically preferential because they provide electrostatic stabilization but the pH should not go to extremes that can cause denaturation (Pelegrine and Gasparetto, 2005). The isoelectric point (pI) is considered the point of least solubility for proteins because at this pH the electrostatic forces stabilizing the proteins are at a net neutral charge, creating a more favorable environment for aggregation. Each type of protein has its own unique pI based on the amino acid side chains (Kilara, 2009; Huppertz et al., 2017). When caseins and whey proteins are together in solution, the pH has a significant impact on how the proteins behave. At pH < 6.8, whey proteins are more associated with casein micelles, at pH > 6.8, whey proteins aggregate but remain dispersed (Singh et al., 2004).
5. CHARACTERIZING THERMAL AND SHELF STABILITY FOR PROTEINS IN
BEVERAGES
As mentioned previously, thermal stability is the ability to survive thermal processing and remain a colloidal sol (solid dispersed in a liquid) and colloidal shelf stability is how long a beverage remains homogeneous in appearance and does not form an undesirable level of viscosity or be converted to a solid (gel). Babick (2016) outlines methods for observing the behavior of the dispersed particles and their theory in detail.
methodologies applied. The general topic of thermal processing of whey and caseins has been addressed in several reviews (Schokker et al., 2000; Fitzsimons et al., 2007; Roberts, 2007; Mahler et al., 2009; Dalgleish and Corredig, 2012; Dissanayake et al., 2013).
Shelf stability has not been a large focus in the published literature. While studies on age gelation in milk are more prevalent (reviews found in (Datta and Deeth, 2001; Lakemond and van Vliet, 2008)), only a few studies exist on shelf stability of formulated milk protein
beverages, which can be seen in Table 1.3 (Temelli et al., 2004; LaClair and Etzel, 2009; Villumsen et al., 2015; Le et al., 2016; Anema, 2017; Gaur et al., 2017). Since the goal of this investigation was to evaluate ways to measure thermal and shelf stability, the literature is organized based on methods used to follow stability.
5.1. Changes in solubility
investigations. Other factors being equal, solubility is proportional to particle size with greater force and time removing smaller particles.
Gaur et al., (2017) studied gravimetric sedimentation behavior after 8 weeks in UHT (144°C for 4s) milk at varying pH and ionic calcium levels and found that both decreased pH and increased calcium ions caused sediment to form more quickly. The sediment was measured by decanting the liquid milk and weighing the sediment, which consisted predominately of casein micelles without k-casein. This highlighted the importance of steric stabilization of casein
micelles.
Anema et al., (2017) studied age-gelation in UHT processed reconstituted milk powders and measured solubility of particles by centrifugation at 63,000 x g at 20°C, with no time given. It was seen that a- and b-caseins were less soluble than the whey proteins and k-casein (Anema
2017).
5.2. Turbidity
Turbidity-based methods are based on larger particles causing an increase in turbidity (increased light scattering and decreased transmitted light). However, other factors contribute to turbidity, including particle size, shape, concentration, and refractive index of the particles and continuous medium (Mahler et al., 2009). An excellent overview of turbidity may be found in Kitchener et al., (2017). Figure 1.1 from Wagoner et al. (2015) illustrates the effect of pH on turbidity in WPI solution at the same concentration, as pH increased, the 1% (wt/wt) solution became more turbid.
Temelli et al., (2004) claimed to have created a stable pasteurized and refrigerated beverage containing whey proteins and b-glucans from barley; however, a marked decrease in
shown that the sediment could be re-dispersed with shaking, this beverage would not be
considered stable by definitions in this literature review. Viscosity and pH were also monitored across the six weeks, but no significant differences were seen (Temelli et al., 2004). This study showed phase separation occurs with increasing protein concentration, but particles could be redispersed with agitation, indicative of Stokes’ settling behavior of these particles.
Laclair and Etzel (2009) studied the aggregation of whey proteins in acidic beverages at 1.25% (wt/wt) protein over the course of six weeks. Turbidity and particle size were measured. They found all acidic whey protein beverages increased in turbidity over time, but those with aggregates from heating filtered out prior to bottling had a lower initial turbidity (Laclair and Etzel, 2009). They did not measure the protein content of the filtered beverages compared to the non-filtered, which would have added insight into turbidity meaurements.
Villumsen et al., (2015) investigated processing and storage conditions (up to six months at 4°C and 20°C) on formation of aggregates in acidic whey protein beverages (7.0% (wt/wt) protein). Aggregate formation was measured based on changes in turbidity and rheological properties, while the protein forming the aggregates were determined by 2D-gel electrophoresis and mass spectrometry. Only one sample showed an increase in viscosity and turbidity over storage. Aggregates from that sample contained an unidentified protein, proposed to be
glycomacropeptide or another protein that had been enzymatically hydrolyzed. Le et al., (2016) expanded on the Vllusen et al., (2015) study and confirmed the presence of glycomacropeptides as the “unidentified protein” in soluble aggregates.
5.3. Particle size
protein beverages is that particles can span a range from a few nanometers to visible aggregates (Amin et al., 2014). There is not one analytical technique that covers such a range and each technique has limitations.
Laclair and Etzel, (2009) used UV-spectrophotometry and size-exclusion high performance liquid chromatography to measure changes in acidic whey protein beverages at 1.25% (wt/wt) protein over six weeks. They found a slow aggregation process controlled the rate of sediment formation and aggregation could be explained and predicted based on aggregates seen immediately post-processing. Prior to heating, half of the beverages were centrifuged (3000 x g for 30 mins at 4°C), all samples were hot-filled (88°C for 2 mins), and half were filtered with a 0.1 µm filter before bottling to remove aggregates from thermal processing. Initially after heating, all treatments showed the same percentages of soluble protein but over time, SEC-HPLC showed soluble protein peaks decreased and aggregates in the void volume increased over time and that increased storage temperature increased amount of aggregates. The suggestion from this finding was that primary aggregates larger than 0.1 µm act as nucleation sites for further aggregation and that a first- and second-order kinetic equation could potentially be applied to predict the effects of concentration, storage life, and temperature of storage on turbidity and aggregation. However, these experiments were run on solutions at 1.25% (wt/wt) protein, much lower than what is considered a, “good source of protein” by Code of Federal Regulations (21CFR2008) and there was no measurement of the amount of protein lost by the filtration step (Laclair and Etzel, 2009).
destabilization occured that caused gelation (Anema et al., 2017). Gelled material was composed of a- and b-caseins (Anema et al., 2017).
5.4. State diagrams
Wagoner et al. (2015) demonstrated the creation and utilization of state diagrams to represent the thermal stability of whey protein solutions across pH and protein concentration using turbidity, solubility, and macroscopic phase (sol, precipitate, gel) (Figure 1.2). These diagrams are useful for identifying pH and protein concentrations corresponding to regions of colloidal stability. This approach is applicable to individual protein ingredients as well as complex protein beverages (Wagoner et al. 2015). While Wagoner et al. (2015) established regions of heat stability, the colloidal shelf stability was not investigated.
6. MOTIVATIONS AND APPROACH
The literature suggests that a comprehensive approach to particle characterization could provide greater insight into destabilization based on Stokes' considerations. All shelf stability studies found in the literature on beverages have been on milk (~3.3% protein) or acidic whey beverages (pH<4.6). However, the behavior of high protein beverages (defined as > 42 g protein L-1 by United States Food and Drug Administration) at neutral pH involving both caseins and
whey at different concentrations has received minimal investigations.
6.1. Beverage formulation
carrageenan, cellulose gel, sucralose, dipotassium phosphate, vanilla flavoring, a-monohydrate
lactose, and cream) using the following treatments: 100% MCC, 100% MPC, 18% SPI and 82% MCC, 50% MCC 50% SPI, and 50% MPC 50% SPI at 10.5% and 6.3% (wt/wt) protein. Heat stability was determined immediately after UHT processing and colloidal shelf stability was followed over 8 weeks of storage at 4°C.
The second study was on aqueous dispersions of hydrated milk protein concentrate (MPC85) and whey protein isolate (WPI) ingredients. Treatments were: 100% MPC85 and 50% MPC85 50% WPI at concentrations of 11% (wt/wt) and 6% (wt/wt) protein. Heat stability was determined immediately after retort processing and colloidal shelf stability was followed over 8 weeks of storage at 25°C.
The formulations were at a pH of 6.8 and at protein concentrations allowing for a claim of “high protein” as defined by the United States Food and Drug Administration as > 4.2% (wt/wt) protein.
6.2. Heating methods
As outlined in section 3, heating methods vary in their effect on protein denaturation and particle size change. For this study, two different heating methods were used. Study one used ultra-high temperature processing (141°C for 2.5 s) and retort processing (121°C for 20 minutes) was used in Study 2. This allowed for a comparison of two commercially relevant heating conditions.
6.3. Particle size by laser diffraction
has complications in 1) assuring a proper refractive index is used, 2) it is limited in the range of particle size (0.1 µm to 100 µm), and 3) dilution/mixing may disrupt particles. Measurements were taken at time zero and across sampling timepoints to track changes.
6.4. Particle fractionation/mass balance
Particle size measurement doesn’t allow for protein quantification (i.e., how much of the total protein is found in each particle size class), which is the justification for developing a fractionation method. Methods for particle fractionation are described in Babick (2016); however, they have not been used in reference to protein solubility. Figure 1.3 shows the
principle of fraction based on a combination of centrifugation and filtration. This method showed the amount of protein within different levels of solubility defined by fractionation at each stage removing “insoluble” fractions. This results in three soluble fractions that can be tracked over time. It has the advantage that all protein is accounted for in soluble or insoluble fractions.
6.5. Size-exclusion high performance liquid chromatography
The last soluble fraction in the method described in section 6.4 can contain individual protein molecules as well as small aggregates. Therefore, size exclusion chromatography was used to characterize the “soluble” fraction, by using a high molecular weight ladder to compare size class of particles in the most soluble fraction, detected by UV absorbance at 280 nm.
6.6. Turbiscan z-plane turbidity measurement
determine differences in settling. There does not appear to be any published data on the use of Turbiscan for the purposes of protein beverages, it is commonly used for studying emulsion stability. This instrument scans the total length of a glass cylindrical cell with a detection head that pulses light at a wavelength of 850 nm. Two detectors are at 0° and 135° from the incident beam of light, the 0° measures transmission of light and the 135° detector measures
backscattering of light. For complete review of the operating principles of the Turbiscan, the reader is referred to Mengual et al. (1999). Turbiscan has the advantage of following aggregation under quiescent conditions without the requirement for dilution.
6.7. Experimental objective
7. FIGURES
Figure 1.3. Illustration of principle for mass balance of proteins
Starting
Suspension Centrifuged Suspension
5µm Filtered Suspension
0.45µm Filtered Suspension
8. TABLES
Table 1.1. Typical compositions of milk protein concentrate (g/100g)1
Ingredient Moisture % Fat % Protein % Lactose % Ash %
MPC 42 3.5 1.0 42.0 46.0 7.5
MPC 70 4.2 1.4 70.0 16.2 8.2
MPC 75 5.0 1.5 75.0 10.9 7.6
MPC 80 3.9 1.8 80.0 4.1 7.4
MPC 85 4.9 1.6 85.0 1.0 7.1
MCC 5 1 83 1 7.8
1Sourced from Dairy Management Inc., 2003 and U.S. Dairy Export Council, 2015
MPC, Milk Protein Concentrate; MCC, Micellar Casein Table 1.2. Composition of different whey powders (g/100g)1
Product Moisture Fat Protein Lactose Minerals
Sweet Whey Powder 3-6 0.8-1.5 12-13 70-74 7.2-8.5
Acid Whey Powder ≤ 3.5 0.8 9-12 65-69 11-12
Reduced Minerals Whey Powder ≤ 3 ≤ 1.5 ≥11 75-84 ≤4
Delactosed Whey Powder 2-3 1-4 18-25 40-60 11-27
WPC35 4.6 2.1 29.7 46.5 7.8
WPC50 4.3 3.7 40.9 30.9 6.4
WPC65 4.2 5.6 59.4 21.1 3.9
WPC80 4.0 7.2 75.0 3.5 3.1
WPI 4.5 1 92 0.5 2
1Sourced from de Wit, 2001; Foegeding et al., 2011; and Bansal and Bhandari, 2016
Table 1.3. Summary of Shelf Life Studies
Study Methods Used Duration of
Study Goal Temelli et al., 2004 Viscosity, pH, color,
turbidity, 8 weeks Develop a formulation, examine shelf stability LaClair and Etzel,
2009 Turbidity, SEC-HPLC, Soluble protein UV-Spectrophotometry
6 weeks Understand relation between monomoer loss, agregation formation, and turbidity increase Villumsen et al., 2015 Oscillory Rheology,
Turbidity by absorbance at 500 nm, 2-D gel
electrophoresis, Mass Spectroscopy
6 months Assess heat treatment, storage conditions, mineral content impact on high protein
acidicWPI beverages Wagoner et al., 2015 Turbidity, Electrophoresis,
RP-HPLC, Observation of macroscopic state
Immediately
post-processing
To develop a state diagram approach to determine whey protein beverage functionality in beverages after thermal processing across a range of pH values. Le et al., 2016 1-D gel electrophoresis,
2-d gel electrophoresis, In gel-digestion, Mass spectroscopy
12 months Proteomics to identify and characterize
chemical changes in WPI acidic drinks
Anema et al., 2017 Visual inspection for gelling, gel
electrophoresis, solubility, particle size, zeta potential, pH and serum mineral levels
10 months Understand mechanism of age-gelation in UHT milk
Gaur et al., 2017 Visual, gravimetric, microfluidic chip analysis, pH and ionic calcium measurements
9. REFERENCES
Allen, G. 2016. Can It! The Perils and Pleasures of Preserving Foods. Reaktion Books, Ltd. Amin, S., G. V. Barnett, J.A. Pathak, C.J. Roberts, and P.S. Sarangapani. 2014. Protein
aggregation, particle formation, characterization & rheology. Curr. Opin. Colloid Interface Sci. 19:438–449. doi:10.1016/j.cocis.2014.10.002.
Anema, S.G. 2017. Storage stability and age gelation of reconstituted ultra-high temperature skim milk. Int. Dairy J. 75:56–67. doi:10.1016/j.idairyj.2017.06.006.
Arrutia, F., R. Rubio, and F.A. Riera. 2016. Production and membrane fractionation of bioactive peptides from a whey protein concentrate. J. Food Eng. 184:1–9.
doi:10.1016/j.jfoodeng.2016.03.010.
Awuah, G.B., H.S. Ramaswamy, and A. Economides. 2007. Thermal processing and quality: Principles and overview. Chem. Eng. Process. Process Intensif. 46:584–602.
doi:10.1016/j.cep.2006.08.004.
Babick, F. 2016. Suspensions of Colloidal Particles and Aggregates. J. Valverde Millán, ed. Springer New York.
Bansal, N., and B. Bhandari. 2016. Functional Milk Proteins: Production and Utilization - Whey- Based Ingredients.
Barraquio, V.L. 2014. Which Milk is Fresh?. Int. J. Dairy Process. Res. 1:1–6.
Beverage Industry. 2017. 2017 State of the Beverage Industry: Sports and Protein Drinks See Steady Growth. Accessed November 6, 2018. https://www.bevindustry.com/articles/90357- 2017-state-of-the-beverage-industry-sports-and-protein-drinks-see-steady-growth?
Van Boekel, M.A.J.S. 1998. Effect of heating on Maillard reactions in milk. Food Chem. 62:403–414. doi:10.1016/S0308-8146(98)00075-2.
Bown, G. 2003. Developments in conventional heat treatment. P. Zeuthen and L. Bogh-Sornsen, ed. Woodhead Publishing Ltd, Caimbridge.
Boynton, R.D., and A.M. Novakovic. 2013. Industry Evaluations of the Status and Prospects for the Burgeoning New York Greek-style Yogurt Industry. Progr. Dairy Mark. Policy Res. Pap. Ser.
Carr, A., and M. Golding. 2016. Functional Milk Proteins Production and Utilization: Casein- Based Ingredients.
Chavan, R., S. Chavan, C. Khedkar, and A. Jana. 2011. UHT milk processing and effect of plasmin activity on shelf life: a review. Compr. Rev. Food Sci. Food Saf. 251–268. Cheng, N., D.M. Barbano, and M.A. Drake. 2018. Hunter versus CIE color measurement systems for analysis of milk-based beverages. J. Dairy Sci. 101:4891–4905.
doi:10.3168/jds.2017-14197.
Cornell University, D. of F.S. 2007. Pasteurized versus Ultra-Pasteurized Milk -Why Such Long Sell-By Dates? 10.
Cromwell, M.E.M., E. Hilario, and F. Jacobson. 2006. Protein Aggregation and Bioprocessing. AAPS J. 8:1–8. doi:10.1208/aapsj080366.
Dairy Management Inc. 2003. Milk Protein Concentrate Ingredients.
Dalgleish, D.G., and M. Corredig. 2012. The Structure of the Casein Micelle of Milk and Its Changes During Processing. Annu. Rev. Food Sci. Technol. 3:449–467. doi:10.1146/annurev- food-022811-101214.
Datta, N., and H.C. Deeth. 2001. Age gelation of UHT milk - A review. Food Bioprod. Process. Trans. Inst. Chem. Eng. Part C 79:197–210. doi:10.1205/096030801753252261.
Deeth, H., and M. Lewis. 2016. Protein Stability in Sterilized Milk and Milk Products. P.L.H. Mc Sweeney and J.A. O Mahony, ed. Springer New York.
Deeth, H.C., and M.J. Lewis. 2017. Heat treatments of milk - ESL, UHT and in‐container sterilisation. High Temp. Process. milk milk Prod. 41–64.
Dickinson, E. 1992. An Introduction to Food Colloids. Oxford Science Publications, Oxford, UK.
Dickinson, E. 2015. Colloids in Food: Ingredients, Structure, and Stability. Annu. Rev. Food Sci. Technol. 6:211–233. doi:10.1146/annurev-food-022814-015651.
Dissanayake, M., L. Ramchandran, O.N. Donkor, and T. Vasiljevic. 2013. Denaturation of whey proteins as a function of heat, pH and protein concentration. Int. Dairy J. 31:93–99.
doi:10.1016/j.idairyj.2013.02.002.
Dissanayake, M., and T. Vasiljevic. 2009. Functional properties of whey proteins affected by heat treatment and hydrodynamic high-pressure shearing. J. Dairy Sci. 1387–1397.
doi:10.3168/jds.2008-1791.
Entertainment Close-Up. 2018. Technavio Adds Report on the Global RTD Protein Beverages Market. Close-Up Media, Inc. 1–2.
Fellows, P. 2009. Heat processing using steam or water. First. Elsevier Science and Technology. Fitzsimons, S.M., D.M. Mulvihill, and E.R. Morris. 2007. Denaturation and aggregation
processes in thermal gelation of whey proteins resolved by differential scanning calorimetry. Food Hydrocoll. 21:638–644. doi:10.1016/j.foodhyd.2006.07.007.
Foegeding, E., P. Luck, and B. Vardhanabhuti. 2011. Whey Protein Products.
Foegeding, E.A. 2015. Food Protein Functionality--A New Model. J. Food Sci. 80:C2670– C2677. doi:10.1111/1750-3841.13116.
Food and Drug Administration. 2015. Grade “A” Pasteurized Milk Ordinance. Grade “A” Pasteurized Milk Ord. 1–423. doi:10.1016/S1365-1609(00)00071-X.
Food and Drug Administration. 2018. 21CFR113.3. Accessed.
Fox, P.F., and A. Brodkorb. 2008. The casein micelle: Historical aspects, current concepts and significance. Int. Dairy J. 18:677–684. doi:10.1016/j.idairyj.2008.03.002.
Fox, P.F., T. Uniacke-Lowe, P. McSweeney, and J. O’Mahony. 2015. Dairy Chemistry and Biochemistry.
Gaspard, S.J., M.A.E. Auty, A.L. Kelly, J.A. O’Mahony, and A. Brodkorb. 2017. Isolation and characterisation of κ-casein/whey protein particles from heated milk protein concentrate and role of κ-casein in whey protein aggregation. Int. Dairy J. 73:98–108.
doi:10.1016/j.idairyj.2017.05.012.
Gaur, V., J. Schalk, and S.G. Anema. 2017. Sedimentation in UHT milk. Int. Dairy J. 78:92–102. doi:10.1016/j.idairyj.2017.11.003.
Gerdes, S. 2012. Consumers Have a Thirst for Protein Beverages. Dairy Foods 22.
Hahn, R., P.M. Schulz, C. Schaupp, and A. Jungbauer. 1998. Bovine whey fractionation based on cation-exchange chromatography. J. Chromatogr. A 795:277–287. doi:10.1016/S0021- 9673(97)01030-3.
Hammarsten, O. 1883. Zur Frage, ob das Casein ein einheitlicher Stoff sei. Zeitschrift für Phys. Chemie 7:227–273.
Ho, Q.T., K.M. Murphy, K.P. Drapala, T.F. O’Callaghan, M.A. Fenelon, J.A. O’Mahony, and N.A. McCarthy. 2018. Effect of pH and heat treatment on viscosity and heat coagulation properties of milk protein concentrate. Int. Dairy J. 85:219–224.
doi:10.1016/j.idairyj.2018.05.012.
Holt, C., J.A. Carver, H. Ecroyd, and D.C. Thorn. 2013. Invited review: Caseins and the casein micelle: Their biological functions, structures, and behavior in foods. J. Dairy Sci. 96:6127– 6146. doi:10.3168/jds.2013-6831.
Huppertz, T., P.F. Fox, and A.L. Kelly. 2017. The Caseins: Structure, Stability, and Functionality. Second Edi. Elsevier Ltd.
Huppertz, T., and I. Gazi. 2015. Milk Protein Concentrate Functionality Through Optimized Product-Process Interactions. New Food 18:12–17.
Hurt, E., and D.M. Barbano. 2010. Processing factors that influence casein and serum protein separation by microfiltration1. J. Dairy Sci. 93:4928–4941. doi:10.3168/jds.2010-3121. Ji, J., K. Cronin, J. Fitzpatrick, M. Fenelon, and S. Miao. 2015. Effects of fluid bed
agglomeration on the structure modification and reconstitution behaviour of milk protein isolate powders. J. Food Eng. 167:175–182. doi:10.1016/j.jfoodeng.2015.01.012.
Karshikoff, A. 2006. Non-Covalent Interactions in Proteins. Imperial College Press, London. Kessler, H.G., and H.J. Beyer. 1991. Thermal denaturation of whey proteins and its effect in dairy technology. Int. J. Biol. Macromol. 13:165–173. doi:10.1016/0141-8130(91)90043-T. Kilara, A. 2009. Whey and Whey Products. Dairy Process. Qual. Assur. 337–355.
doi:10.1002/9780813804033.ch15.
Kitchener, B.G.B., J. Wainwright, and A.J. Parsons. 2017. A review of the principles of turbidity measurement. Prog. Phys. Geogr. 41:620–642. doi:10.1177/0309133317726540.
Królczyk, J.B., T. Dawidziuk, E. Janiszewska-Turak, and B. Sołowiej. 2016. Use of Whey and Whey Preparations in the Food Industry - A Review. Polish J. Food Nutr. Sci. 66:157–165. doi:10.1515/pjfns-2015-0052.
de Kruif, C. G. and Holt, C. 2003. Casein micelle structure functions and interactions. Adv. Dairy Chem. - Proteins Part A, 3rd ed. 1:233–276. doi:10.1007/978-1-4419-8602-3. De Kruif, C.G.K., and T. Huppertz. 2012. Casein Micelles: Size distribution in milks from individual cows. J. Agric. Food Chem. 60:4649–4655. doi:10.1021/jf301397w.
LaClair, C.E., and M.R. Etzel. 2010. Ingredients and pH are key to clear beverages that contain whey protein. J. Food Sci. 75:21–27. doi:10.1111/j.1750-3841.2009.01400.x.
LaClair, C.E., and M.R. Etzel. 2009. Turbidity and protein aggregation in whey protein beverages. J. Food Sci. 74. doi:10.1111/j.1750-3841.2009.01260.x.
Lakemond, C.M.M., and T. van Vliet. 2008. Rheological properties of acid skim milk gels as affected by the spatial distribution of the structural elements and the interaction forces between them. Int. Dairy J. 18:585–593. doi:10.1016/j.idairyj.2007.11.002.
Le, T.T., S.D. Nielsen, N.S. Villumsen, G.H. Kristiansen, L.R. Nielsen, S.B. Nielsen, M. Hammershøj, and L.B. Larsen. 2016. Using proteomics to characterise storage-induced aggregates in acidic whey protein isolate drinks. Int. Dairy J. 60:39–46.
doi:10.1016/j.idairyj.2016.01.028.
Leeb, E., N. Haller, and U. Kulozik. 2018. Effect of pH on the reaction mechanism of thermal denaturation and aggregation of bovine β-lactoglobulin. Int. Dairy J. 78:103–111.
doi:10.1016/j.idairyj.2017.09.006.
Lewis, M. 2003. Improvements in the Pasteurization and Sterilization of Milk. First. G. Smit, ed. Woodheat Publishing Ltd, Boca Raton.
Litwin, N.S., B.H.R. Bradley, and G.D. Miller. 2015. Dairy Proteins in Nutrition and Food Science: Functional Ingredients in the Current Global Marketplace. J. Food Sci. 80:A1. doi:10.1111/1750-3841.12800.
Livney, Y.D., M. Corredig, and D.G. Dalgleish. 2003. Influence of thermal processing on the properties of dairy colloids. Curr. Opin. Colloid Interface Sci. 8:359–364. doi:10.1016/S1359- 0294(03)00092-X.
Lund, D., and R. Singh. 1993. The system and its elements. J. Chambers and P. Nelson, ed. The Food Processors Institute, Washington, DC.
Madureira, A.R., T. Tavares, A.M.P. Gomes, M.E. Pintado, and F.X. Malcata. 2010. Invited review: Physiological properties of bioactive peptides obtained from whey proteins. J. Dairy Sci. 93:437–455. doi:10.3168/jds.2009-2566.
Mahler, H.C., W. Friess, U. Grauschopf, and S. Kiese. 2009. Protein aggregation: Pathways, induction factors and analysis. J. Pharm. Sci. 98:2909–2934. doi:10.1002/jps.21566.
Marcelo, P., and S. Rizvi. 2008. Physicochemical properties of liquid virgin whey protein isolate. Int. Dairy J. 18:236–246. doi:10.1016/j.idairyj.2007.08.011.
Martin, G.J.O., R.P.W. Williams, and D.E. Dunstan. 2010. Effect of manufacture and
reconstitution of milk protein concentrate powder on the size and rennet gelation behaviour of casein micelles. Int. Dairy J. 20:128–131. doi:10.1016/j.idairyj.2009.08.007.
Meena, G.S., A.K. Singh, N.R. Panjagari, and S. Arora. 2017. Milk protein concentrates: opportunities and challenges. J. Food Sci. Technol. 54:3010–3024. doi:10.1007/s13197-017- 2796-0.
Mengual, O., G. Meunier, and I. Cayre. 1999. TURBISCAN MA 2000: multiple light scattering measurement for concentrated emulsion and suspension instability analysis. Talanta 50:445– 456. doi:10.1016/S0079-8169(08)62428-9.
Mohanty, D.P., S. Mohapatra, S. Misra, and P.S. Sahu. 2016. Milk derived bioactive peptides and their impact on human health – A review. Saudi J. Biol. Sci. 23:577–583.
doi:10.1016/j.sjbs.2015.06.005.
Nelson, B.K., and D.M. Barbano. 2005. A Microfiltration Process to Maximize Removal of Serum Proteins from Skim Milk Before Cheese Making. J. Dairy Sci. 88:1891–1900. doi:10.3168/jds.S0022-0302(05)72865-4.
Nieuwenhuijse, J., and M. van Boekel. 2003. Protein stability in sterilised milk and milk products. 3rd ed. P. Fox and P. McSweeney, ed. Kluwer Academic/Plenum, New York. Nishanthi, M., J. Chandrapala, and T. Vasiljevic. 2017. Compositional and structural properties of whey proteins of sweet, acid and salty whey concentrates and their respective spray dried powders. Int. Dairy J. 74:49–56. doi:10.1016/j.idairyj.2017.01.002.
O’Connell, J., and P.F. Fox. 2001. Effect of beta-lactoglobulin and precipitation of calcium phosphate on the thermal coagulation of milk. J. Dairy Res. 68:81–94.
O’Mahony, J.A., and P.F. Fox. 2014. Milk: An Overview. Second Edi. Elsevier Inc.
Oltman, A.E., K. Lopetcharat, E. Bastian, and M.A. Drake. 2015. Identifying Key Attributes for Protein Beverages. J. Food Sci. 80:S1383–S1390. doi:10.1111/1750-3841.12877.
Osborne, T.B., and A.J. Wakeman. 1918. Some New Constituents of Milk Third Paper. A new protein, soluble in alcohol. J. Biol. Chem. 33:243–251.
Panouille, M., T. Nicolai, L. Benyahia, and D. Durand. 2005. Aggregation and gelation of casein sub-micelles. E. Dickinson, M. Panouille, T. Nicolai, D. Durand, and L. Benyahia, ed.
Partridge, J. 2016. Fluid Milk Products. Dairy Process. Qual. Assur. 203–217. doi:10.1002/9780813804033.ch9.