ABSTRACT
PATTON, JAMES QUINTON. Development and Application of Whey Protein Particles for the Improvement of Low Fat Cheddar Cheese Texture. (Under the Direction of E. Allen Foegeding.)
Increasing concern over the deleterious health effects associated with saturated fatty acids has precipitated an increased demand for low fat products. However, the reduction of fat in Cheddar cheese results in a concentration of the continuous casein phase, leading to several textural defects including increased firmness, rubberiness, and the breakdown process during chewing as compared to the full fat counterpart. Thus, the purpose of this research was to develop a whey protein based particle capable of functioning as a mimetic to provide a full fat like texture in Cheddar cheese.
Our method for particle production incorporated a 'top down' approach in which heat-set whey protein gels were first made with desired rheological and sensory attributes before particulation using a mechanical shearing device. This process allowed for the design of particles with a wide range of applications and functionality. At present, the primary mechanisms responsible for the breakdown pathway of Cheddar cheese are not well understood. Thus, our strategy was to first implement gel types with a diverse set of
rheological and sensory attributes, and after evaluating their efficacy, further refine particle types for a more product specific design. Particles with stranded, particulate, or composite protein network structures were selected for incorporation into cheeses, with particle presence confirmed using confocal laser scanning microscopy.
protein particle with embedded fat globules (composite-1) decreased fracture stress values of the cheese, but had little impact on sensory texture. Notably, we were unable to definitively quantify the volume fraction of particles retained in any of the three experiments, and thus it is plausible that the high degree of variation between replications of the same treatment is related to inconsistent particle delivery. Drawing from these findings, cheeses in experiment 2 were made with, among others, a modified composite type particle that provided a means to estimate the volume of particles incorporated. The native fat composite treatment was moderately effective in reducing fracture stress and improving sensory texture. The
homogenized gel treatment in replication 1 and particulate gel treatment in replication 2 were both found to be highly efficacious in improving cheese texture, but these results were not consistent across replications. However, the amount of particles incorporated varied between replications. Experiment 3 tested the effects different filler volume fractions and suggested that a critical level may be necessary to emulate the breakdown pattern of fat in Cheddar cheese. While these results are not conclusive, our data suggests a strong potential for this methodology and the use of whey protein particles as a fat mimetic.
Development and Application of Whey Protein Particles for the Improvement of Low Fat Cheddar Cheese Texture
by
James Quinton Patton
A thesis submitted to the Graduate Faculty of North Carolina State University
in partial fulfillment of the requirements for the Degree of
Master of Science Food Science
Raleigh, North Carolina 2013
APPROVED BY:
_________________________ _________________________
Christopher Daubert, Ph.D. MarryAnne Drake, Ph.D.
_________________________ E. Allen Foegeding, Ph.D.
ii DEDICATION
iii BIOGRAPHY
iv TABLE OF CONTENTS
LIST OF TABLES ... vii
LIST OF FIGURES ... ix
CHAPTER 1: REVIEW OF LITERATURE ...1
1. Introduction ...2
2. Modern Cheese Production ...2
2.1. Cheddar Cheese Process ...3
2.2. Low Fat Cheddar...7
3. Methods for Assessing Cheese Texture ...8
3.1. Small Strain Tests ...8
3.2. Large Strain and Fracture Tests ...9
3.3. Sensory Tests ...10
3.4. Confocal Scanning Laser Microscopy ...11
4. Strategies for the Production of Low Fat Cheese ...13
4.1. Adjunct Cultures ...14
4.2. Fat Mimetics ...17
4.3. Make Procedure Modifications ...20
4.3.1. Acid and Moisture Regulation ...20
4.3.2. Cheese Milk Modifications ...21
4.3.3. Homogenization of Cheese Milk/Cream ...23
5. Conclusions ...25
6. References ...26
CHAPTER 2. DEVELOPMENT AND MANUFACTURE OF WHEY PROTEIN PARTICLES ...33
1. Abstract ...34
2. Introduction ...34
3. Materials and Methods ...38
3.1. Preparation of Whey Protein Particles ...38
3.1.1. Formation of Whey Protein Macrogels...39
3.1.2. Whey Protein Microgel Particulation ...40
3.2. Particle Size Analysis ...40
3.3. Rheological Analysis ...40
3.3.1. Small Strain Tests ...40
3.3.1.1. Determination of the Linear Viscoelastic Region ...40
v
3.3.2. Large Strain Rheological Tests ...41
3.3.3. Fracture Analysis ...42
3.3.4. Post Fracture Analysis ...43
3.4. Descriptive Sensory Texture Analysis ...44
3.5. Confocal Laser Scanning Microscope (CLSM) Observations...44
3.6. Statistical Analysis ...45
4. Results and Discussion ...45
4.1. Small Strain Rheological Tests ...45
4.2. Large Strain Rheological Tests ...45
4.3. Fracture Analysis ...46
4.4. Post Fracture Analysis ...47
4.5. Descriptive Sensory Texture Analysis ...47
4.6. Particle Size Analysis ...48
4.7. Confocal Laser Scanning Microscope (CLSM) Observations...49
5. Conclusions ...50
6. References ...51
CHAPTER 3. EVALUATION OF LOW FAT CHEDDAR CHEESE CONTAINING WHEY PROTEIN PARTICLE PARTICLES ...74
1. Abstract. ...75
2. Introduction ...75
3. Materials and Methods ...80
3.1. Particle Filled Cheese Production ...80
3.2. Proximate Analysis ...80
3.3. Small Strain Analysis ...81
3.3.1. Determination of the Linear Viscoelastic Region ...81
3.2.2. Controlled Temperature Frequency Sweeps ...81
3.4. Large Strain Rheological Tests ...81
3.5. Fracture Analysis ...81
3.6. Post Fracture Analysis ...81
3.7. Single Edge Notch Bend Test ...81
3.8. Descriptive Sensory Texture Analysis ...82
3.9. Confocal Laser Scanning Microscopy ...82
3.10. Particle Retention Calculations ...82
3.11. Statistical Analysis ...83
4. Results and Discussion ...83
4.1. Experiment 1 Cheeses ...84
vi
4.1.2. Confocal Microscopy ...85
4.1.3. Large Strain and Fracture Rheology ...86
4.1.4. Descriptive Sensory Analysis ...86
4.1.5. Conclusions ...86
4.2. Experiment 2 Cheeses ...87
4.2.1. Particle Retention Calculations ...88
4.2.2. Cheese Composition ...91
4.2.3. Confocal Laser Scanning Microscopy Observations ...91
4.2.4. Small Strain Analysis ...93
4.2.5. Fracture Analysis ...93
4.2.6. Single Edge Notch Bend ...94
4.2.7. Large Strain Rheology ...95
4.2.8. Descriptive Sensory Analysis ...96
4.2.9. Post Fracture Analysis ...97
4.2.10. Conclusions ...98
4.3. Experiment 3 Cheeses ...99
4.3.1. Large Strain and Fracture Analysis...99
4.3.2. Descriptive Sensory Analysis ...100
4.3.3. Post Fracture Analysis ...100
4.3.4. Confocal Laser Scanning Microscope Observations ...101
4.3.5. Conclusions ...101
5. Conclusions ...102
6. References ...104
vii LIST OF TABLES
Table 1-1. CHEDDAR CHEESE CATEGORY DEFINITIONS ...30
Table 1-2. SUMMARY OF SOME COMMERCIALLY AVAILABLE
FAT MIMETICS ...31 Table 2-1. COMPOSITION OF HEAT SET WHEY PROTEIN ISOLATE GELS ...55 Table 2-2. FRACTURE AND LARGE STRAIN RHEOLOGICAL VALUES OF WHEY PROTEIN GELS (tested as macro gels) ...56 Table 2-3. TEXTURE TERMS USED FOR DESCRIPTIVE SENSORY
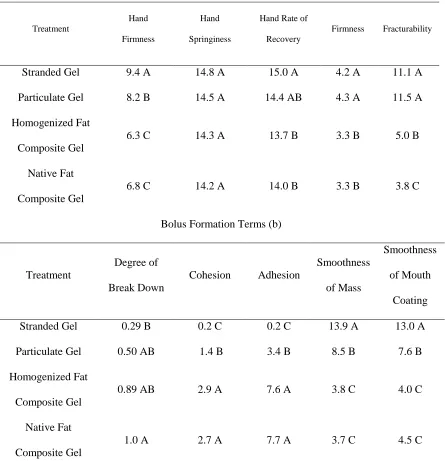
ANALYSIS ...57 Table 2-4. DESCRIPTIVE SENSORY TERMS RELATING TO FORCE-DEFORMATION (a) AND BOLUS FORMATION (b) OF WHEY PROTEIN MACROGELS ...58 Table 3-1. COMPOSITION OF HEAT SET WHEY PROTEIN ISOLATE GELS ...107 Table 3-2. PROXIMATE ANALYSIS OF EXPERIMENT 1 PARTICLE FILLED CHEESE ...108 Table 3-3. FRACTURE AND LARGE STRAIN RHEOLOGY OF EXPERIMENT 1
PARTICLE FILLED CHEESE EVALUATED AFTER 34 WEEKS AGEING ...109 Table 3-4. SENSORY TEXURE OF EXPERIMENT 1 PARTICLE FILLED CHEESE EVALUATED AFTER 34 WEEKS AGEING...110 Table 3-5. TABLE OF MAIN EFFECTS AND INTERACTIONS FOR RHEOLOGICAL TERMS IN EXPERIMENT 2 ...111 Table 3-6. PROXIMATE ANALYSIS OF EXPERIMENT 2 PARTICLE FILLED CHEESE ...112 Table 3-7. LARGE STRAIN AND FRACTURE RHEOLOGY OF EXPERIMENT 2
viii Table 3-10. ABBREVIATIONS FOR DESCRIPTIVE SENSORY TEXTURE TERMS ...116 Table 3-11. PROXIMATE ANALYSIS OF EXPERIMENT 3 PARTICLE FILLED
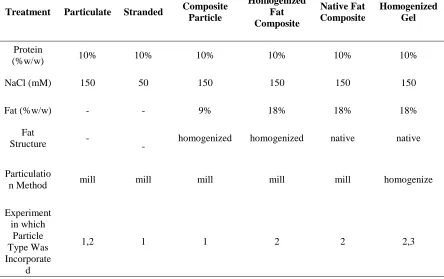
CHEESE ...117 Table 3-12. TREATMENT SUMMARY OF EXPERIMENT 3 PARTICLE FILLED
CHEESES ...118 Table 3-13. LARGE STRAIN AND FRACTURE RHEOLOGY OF EXPERIMENT 3
ix LIST OF FIGURES
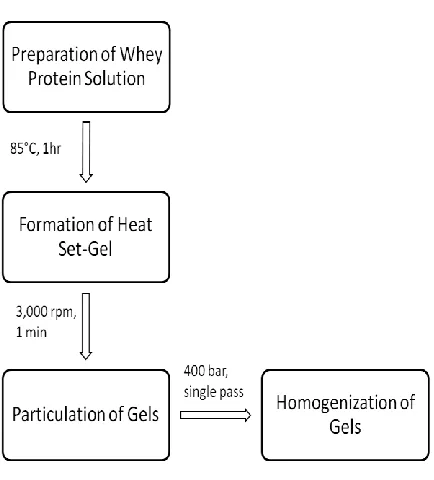
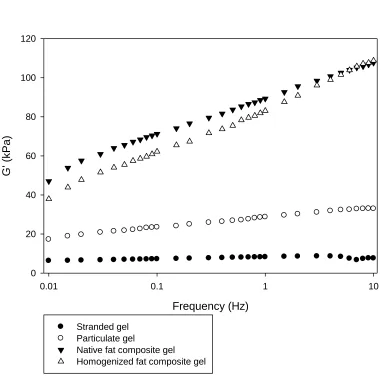
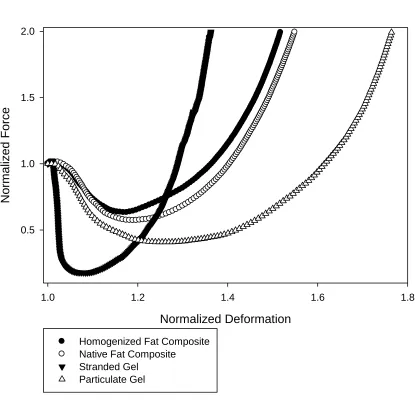
Figure 1-1. Production schematic of Cheddar cheese ...32 Figure 2-1. Production schematic for the manufacture of whey protein particles ...59 Figure 2-2. Frequency Sweep of whey protein gels at 25°C. Gels were tested at normalized stress values corresponding to a strain value of 3.6E-3 at 25°C , which was well within the LVR for all treatments ...60 Figure 2-3. Post Fracture Patterns of Gels ...61 Figure 2-4. Particle size analysis of stranded (a), particulate (b), native fat composite (c), homogenized fat composite (d), and homogenized gel (e). Data are the average of 5
replications ...62 Figure 2-5. Descriptive Sensory Texture of Whey Protein Macrogels. Force-Deformation (a) terms correspond to initial gel fracture properties, and Bolus Formation (b) terms relate to oral processing ...65 Figure 2-6. Confocal Microscopy of (a) stranded gel, (b) particulate gel, (c) native fat
composite, (d) homogenized fat composite, (e) homogenized gel, (f) native fat composite particles - cross sectional analysis, (g) native fat composite particles - cross sectional
analysis ...66 Figure 3-1. CSLM images of experiment 1 particulate gel-1 (a) particulate gel-2 (b),
stranded gel-1 (c), stranded gel-2 (d), composite gel-1 (e), composite gel-2 (f), low fat control (g), full fat control (h), and homogenized control (i) particle filled cheeses imaged after 34 weeks ageing. Scale bars are 20 µm ...121 Figure 3-2. CSLM of experiment 2 replication 1 native fat composite-L (a) experiment 2 replication 1 native fat composite-L, Z-stack (b), experiment 2 replication 2 native fat composite-L (c), and experiment 2 replication 2 native fat composite-L, Z-stack (d), particle filled cheeses imaged after 8 weeks ageing. Scale bars are 20 µm ...123 Figure 3-3. CSLM of experiment 2 replication 1 homogenized fat composite (a) experiment 2 replication 1 homogenized fat composite, Z-stack (b), and experiment 2 replication 2
x Figure 3-4. CSLM of experiment 2 replication 1 particulate gel (a) experiment 2 replication 1 particulate gel, Z-stack (b), experiment 2 replication 2 particulate gel (c), and experiment 2 replication 2, Z-stack particulate gel (d) particle filled cheeses imaged. Scale bars are 20 µm ...129 Figure 3-5. CSLM of experiment 2 replication 1 native fat composite (a) experiment 2 replication 1 native fat composite, Z-stack (b), experiment 2 replication 2 native fat
composite (c), and experiment 2 replication 2 native fat composite, Z-stack (d), particle filled cheeses. Scale bars are 20 µm ...130 Figure 3-6. CSLM of experiment 2 replication 1 full fat control (a) replication 1 full fat control, Z-stack (b), replication 1 full fat control (c), replication 1 full fat control, Z-stack (d), replication 1 low fat control (e), replication 1 low fat control, Z-stack (f), replication 1
homogenized fat control (g), and replication 1 homogenized fat control, Z-stack (h) particle filled cheeses. Scale bars are 20 µm ...131
Figure 3-7. Frequency Sweep of experiment 2 replication 1(a) and replication 2 (b) particle filled cheese at 24 weeks ageing. Cheeses were tested at normalized stress values
1 1. REVIEW OF LITERATURE.
2 1. INTRODUCTION
Cheese is one of the oldest known methods of food preservation, and though it is unclear who first made the discovery, records of consumption date back as early as 6000 BC (Fox, 1987). Popular lore attributes the 'invention' to a wondering sheppard, who, when attempting to store milk in a pouch made of lamb's stomach, found a rich curdled substance. This process was later refined and progressed along with human civilization both for its simplicity and substantive nutritional qualities. As an understanding of the chemical and biological mechanisms grew, so too did production and regional varietals (DRI, 2006). Cheese spread through the Roman Empire and into Medieval Europe; it visited the new world on the May Flower and has been produced industrially in the United States beginning in 1861 (Fox, 1987). Culturally entwined from Chaucer to Auden, cheese comprises a unique and protein rich piece of our human history.
2. MODERN CHEESE PRODUCTION
3 cheese in 2011 (Geisler, 2012). Due to the vast market for cheese worldwide, the U.S. is also a net exporter with a 29% increase from 2010 (USDA, 2012a). While many specialty cheese operations (defined as producing less than 40 million lbs a year) are growing, the majority of cheese production comes from highly mechanized industrial processes (PRWEB 2012). In just 450 U.S. plants, 30% of the world's cheese is produced (2004 USDEC). Mozzarella is the most popular varietal at 301 million lbs, closely followed by Cheddar at 278 million lbs (USDA, 2012).
2.1 Cheddar Cheese Process
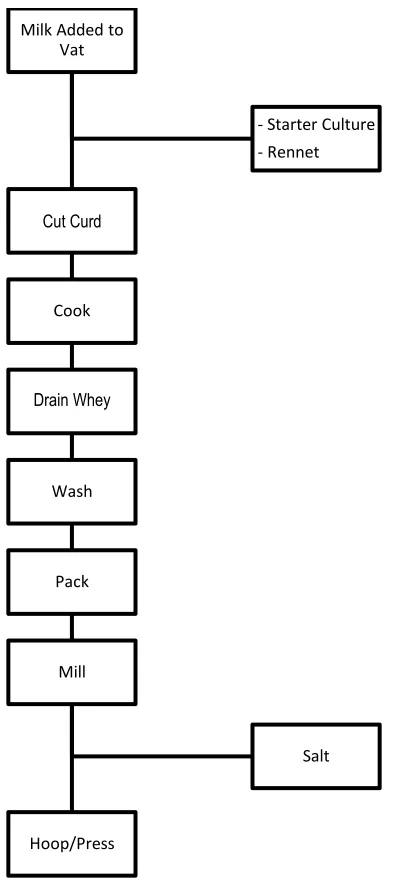
4 stirred curd method to provide a more continuous production process. Make procedure may vary by manufacturer, but the critical steps in a traditional Cheddar production schematic are included in Figure (1-1).
The lengthy ripening time required for Cheddar cheese potentiates several flavor and texture variations among batches, and thus much attention has been directed towards the development of commercially consistent cheese milk. An ideal composition is selected for low amounts of antibiotics, somatic cell content, and microbial pathogens. Many natural variations in stage of lactation, breed, health, season, and genetics can affect the quality of milk resulting in a standardizing step to increase processing and yield constancies (Frakye, 2004). For the production of Cheddar, a casein to fat ratio of 0.7 and total protein content of 3.5% - 4% in milk is most desirable (Lawrence et al. 2004). Additionally, pasteurization has a notable effect on indigenous microflora and enzymes and will result in a milder flavor and longer ripening time than Cheddars made from raw milk (McSweeney and Fox, 1993). Treatments to better control the microbial content of the milk include applications of H2O2,
bactofugation (the removal of microbes via centrifuge), nitrate and lysozyme addition, as well as microfiltration (Frakye, 2004).
Once the milk has been sterilized and added to the vats, it is then inoculated with starter culture. In Cheddar cheese, the primary function of the starter bacteria is the
5 high prevalence (Lane and Fox, 1996). After inoculating the milk, the starter culture can proliferate to concentrations as high as 109 cfu/g but are reduced to only 1% of their
maximum within a month (McSweeney et al. 1994). The death of these bacteria then play an important role in proteolysis. As the cells lyse they release proteolytic enzymes which contribute to the subsequent flavor and texture of the cheese.
After the milk is inoculated with the starter, a coagulant is added to destabilize the casein micelles (Johnson and Law, 1999). These micelles are composed of phosphoproteins αs1-, αs1-, β-, and κ-casein, and associations among proteins are regulated by electrostatic and
hydrophobic interactions (Lucey et al. 2003). The κ-casein is predominately present on the exterior of the micelle and functions to sterically stabilize the structure. Thus, the coagulant acts by hydrolyzing the glycomacropeptide of the κ-casein, effectively cleaving the
hydrophilic coating of the micelle. The remaining para-casein is left with a highly
hydrophobic surface and begins associating into a gel network (Srinivasan et al., 2008). This resulting coagulum entraps both water and fat and is a large contributor to the resulting texture of the cheese (Lawrence et al. 2004). While a host of different coagulants would be suitable for casein destabilization, Cheddar cheese has traditionally been made using calves rennet which is high in chymosin content. Recombinant and microbialy produced rennets are also used. The amount of rennet applied and the type affect the degree of proteolysis in the cheese, and so the concentration is generally targeted to the lowest possible volume to achieve a firm coagulum in the roughly 30 minutes spanning the time from set to cut
6 the subsequent stirring speed impact the eventual fat and protein content of the cheese. Thus, larger particles result in more moisture retained and a greater yield in the cheese (Whitehead and Harkness, 1954). However, curd sizing involves a delicate balance of considerations. If cut too large the curd will have a greater propensity to shatter and will ultimately result in many smaller particles and a significantly decreased yield for the cheese (Johnson et al. 1991).
After cutting, the curd is heated to approximately 38°C to induce further syneresis and control the rate of acid production (Lawrence et al. 2004). During this stage the curd becomes firm, dropping from approximately 87% to less than 39% percent moisture. Acid production in the vat is generally monitored as it is an important determinant of final pH and the rate of whey expulsion (Lawrence and Guiles, 1982). The whey is then drained and the curd is Cheddared while sufficient time elapses in order to induce the necessary acid
development. Once a desired pH is reached, the curd is milled to provide greater surface area for additional whey drainage and to create a more uniform structure for salting.
The dry salting process likely originated from early attempts to preserve the curd and store it for a longer amount of time. Salt in moisture controls rate of bacterial growth and enzymatic activity and so a range between 4.5% and 5.5% is generally desired. Due to variations of moisture content and acidity, salt intake may vary, and thus titratable acidity at salting is assessed to ensure a uniform effect (Lawrence et al. 2004). After the salting, the curd is gently agitated for at least 15 minutes to maximize salt absorption (Breene et al.
7 2.2 Low Fat Cheddar
Americans eat an average of 33 pounds of cheese a year (Moss, 2010), 10 pounds of which are Cheddar (Geisler, 2012). This is also the number 2 source of calcium for
Americans (Fulgoni, 2010). However, concern is growing over the impact that high amounts of saturated fat could have on obesity and public health. The American Heart Association recommends limiting saturated fats to just 7% of daily caloric intake (AHA, 2012), and over 70% percent of consumers report that they wish to reduce the amount of fat they ingest (Childs and Drake, 2009). It therefore follows that a low fat cheese product would be a welcomed addition to help lower fat intake. And this is not a new idea. Research into low fat cheese has been a timely endeavor, with over 50 years of research (Lawrenceet al. 1987). However, a negative consumer perception of low fat cheese persists. Over 44% of consumers describe low fat cheese as bland and less than 20% thought reduced-fat, low-fat, or fat free cheeses tasted as good as the full fat version (Mintel, 2011).
8 decreased values in sensory parameters such as adhesiveness and cohesiveness (Bryant et al. 1995).
3. METHODS FOR ASSESSING CHEESE TEXTURE
As mentioned above, reduced texture quality is one of the hedonic limitations found in low fat Cheddar cheese. Cheese contains an inherently complex structure, and thus a wide variety of tests have been developed to different aspects of its texture. The most basic category of these include 'on site' methods such as probing the curd in vat to determine if sufficient set time has elapsed. However, while these tests provide valuable information to the cheese maker, they are largely intended for quality evaluations of the final product and are less comprehensive in scope. Instrumental and sensory tests have therefore been
developed for a more targeted understanding of product structure. Instrumental tests can be either fundamental or empirical. Empirical tests are typically simple to conduct and are well suited to a manufacturing environment where speed is a premium (Mounsey and O'Riordan, 1999). However, they are also limited in that they do not provide information on material or rheological properties of the system. A prevalent example is the texture profile analysis (Bourne, 1968), which in specific instances has been found to correlate well to sensory properties (Breene, 1975). In comparison, fundamental tests are used to characterize specific material properties and composition.
3.1 Small Strain Tests
9 region (LVR) at a known magnitude. Stress and strain are linearly proportional within the LVR, and so forces induced in this region do not permanently alter structure and are independent of rate (Steffe, 1996). The point at which this relationship deviates is that of critical stress or strain (depending on the force applied) and denotes the transition into the non-linear region (Subramanian and Gunasekaran, 1997). As cheese is a viscoelasitic material, frequency sweeps are often used to probe structural characteristics of the sample. The storage modulus (G') describes the in-phase component relating to the elastic elements in the sample, while the loss modulus (G'') describe the out of phase components and relates to viscous elements in. Other parameters such as the phase angle (δ), loss modulus divided by storage modulus, and complex modulus (G*), a ratio of stress to strain amplitude, are used to provide additional information used to 'fingerprint' the specific structure of the material (Steffe, 1996).
3.2 Large Strain and Fracture Tests
Large strain and fracture pertain to tests assessing properties outside the LVR. These tests give less information on the structural consistency of the material, but can generally relate better to sensory characteristics as they characterize permanent deformations
10 3.3 Sensory Tests
While mechanical methods of evaluation provide valuable information on the structure of food systems and their fundamental material properties, these still do not allow for a comprehensive analysis of the food. In order to best understand the way in which the human mouth perceives texture, a methodological approach which more closely matches this mode of analysis is often used. One of the earliest of these methods includes the dairy
grading system. However, these types of tests remain largely traditional, and are best applied as a measure of quality control (Delahunty and Drake, 2004). Analytical tests, such as descriptive analysis, are therefore used to measure quantitative values. This method uses a panel of judges (often equated as a sensor) which are extensively trained on specific sensory attributes to evaluate the food system (Lawless and Heymann, 1999). Another type of test, the affective sensory test, uses untrained consumers to evaluate the product for acceptability. However, as noted by Foegeding and Drake (2007), this requires many more participants (upwards of 60 vs 6-12 for the descriptive analysis) and must also incorporate the
consideration that consumers are unable to uncouple flavor and texture evaluations. Differences in one of these parameters are therefore likely to affect the other, and thus this test is less useful for determining specific attributes. When used for their appropriate function, sensory tests are an important and invaluable tool to accurately describe the resultant textures of a specific food product.
11 and hardness, as these are evaluated using similar compressive forces, but did not predict creaminess. Rheological values relating to sensory firmness have been found to possess the strongest relationships in Cheddar cheese. Gwartney et al. (2002) found correlations between fracture stress and sensory firmness and springiness . A relation of G' to firmness and
cohesiveness has also been observed, but TPA measures were found to be better predictors of sensory texture overall (Drake et al. 1999). This was also noted by Wium and Qvist (1998) who cited that fracture stress had the greatest correlation to sensory firmness. Hort et al. (1996) also found significant correlations between fracture stress and strain and firmness but very little correlation between chemical (composition) and sensory values. Cheese is a viscoelstic material, and thus the authors suggested there may exist an optimum rate for relating instrumental properties to sensory results. Xiong et al. (2003) found deformation percentage and rate affected correlations between sensory and instrumental hardness. In another study, Green et al. (1981) found an increase in sensory and instrumental firmness with greater milk protein concentration factor, as well as a loss of sensory adhesiveness. The fracture modulus has been found to correlate well to sensory properties (Brown et al. 2003; Rogers et al. 2009). Cohesiveness and smoothness of mass, are two of the more difficult sensory properties to relate to texture as these properties involve interactions with saliva during oral processing. Interestingly, these terms largely account for differentiation among cheeses (Brown et al. 2003).
3.4 Confocal Laser Scanning Microscopy
12 used to image the microstructure of Cheddar cheese. Confocal scanning laser microscopy (CSLM) is unique, and relatively novel (c.a. 1980), in that it allows for visualization of samples with a thickness greater than that of the focal plane. Out of focus light is blocked using a pinhole-sized aperture, and thus a clear resolution can be obtained at various focal positions within the sample (Durrenberger et al. 2001). An additional advantage of this method is that the sectional images can then be overlaid to provide a three dimensional rendering of the sample microstructure. Florescent tags are used to selectively dye compositional components. This approach is therefore well suited for the visualization of cheese as both the protein and fat phases can be targeted (Auty et al. 2001). A potential limitation of this technique is that resolution is limited by diffraction to a minimum of 0.2 µm. This limit may be lowered in some instances, but not without substantially lowering the signal to noise ratio (Auty et al. 1999). While this approach is not desirable for resolving individual proteins, it can provide valuable information on fat globule shape and structure (Everett and Olson, 2003).
13 imparted by milk fat. An 'active' particle will exhibit interactions between the filler and continuous phases, while an 'inactive' particle will not. This condition can affect the storage modulus of the cheese as a reflection of its total volume fraction. Theoretically, an inactive filler will decrease the storage modulus of the system, as it serves to disrupt the continuous nature of the network. The effects of an active filler depend on its storage modulus relative to the network. If the G' prime of the active filler is greater than, equal to, or less than the continuous phase it will serve to increase, not effect, or reduce the G' of the gel network (Dickinson and Chen, 1999). Work conducted on the effects of lipid structure, i.e. native vs. homogenized globules in composite gels observed that a whey protein isolate stabilized emulsion functions as an active filler. The fat globules become emulsified with whey protein adhering to their surface and interact with the casein network to actively increase the storage modulus of the system (McClements et al. 1993; Chen and Dickinson, 1998). Yang et al. (2011) evaluated a number of filled-gel models to predict G' based on fat content at specific temperatures. While notably they did not account for globule size and shape, many were able to adequately predict G' based on the volume of gel and fat phases and their rheological properties.
4. STRATEGIES FOR THE PRODUCTION OF LOW FAT CHEESE
To meet the inherent challenges of creating a low fat product, cheese producers have employed several strategies which generally involve one of three methodological approaches. These include the introduction of adjunct cultures, the inclusion of fat mimetics, and
14 4.1 Adjunct Cultures
Cheese flavor and proteolytic activity are largely resultant from intercellular enzymes introduced via lactic acid bacteria (Soda et al., 2000). The proliferation of starter culture and the subsequent development of nonstarter lactic acid bacteria (nsLAB) is therefore an important consideration in the production of Cheddar cheese. Introduction of nsLAB may originate from the cheese milk itself or from ambient bacteria present in the manufacturing facility. The nsLAB start at relatively low concentrations of 102 - 103 cfu/g in cheese but can proliferate to as high as 108 cfu/g after 12 weeks ageing (Fox et al., 1998). However, due to the compositional differences in a low fat cheese, the development of nsLAB is often greatly reduced (Haque et al., 1997). Adjuncts of select bacteria strains are therefore incorporated into the milk to improve the development of cheese sensory texture and flavor (Soda, 2000). There are now several commercially available cultures selected for improvement of low fat cheese. These can be generally characterized as contributing low acid production, sustained proliferation, and low proteolytic activity (Banks, 2004).
15
helviticus and found an increase in free amino acid concentration and an improvement in low fat cheddar flavor at both 90 and 180 days. Drake et al. (1997) also conducted a study on adjunct strains of Lactobacillus helviticus in 33% reduced fat Cheddar, and found the treatments had lower bitterness scores and significantly higher rates of proteolysis through 6 months ageing. In this study the low fat cheese with adjunct culture was rated similarly in flavor to the full fat control by trained dairy judges and received a higher consumer acceptance score than the full fat control. A study by Weimer et al. (1997) found flavor improvements in 60% reduced fat Cheddar from the use of adjunct cultures of
Brevibacterium linens and identified methanethiol producing capacity, as opposed to aminopeptidase, as the primary driver for increasing consumer preference scores. Viable adjuncts have potential for flavor improvement in low fat Cheddar, but are limited in that the cells must first die off before their enzymatic potential is realized.
Many studies have therefore assessed attenuated and highly autolytic cultures which can increase enzymatic activity and provide an increased rate of flavor development and proteolysis without affecting acid production (El Soda, 2000). Cultures are generally attenuated using physical methods such as freeze drying, freeze shocking, or spray drying (Fox et al., 1996). However, these methods often enact differing levels of enzymatic viability and release. El Soda et al. (1999) reviewed various methods and found freeze shock resulted in the highest levels of autolysis. Using a strand of highly autolytic Lactobacillus helviticus
16 Guinee et al. (1991) observed increased rates of proteolysis using elevated ripening temperatures and enzymes, but detected an increase in soapy flavor and an overly soft, brittle, and adhesive texture for full fat cheese. Increased proteolytic rates were also observed by Hannon et al. (2003). Work by Benech et al. (2003) found that incorporation of a nisin producing culture enhanced proteolysis but did not affect cheese fracturability or
cohesiveness. It has been noted that ripening accelerators can alter cheese texture by lowering hardness and increasing fracturability (Sallami et al., 2004). Fenelon et al. (1999) found that an elevated ripening temperature (12°C) in conjunction with a Lacticin producing starter increased proteolysis but contributed no effects to flavor or texture. The use of
17 4.2 Fat Mimetics
Another prevalent strategy for the production of low fat cheese is the incorporation of filler particles, conventionally categorized into fat substitutes and fat mimetics. The former are generally non-polar compounds possessing the same physical properties as fat with a reduced caloric potential. The latter, fat mimetics, are polar, water soluble compounds intended to replicate the sensory and functional characteristics of fat (Jones, 1995). While several commercial versions of both these filler particle types are currently available, this review will address those mimetics of both protein and polysaccharide component structures. Many of the mimetics particles are manufactured through a variant of the process outlined by Singer and Dunn (1990) which uses a homogenizing pasteurization treatment to form
microparticulated proteins. The particles can then be spray dried for extended storage and rehydrated for incorporation into a food system. Commercial mimetics are generally
designed to be used in a wide variety of dairy products including ice-cream, sour cream, and yoghurt (Yazici and Akgun, 2004), but while cheese is an apparent potential application, only a handful of studies have been conducted to evaluate the efficacy of mimetics in Cheddar.
18 polysaccharide based structures Novagel and Stellar. Their findings reflect that ripples in the delipidated indentions (artifacts from microscopy) differed between mimetic, with Dairy-Lo and Stellar exhibiting significantly fewer ripples than the low fat control. Relating these structures to cheese texture, the researchers suggested the protein layers (ripples) may provide a mechanism to resist crushing during compression (Aryana and Haque, 2001). A study by Konuklar et al. (2004a) used scanning electron microscopy to examine cheeses containing Nutrim. They noted that treatment cheeses had an altered microstructure with more uniform droplet voids than the low fat control. These differences were also observed by Drake et al. (1996), as cheeses containing mimetics exhibited a smoother protein phase and more finely dispersed fat network than the control.
19 exhibited little effects save whitening in low fat mozzarella. In order to incorporate Salatrim into the cheese, the milk had to first be homogenized. The researchers therefore speculate the slightly higher yields found in cheese treated with Salatrim were likely the result of the homogenization treatment. McMahon et al. (1996) also found little efficacy, save moisture retention, using both protein and carbohydrate based fat replacers in mozzarella cheese. Konuklar et al. (2004b) found Nutritrim had lower mechanical texture values of hardness and fracturability than the low fat control but also that the cheese exhibited a bitter taste and a starchy, less creamy mouth feel. Drake et al., (1996) investigated the effect on various fat mimetics on 60% reduced fat Cheddar. The study found Novagel, Dairy-Lo, and ALACO PALS all increased moisture retention in the cheese. An attribute specific sensory panel found all three mimetics had significantly greater firmness scores than the low fat control but also exhibited reduced values of rubberiness. A consumer acceptance panel rated cheeses containing Novagel and ALACOPALS as significantly improved from the low fat (but not equal to the full fat) control. Ma et al. (1997) investigated the rheology of Cheddars (60% reduced fat) containing Dairy-Lo, Novagel, and ALACOPALS. As evaluated by small strain rheology, they found Novagel to be the most improved treatment in mimicking the full fat control, although the researchers note that none of the mimetics were similar to the full fat control.
20 efficacy from the commercial mimetics assessed. Clearly more work is needed both in
characterizing the effects of these mimetics when applied to cheese and in understanding their effects on cheese microstructure, mechanical values, and texture.
4.3 Make Procedure Modifications
It is well known that producing a Cheddar cheese with a reduced fat content alters both its texture and flavor, and thus several adjustments in make procedure have been assessed in an attempt to alleviate these effects.
4.3.1Acid and Moisture Regulation
While there exist several conceivable options for procedural modifications in Cheddar cheese manufacture, Drake and Swanson (1995) report that the majority of these adjustments affect the two critical factors of acid production and moisture content. Control of acid
production can help mitigate development of bitter flavors and increase moisture retention with a higher pH at mill. Acid levels at drain are an important regulator for the percentage of chymosin, plasmin, and Ca2+ retained in the curd, and a high pH at this point can lead to lowered plasmin activity (Lawrence et al. 1984). It is generally held that a greater fat content in the curd makes it more difficult to remove moisture through syneresis (Lawrence and Giles, 1987). Increasing moisture content, generally accomplished by lowered scald and stir times (Banks et al. 1989; Mistry et al. 1998), is used to increase yield. However, a significant drawback of increased moisture is a shorter shelf life and lower keeping quality.
21 2004). Curd washing has been a frequently enlisted method to remove excess lactose (Drake and Swanson, 1995) but is of questionable efficacy as it has been suggested that the curd skin at this stage of production has sufficiently hardened to disallow significant permeation. Washing may also reduce the rate of syneresis by removing residual calcium. This would provide for greater hydration of the caseins and a softer resultant curd texture (Banks, 2004). Rehman et al. (2004) found that adjusting the amount of lactose in the milk affected finished cheese texture and flavor. High lactose milk resulted in a cheese with lower flavor scores, while the low lactose treatment exhibited a softer, more crumbly texture with mild flavor. A study by Guinee et al. (2007) found that a higher pH at milling increased moisture retention and lowered rheological firmness in cheese, though these changes were undistinguished by a grading panel.
4.3.2 Cheese Milk Modifications
22 powder, appeared coarse with irregular large voids. The authors recommend this
modification for commercial production of low fat cheese, necessitating future work for a greater understanding of buttermilk powder's effect on sensory texture and consumer acceptance.
Another approach by Molina et al. (2000) employed a pressurized homogenization treatment (400 MPa for 15 min.) and found that it induced a faster coagulation time. This resulted in an increased moisture and protein retention as well as a decreased hardness in the finished cheese. The researchers also noted increased proteolytic activity, but ceded this effect may be attributed to higher levels of residual rennet. McGregor and White (1990) found that ultrafiltration (5x concentration of solids) resulted in higher moisture, salt, and total protein, as well as lower lactic acid, but did not significantly improve the texture or flavor of the finished cheese.Oommen et al., (2000) found cheese made with ultrafiltrated and homogenized milk in conjunction exhibited more desirable texture scores, as determined by an experienced dairy panel, than concentrated milk alone. In a comparison of
microfiltration and ultrafiltration, Rodriguez et al. (1999) found ultrafiltration to result in greater yields, while mircrofiltration resulted in a firmer mechanical texture due to lower retention of whey.
23 globules increased moisture in the cheese and contributed to a more desirable melting
texture, an effect thought to be the result of a thinner casein coating on the globules. 4.3.3 Homogenization of Cheese Milk/Cream
Alterations on milk fat globule size and structure have frequently been employed as strategies for texture improvement in low fat Cheddar cheese. Among the most well studied processes to elicit these effects is the homogenization of milk prior to renneting.
Homogenization both reduces fat globule size (with a concomitant increase in surface area by a factor of 4-10x) (Nair et al. 2000) and disrupts the milk fat globule membrane, increasing membrane-casein interactions (Mistry, 2001). The former of these alterations increases fat retention in the renneted gel (Oommen, et al. 2000; Banks, 2004), and the later contributes to a more rigid curd structure. However, along with an increased moisture retention in cheese (Emmons et al. 1980), homogenization of milk can also induce an undesirable flavor in hard cheeses and contribute to processing defects such as curd matting and shattering (Peters, 1955; McGregor and White, 1990). For this reason, the homogenization of milk is not frequently employed in the commercial manufacture of hard cheeses (the exception being blue cheese in which homogenization is used for flavor development by lipid hydrolysis).
24 fat non-homogenized control) as well as improved yields and increased moisture. However, these improvements were still unable to match the texture of the full fat control. In a similar study on reduced fat Mozzarella, Rudan et al. (1998) found homogenized cream treatments elicited minimal curd shattering and provided an increased moisture content and whiter color. Nair et al. (2000) also assessed homogenization of cream to improve body and mouth feel and noted that, as fat has a greater tendency to clump once the milk fat membrane is
disrupted, there is an optimum fat content to homogenization pressure ratio for commercial applications of Cheddar cheese made using this strategy. The study also found homogenized cream did not increase rennet clotting time, as has been observed with homogenized milk, and suggested this difference emphasizes the lesser degree of -casein coating on the fat globule surface for homogenized cream. Metzer and Mistry (1995) examined the
microstructure of reduced fat Cheddar cheeses using Scanning Electron Microscopy and confirmed a uniform distribution of smaller sized fat globules in cheeses made with
homogenized cream. Additionally, they found this treatment decreased the levels of free oil in the cheese, suggesting improved emulsifying properties resulting in an increased yield.
A study exploring the effects of fat distribution found that inhomogenously distributing fat in emulsion filled gels improved sensory mouth feel attributes. The
25 effect. In this study, curds of high and low fat cheese were blended to produce a reduced-fat Cheddar. Notably, the low fat curds contained the fat mimetic Dairy-Lo (at the manufacture's recommended level, 2% w/w). An additional treatment, which was shredded after milling, was found to significantly reduced cheese firmness in comparison to the low fat control. Both the blended and shredded-blended curd reduced yield stress. A trained grading panel
however found no differences between treatments and the low fat control cheeses.
5. CONCLUSIONS
26 6. REFERENCES
Aryana, K. J., & Haque, Z. U. (2001). Effect of commercial fat replacers on the
microstructure of low-fat cheddar cheese. International Journal of Food Science & Technology, 36(2), 169-177.
Banks, J. M. (2004). The technology of low-fat cheese manufacture. International Journal of Dairy Technology, 57(4), 199-207.
Banks, J. M., Brechany, E. Y., & Christie, W. (1989). The production of low fat cheddar-type cheese. International Journal of Dairy Technology, 42(1), 6-9.
Banks, J. M., Hunter, E. A., & Muir, D. D. (1993). Sensory properties of low fat cheddar cheese:Effect of salt content and adjunct culture. International Journal of Dairy Technology, 46(4), 119-123.
Benech, R., Kheadr, E. E., Lacroix, C., & Fliss, I. (2003). Impact of nisin producing culture and liposome-encapsulated nisin on ripening of lactobacillus added-cheddar
cheese. Journal of Dairy Science, 86(6), 1895-1909.
Bryant, A., Ustunol, Z., & Steffe, J. (1995). Texture of cheddar cheese as influenced by fat reduction. Journal of Food Science, 60(6), 1216-1219.
Childs, J. L., & Drake, M. (2009). Consumer Perception of Fat Reduction in Cheese. Journal of Sensory Studies, 24(6), 902-921
Delahunty, C. M., Piggott, J. R., Conner, J. M., & Paterson, A. (1996). Comparison of dynamic flavour release from hard cheeses and analysis of headspace volatiles from the mouth with flavour perception during consumption. Journal of the Science of Food and Agriculture, 71(3), 273-281.
Drake, M. A., Boylston, T. D., Spence, K. D., & Swanson, B. G. (1997). Improvement of sensory quality of reduced fat cheddar cheese by a lactobacillus adjunct. Food Research International, 30(1), 35-40.
Drake, M. A., Bolyston, T. D., & Swanson, B. G. (1996). Fat mimetics in low-fat cheddar cheese. Journal of Food Science, 61(6), 1267-1271.
27 El Soda, M., Madkor, S. A., & Tong, P. S. (2000). Adjunct cultures: Recent developments
and potential significance to the cheese industry. Journal of Dairy Science, 83(4), 609-619.
Fenelon, M. A., Beresford, T. P., & Guinee, T. P. (2002). Comparison of different bacterial culture systems for the production of reduced-fat cheddar cheese. International Journal of Dairy Technology, 55(4), 194-203.
Fenelon, M. A., Ryan, M. P., Rea, M. C., Guinee, T. P., Ross, R. P., Hill, C., et al. (1999). Elevated temperature ripening of reduced fat cheddar made with or without lacticin 3147-producing starter culture. Journal of Dairy Science, 82(1), 10-22.
Guinee, T. P., Fenelon, M. A., Mulholland, E. O., O'kennedy, B. T., O'brien, N., & Reville, W. J. (1998). The influence of milk pasteurization temperature and pH at curd milling on the composition, texture and maturation of reduced fat cheddar cheese. International Journal of Dairy Technology,51(1), 1-10.
Guinee, T. P., Auty, M. A. E., & Fenelon, M. A. (2000). The effect of fat content on the rheology, microstructure and heat-induced functional characteristics of cheddar cheese. International Dairy Journal, 10(4), 277-288.
Hannon, J. A., Wilkinson, M. G., Delahunty, C. M., Wallace, J. M., Morrissey, P. A., & Beresford, T. P. (2003). Use of autolytic starter systems to accelerate the ripening of cheddar cheese. International Dairy Journal, 13(4), 313-323.
Johnson, J. A. C., Etzel, M. R., Chen, C. M., & Johnson, M. E. (1995). Accelerated ripening of reduced-fat cheddar cheese using four attenuated lactobacillus helveticus CNRZ-32 adjuncts. Journal of Dairy Science, 78(4), 769-776.
Kailasapathy, K., & Lam, S. H. (2005). Application of encapsulated enzymes to accelerate cheese ripening. International Dairy Journal, 15(6–9), 929-939.
Kilcawley, K. N., Nongonierma, A. B., Hannon, J. A., Doolan, I. A., & Wilkinson, M. G. (2012). Evaluation of commercial enzyme systems to accelerate cheddar cheese ripening. International Dairy Journal, 26(1), 50-57.
28 Konuklar, G., Inglett, G. E., Warner, K., & Carriere, C. J. (2004). Use of a β-glucan
hydrocolloidal suspension in the manufacture of low-fat cheddar cheeses: Textural properties by instrumental methods and sensory panels. Food Hydrocolloids, 18(4), 535-545.
Lane, C. N., & Fox, P. F. (1996). Contribution of starter and adjunct lactobacilli to proteolysis in cheddar cheese during ripening. International Dairy Journal, 6(7), 715-728.
Lawrence, R. C., Gilles, J., Creamer, L. K., Crow, V. L., Heap, H. A., & Honoré, C. G. Cheddar cheese and related dry-salted cheese varieties. Cheese: Chemistry, physics and microbiology (pp. 71-102).
Lucey, J. A., Johnson, M. E., & Horne, D. S. (2003). Invited review: Perspectives on the basis of the rheology and texture properties of cheese. Journal of Dairy Science, 86(9), 2725-2743.
Lucey, J. A., Johnson, M. E., & Horne, D. S. (2003). Invited review: Perspectives on the basis of the rheology and texture properties of cheese. Journal of Dairy Science, 86(9), 2725-2743.
Ma, L., Drake, M. A., Barbosa-Canovas, G. V., & Swanson, B. G. (1997). Rheology of full-fat and low-full-fat cheddar cheeses as related to type of full-fat mimetic. Journal of Food Science, 62(4), 748-752.
McGregor, J. U., & White, C. H. (1990). Effect of enzyme treatment and ultrafiltration on the quality of lowfat cheddar cheese. Journal of Dairy Science, 73(3), 571-578.
McMahon, D. J., Alleyne, M. C., Fife, R. L., & Oberg, C. J. (1996). Use of fat replacers in low fat mozzarella cheese. Journal of Dairy Science, 79(11), 1911-1921.
McSweeney, P. L. H., Fox, P. F., Lucey, J. A., Jordan, K. N., & Cogan, T. M. (1993). Contribution of the indigenous microflora to the maturation of cheddar
cheese. International Dairy Journal, 3(7), 613-634.
Metzger, L. E., & Mistry, V. V. (1994). A new approach using homogenization of cream in the manufacture of reduced fat cheddar cheese. 1. manufacture, composition, and yield. Journal of Dairy Science, 77(12), 3506-3515.
29 Mistry, V. V., Metzger, L. E., & Maubois, J. L. (1996). Use of ultrafiltered sweet buttermilk
in the manufacture of reduced fat cheddar cheese. Journal of Dairy Science, 79(7), 1137-1145.
Mistry, V. V. (2001). Low fat cheese technology. International Dairy Journal, 11(4–7), 413-422.
, & López-Fandiño, R. (2000). Use of high-pressure-treated milk for the production of reduced-fat cheese. International Dairy Journal, 10(7), 467-475.
Mosca, A. C., Rocha, J. A., Sala, G., van de Velde, F., & Stieger, M. (2012). Inhomogeneous distribution of fat enhances the perception of fat-related sensory attributes in gelled foods. Food Hydrocolloids, 27(2), 448-455.
Nair, M. G., Mistry, V. V., & Oommen, B. S. (2000). Yield and functionality of cheddar cheese as influenced by homogenization of cream. International Dairy Journal, 10(9), 647-657.
Romeih, E. A., Moe, K. M., & Skeie, S. The influence of fat globule membrane material on the microstructure of low-fat cheddar cheese. International Dairy Journal.
Rudan, M. A., Barbano, D. M., & Kindstedt, P. S. (1998). Effect of fat replacer (salatrim®) on chemical composition, proteolysis, functionality, appearance, and yield of reduced fat mozzarella cheese. Journal of Dairy Science, 81(8), 2077-2088.
Sallami, L., Kheadr, E. E., Fliss, I., & Vuillemard, J. C. (2004). Impact of autolytic,
proteolytic, and nisin-producing adjunct cultures on biochemical and textural properties of cheddar cheese. Journal of Dairy Science, 87(6), 1585-1594.
Shakeel-Ur-Rehman, Waldron, D., & Fox, P. F. (2004). Effect of modifying lactose concentration in cheese curd on proteolysis and in quality of cheddar
cheese. International Dairy Journal, 14(7), 591-597.
Zamora, A., Ferragut, V., Guamis, B., & Trujillo, A. J. (2012). Changes in the surface protein of the fat globules during ultra-high pressure homogenization and conventional
30 Table 1-1. CHEDDAR CHEESE CATEGORY DEFINITIONS
Category Definition
Fat-free Less than 0.5 g per serving Low fat Maximum 3 g total fat per serving
Light If less than 50% of the calories come from fat
Reduced fat
Minimum 25% reduction in total fat per reference amount
31 Table 1-2. SUMMARY OF SOME COMMERCIALLY AVAILABLE FAT
MIMETICS.
Commercial
Name Base Composition Vendor
Dairy Lo whey protein, lactose Parmalat SpA. Collecchio, Italy Simpless milk, egg protein CPKelco. Atlanta, GA
Novagel Microcystaline
32 Figure 1-1. Production Schematic of Cheddar Cheese.
Figure adapted from (Banks et al. 2007) Milk Added to
Vat
Cut Curd
Cook
Drain Whey
Wash
Pack
Mill
Hoop/Press
33 CHAPTER 2. DEVELOPMENT AND MANUFACTURE OF WHEY PROTEIN
PARTICLE PARTICLES.
34 1. ABSTRACT
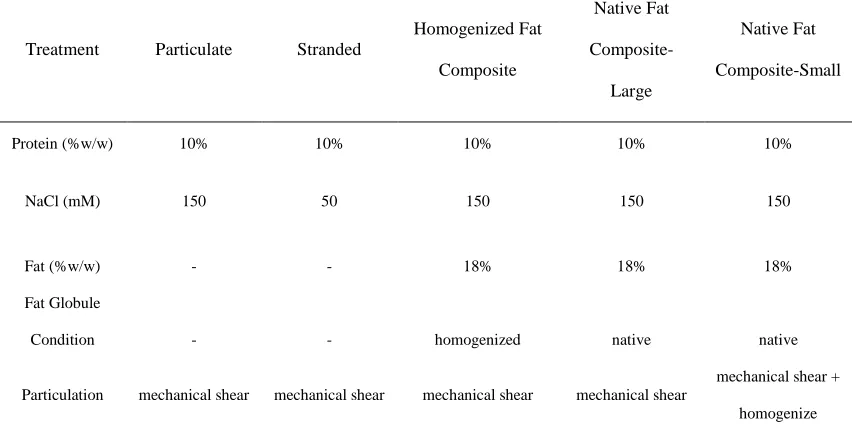
A series of whey protein gel based fat mimetics were developed for application into Cheddar cheese. It was hypothesized that whey protein gel particles could function as fat mimetics if they were both substituted at a phase volume equal to the fat removed and had similar interactions with the casein gel network. This study enlisted a novel approach for fat mimetic particle production which enables the design of a particle with specific rheological and textural properties. Protein, salt, and fat concentrations significantly affected the
rheological and sensory texture characteristics of whey gels. Particle size and appearance, as determined using confocal laser scanning microscopy, were found to be dictated by gel composition. Fat globule condition (native vs. homogenized) had no effect on gel fracture rheology. This work illustrates the suitability of a function oriented approach for creating a Cheddar cheese specific fat mimetic.
2. INTRODUCTION
35 and McSweeney, 2004), there has been little progress in creating a low fat Cheddar cheese capable of emulating the full fat product (Johnson et al. 2009).
The US Food and Drug Administration regulates that low fat cheese contain no more than 3 g of fat per reference amount. This puts the target at 6% w/w fat, which requires a 75-80% reduction from the full fat product (Narasimmon, 2008). Cheddar cheese production is an inherently complex process which relies on microbiological and enzymatic activity over an extended ageing period to generate its characteristic texture and flavor (Grappin et al.
1985). Like most cheeses, Cheddar is produced through a series of steps that remove water, minerals and lactose to concentrate casein and fat into a semi-solid material. Protein
composition is dependent upon the volume fraction of incorporated milk fat (Roberts and Vickers, 2006). While full fat Cheddar must contain a minimum of 50% solids (wt/wt), moisture content is limited to 39% (wt/wt) (CFR 133.113), so protein content is concentrated upwards from c.a. 20% as fat is removed (Lynch et al. 1996). Ageing is also critical to producing desirable Cheddar cheese flavor and texture (Lawrence et al. 2006; Rogers et al.
2009). Therefore, a desirable reduced (25% reduction from reference amount) or low (< 3 g per reference amount) fat Cheddar cheese requires substituting for the physical and chemical contribution of fat while taking care not to interfere with the ageing process.
36 the absence of specific free fatty acids dictate an attenuated "Cheddar" flavor development (Banks et al. 1989). Rodriguez (1999) then concluded that low fat cheeses made using a conventional method, i.e. using low fat milk, is an insufficient strategy, as these cheeses will be replete with textural and flavor defects. The challenge of producing a desirable low fat cheese must therefore be addressed by consideration of the respective phase volumes of constituent elements and the structural mechanisms which affect finished product texture and flavor development. To apply this modality, cheese is modeled as a composite gel with the textural properties compliant upon the continuous protein phase and discontinuous, or filler, fat phase (Tolstoguzov and Braudo 1983). It then follows that as a large portion of the filler phase is removed, a solution must be found to restore this depleted phase volume if the low fat product is to exhibit similar textural characteristics as its full fat counterpart. Several commercial fat mimetics have been developed for this purpose (reviewed in chapter 1). Ideally, these mimetics would be able to emulate the mechanical properties of fat while using a different component structure.
Several studies have been conducted to assess the efficacy of commercial fat mimetics in cheese (See chapter 1), but have found these particles largely incapable of replicating the functionality of fat. This outcome may be affected by the desire of
37 fat. The better approach for developing a suitable fat mimetic is therefore to first identify the physio-chemical function of fat in Cheddar cheese, which then allows for the creation of a fat mimetic with a product specific design. But while the relationship between fat content and finished cheese texture is well researched (Emmons et al. 1980; Bryant et al. 1995; Fenelon
et al. 1999; Guinee et al. 2000; Gwartney et al. 2002; Rogers et al 2009; Xin et al. 2011), the mechanisms by which fat induces this characteristic texture profile is less understood.
A prevalent approach to understanding the relationship between fat content and texture is to model Cheddar cheese as a particle filled gel. According to theory, texture is dictated by a discontinuous filler phase (fat) and a continuous phase (casein) (Rogers et al.
2009). The relationship between these two phases is also important, as the discontinuous phase can function as an active (interacts with the continuous phase) or inactive (no interaction with the continuous phase) filler. The effect of the filler's interaction with the continuous phase is also dependent on the relative strength of the latter (van Villet, 1988). Active fillers will have a strong effect on a gel with a relatively low storage modulus, while their effect will be more palliated if the storage modulus of the gel is already high (Dickinson and Chen, 1999). Yang et al. (2011) applied the filled gel theory to model the effects of fat content on Cheddar cheese. While this study found several filled gel derived models an apt predictor of the cheese storage modulus, these properties are only relevant when applied to small strain testing (within the linear viscoelastic region), and our understanding of
mechanisms controlling fracture properties remains relatively limited.
38
al., 2009; McClements et al. 1993), so that when applied to Cheddar cheese, these gels may be used to better understand the fracture mechanisms responsible for full fat texture. There are currently commercially available whey protein based fat mimetics, most notably
Simplesse (CPKelco. Atlanta, GA) and Dairy-Lo (Parmalat SpA. Collecchio, Italy) which are formed using a microparticulation process to provide a tight particle size distribution of essentially a dry, protein aggregate. However, this method is limited in that the mechanical properties of the whey protein particles are process dependent, i.e. the particles must be formulated in such a way so as to allow for microparticulation. As our study first creates a whey protein gel with the desired functional properties and subsequently uses mechanical means to control particle size, our approach is therefore novel in allowing for a process independent functional design of a whey protein based fat mimetic.
3. MATERIALS AND METHODS
3.1. Preparation of Whey Protein Particles
39 protein gel with the potential for a wide range in structure and composition, requiring only that it form a cohesive soft-solid. Particulation is achieved using a mechanical mixer. It is important to note that this method results in a relatively broad spectrum of particle sizes, and thus a homogenizer was used on select treatments for further particulation.
3.1.1. Formation of Whey Protein Macrogels.
Whey Protein Isolate (WPI) (94.06% protein, dry basis) was obtained from Davisco Foods International Inc. (Le Suer, Minn. USA) and stored at room temperature (23 ± 2°C). The Deionized water system was obtained from a Dracor Water Systems (Durham, NC, USA) with a resistivity minimum of 18.2MΩ-cm. Cream was obtained from the North Carolina State University Dairy, and fat content was determined using a CEM Smart Trac Rapid Fat Analyzer (Matthews, NC, USA). Sodium Chloride (Iodine free) was purchased from a local grocery.
Gels were heat set (1 hr at 85°C ) from solutions containing various protein (% w/w), fat (% w/w), and salt concentrations (mM) to induce differing rheological properties. As one of the major objects of this study we sought to demonstrate the range of functionalities induced by differences in particle composition and structure. While certainly not a
40 homogenization of the native fat composite-L particles, after mechanical grinding, and were intended to assess the feasibility of a particle type with a tightly controlled size distribution rage (Figure 2-4).
3.1.2. Whey Protein Microgel Particulation.
Heat-set whey protein gels were created on a macro scale, heretofore referenced macrogels, and were allowed to set for 24 hrs at 8 ± 2°C prior to testing. Macrogels were mechanically ground using a Stephen UMC 5 Mixer (Stephan Machinery gmbH; Hameln, Germany) at 3,000 rpm for 1 minute under continuous stirring. A 1:1 (w/w) addition of cylindrical nugget ice was used to induce flow. Additional particulation of select treatments (Table 2-1) was achieved using a Panda NS1001L2K batch homogenizer (Niro Soavi: Parma, Italy) in which particle suspensions in deionized water with a 1:4 (w/w) dilution were created and homogenized at 400 bar.
3.2. Particle Size Analysis
A Horiba LA 300 (Kyoto, Japan) equipped with a 42 channel photo-diode detector was used for particle size analysis. Particles were diluted in deionized water at a 1/100 (w/w) ratio, and were stirred vigorously before measurement. The light was set at a wavelength of 650nm, and size distribution data (Figure 2-4) represent the average of 5 replications.
3.3 Rheological Analysis
3.3.1. Small Strain Tests
3.3.1.1. Determination of the Linear Viscoelastic Region
41 to 3,000 Pa using a 20 mm serrated plate geometry. Samples were shaped to a 4 mm
thickness with a commercial deli slicer, trimmed to the size of the plate, and the exposed surface was coated with a synthetic lubricant (SuperLube, Synco Chemical: Bohemia, NY, USA) to prevent moisture loss during sample testing. Strain sweeps were conducted at 25°C at a constant frequency of 10 Hz. Critical stress and strain values were determined as the point at which G* regularly differed by > 1% of the previous value.
3.3.1.2.Controlled Temperature Frequency Sweeps
Frequency sweeps were conducted using a Stress Tech controlled stress rheometer (ATS Rheosystems: Brodentown, NJ) at 25°C. Samples were prepared and shaped using the same procedure as described in the determination of the LVR. As critical stress values varied widely across samples, a strain value of 0.0036, which the rheometer calculated as
deformation induced by a known torque, was selected as it was well within the LVR for all samples. The corresponding stress value for each sample treatment was then used for the frequency sweep.
3.3.2. Large Strain Rheological Tests
A compression/decompression test was used to assess the large strain deformation properties of the whey protein gels. The method was adapted from Van Den Berg et al.
42 rate of 50 mm/min. Simpson’s rule, a trapezoidal approximation well adapted to third degree polynomials, was used to calculate the area under the force-deformation curve with an even number of sub-intervals (x) with a width of Δx (Eq. 2.1).
(Eq. 2.1)
The % recoverable energy (not lost to heat or flow) was calculated from the ratio of the area under the second half of the curve to the area under the first.
(Eq. 2.2)
3.3.3. Fracture Analysis
A torsion method adapted from Rogers et al. (2009) was used to determine non-linear fracture analysis. Gel samples were shaped into a cylindrical geometry with a length of 28 mm and diameter of 19 mm using a cork borer. During the proceeding steps, gels were kept in a sealed plastic bag to avoid moisture lost. Notched plastic disks (Gel Consultants;
Raleigh, NC, USA) were adhered to both ends of the cylindrical samples using cyanoacrylate adhesive (Loctite 401: Loctite Corp.; Rocky Hill, CT, USA). These served as stabilization points and allowed for the subsequent gel shaping into a capstan geometry using a precision grinding machine (Model GCPM92 US, Gel Consultants. Raleigh, NC, USA). Samples were tested at a strain rate (γ) of 0.45 s-1
43 Haake GmbH, Karlsruhe, Germany) with an added attachment designed for torsion testing (Truong and Daubert, 2000). Elapsed time (t) at maximum torque (M) was used to calculate angular deformation (φ) of the sample (φ= γt). True shear strain (γtrue) and shear stress (σ)
were calculated using the equations derived by Deihl et al. (1980) listed below:
3 min 2 r KM (Eq. 2.3) Q r K t 3 min 2 (Eq. 2.4) 2 / 1 2 2 4 1 2 1 ln 2 1 t t t
true (Eq. 2.5)
K (1.08) is a shape factor constant and Q (8.45x10⁶ m-3) a curvature section constant, while
rmin is the minimum radius in the middle of the capstan-shaped sample.
3.3.4. Post Fracture Analysis
44 3.4. Descriptive Sensory Texture Analysis
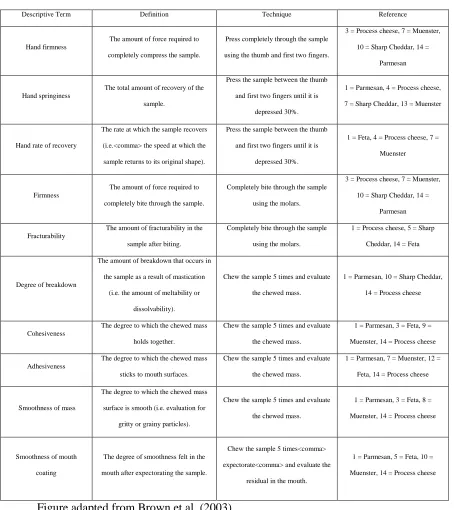
A trained Sensory panel using a cheese texture lexicon modified from Brown et al. (2003) by the method as described in Barden et al. (2010) was used (Table 2-3). The descriptive analysis was performed by seven panelist using the SpectrumTM method as reviewed by Drake and Civille (2003). All panelists had over 200 hours of experience in texture-specific evaluations. Each sample was evaluated in duplicate using a randomized balanced design. Gels were shaped (19mm diameter and 15mm height) using a cork borer, stored in a 112 mL soufflé cup, and were brought to room temperature (23 ± 2°C)
immediately prior to evaluation so as to prevent variation due to moisture loss. Samples were given a randomized three digit code and evaluated using a 0-15 point (Table 2-3). Panelists expectorated samples after evaluation.
3.5 Confocal Laser Scanning Microscopy
45 3.6 Statistical Analysis
Statistical analyses were conducted using MINI TAB statistical software (Version 16). One way Analysis of Variance with a Tukey post hoc test was used to determine significance at p < 0.05.
4. RESULTS AND DISCUSSION
4.1 Small Strain Rheological Tests
Gels were tested for frequency dependence (Figure 2-2) at stress values
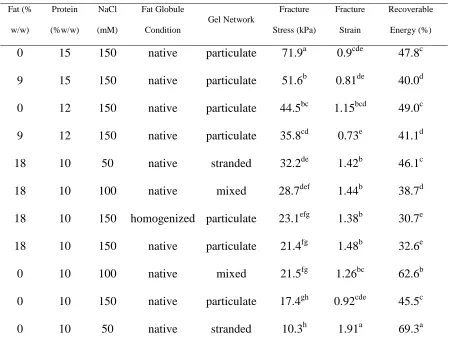
corresponding to a strain of 0.0036, which was determined to be within the linear viscoelastic region. Evaluations were conducted at 25°C which was reasoned an approximate natural consumption temperature. Gel network structure affected the storage modulus of the samples. Stranded and particulate gels were both formulated at 10% (w/w) protein, yet the former exhibited less frequency dependence and lower storage modulus values. The homogenized fat composite gels exhibited greater storage modulus values than the particulate or stranded types. The composite gels contained a greater protein to water ratio, and thus the difference is likely the result of a diminished phase volume in the fluid water component. Practically, there was little difference incurred by the degree of homogenization and resultant fat globule membrane structure on the G' values of the composite type whey protein gels.
4.2. Large Strain Rheological Tests
46 decomposition and energy dissipation through the viscous component of the gel.
Homogenization had no significant effect on fat functionality (table 2-2). Both salt and fat reduced energy recovery with increasing concentration, with the stranded type gels exhibiting the greatest recoverable energy of all the treatments. Whey protein concentration had no significant effect on recoverable energy.
4.3. Fracture Analysis
Torsion was used to measure sample fracture stress and strain as the twisting deformation minimizes syneresis during testing as compared to a uniaxel compression method (Hamman et al. 2006). The fracture stress of the gels was highly dependent upon protein concentration (table 2-2). Increasing protein content resulted in an increased fracture stress, yet also lowered fracture strain. While the stranded gel had the lowest fracture stress of the samples tested, it also had the greatest fracture strain. Thus, while these results are well understood as they relate to gel network structure (Foegeding et al. 1992; Gwartney et al. 2004), they illustrate that adjustments to fracture properties are best understood as a series of tradeoffs, as lowering either fracture stress or strain will often increase the other. Salt