ABSTRACT
ROGERS, NEAL ROBERT. The Effect of Fat Content and Aging on the Texture of Cheddar Cheese. (Under the direction of E. Allen Foegeding).
Low fat cheese has recently gained popularity for the health conscious consumer, but these cheeses often have undesirable characteristics such as lack of opacity and rubbery textures which contribute to negative consumer perceptions. The overall structural reasons for these differences are not understood. Determining why these textural differences occur, and what role fat plays in this structural change, was the goal of this research.
In this study, two sets of cheeses were tested. The first set consisted of five cheeses, two of these cheeses were at normal fat contents for Cheddar cheese (33% fat), two were at “low” fat contents (6% fat), and one cheese at a “reduced” fat content (16% fat), these were tested at 0.5, 3, 6, and 9 months of age. The second set of cheeses consisted of Cheddar cheeses with fat contents of 3%, 8%, 13%, 18%, 23%, 28%, and 33% tested at 2, 4, 8, and 12 weeks of age.
into three distinct regions of material behavior, linear, non-linear, and fracture. These regions represent the stress/strain response from low to high magnitude respectively. These results were then compared to sensory to determine relationships.
The first set of cheeses showed strong relationships between sensory terms and the critical stress and strain and the BST model related non-linear curve shape. Some correlation was seen with fracture values, but these were not as high as terms related to the non-linear region of the cheeses. These results showed that the strain weakening behavior of the non-linear region is affected by the fat content, with higher fat cheeses breaking down more as strain increases than lower fat cheeses. Using this information, the second set of cheeses was evaluated with a focus on the non-linear region. Percent recoverable energy, which measures breakdown within the non-linear region, showed strong relationships with all of the sensory terms, with critical point and fracture values showing lower, but still significant correlations. These relationships, coupled with knowledge about oral processing, leads to the conclusion that the non-linear, strain weakening behavior of Cheddar cheese is the key structural region in understanding texture.
The Effect of Fat Content and Aging on the Texture of Cheddar Cheese
by
Neal Robert Rogers
A thesis submitted to the Graduate Faculty of North Carolina State University
in partial fulfillment of the requirements for the degree of
Master of Science Food Science
Raleigh, North Carolina 2009
APPROVED BY:
_______________________________ ______________________________ E. Allen Foegeding, Ph.D. Mary Anne Drake, Ph.D. Committee Chair
BIOGRAPHY
ACKNOWLEDGEMENTS
I would like to thank Dairy Management Inc. and the Southeast Dairy Foods Research Center for providing funding and support for the completion of this research. I would also like to thank Dr. E. Allen Foegeding for providing the opportunity to work on this project. I have learned a lot from Dr. Foegeding over the years, and appreciate all the
support he has given me. He has always been patient with me and was willing to explain something I didn’t understand or help correct my writing when needed. I know the skills he has taught me will prove to be valuable for years to come.
I want to extend my gratitude to the members of my committee, who have helped throughout these past years. Dr. Mary Anne Drake, who was always willing to give me a few minutes even if she was buried in work, thank you so much, especially for all the help with statistics, which I never could have finished without your time and patience. Dr. Chris Daubert, who helped me learn rheology, without your class and our office visits, I don’t think I ever would have be able to finish my research.
I would also like to thank the whole Foegeding lab group, you guys have be great to work with, especially my office mates Tristan and Mallory, who always have an interesting conversation to be a part of. A special thanks to Paige who makes our lab function and can get you anything if you ask nicely, and send an email.
special thanks to my friends, Tyler and Josiah, who always made coming home an adventure. Between the two of them there was always some crazy plan, or project, thanks guys.
TABLE OF CONTENTS
LIST OF TABLES... viii
LIST OF FIGURES... xi
1. Review of Literature ... 1
Introduction... 2
Cheese Production... 2
Cheddar Cheese... 4
Low and Reduced Fat Cheeses... 5
Cheese Texture... 6
Sensory Measurement of Texture in Cheese... 9
Rheological Measurement of Texture... 12
SMALL STRAIN RHEOLOGY... 14
Large Strain Fracture Rheology... 17
Pressure Sensitive Adhesion... 19
Sensory and Rheology Correlation... 20
Conclusion... 22
References... 24
2. The Effect of Aging on Low, Reduced, and Full Fat Cheddar Cheese Texture ... 36
Introduction... 37
Materials and Methods... 39
Rheological Analysis... 40
Sensory Analysis... 44
Statistical Analysis... 45
Results and Discussion... 45
Descriptive Sensory Analysis... 45
Viscoelastic properties... 48
Fracture and non-linear properties... 50
Conclusion... 56
References... 58
3. Determining the Effect of Fat Content on Cheddar Cheese During the First Three Months of Aging ... 80
Introduction... 81
MATERIALS AND METHODS... 84
Cheddar Cheese Production... 84
Sensory Analysis... 85
Rheological Analysis... 85
Statisical Analysis... 87
Results and Discussion... 87
Proximate Analysis... 87
Descriptive Sensory Analysis... 88
Viscoelastic properties... 91
LIST OF TABLES
Table 1-1. ADSA Scorecard Cheese Texture Terms (Drake et al., 1999a) ... 32
Table 1-2. Descriptive sensory texture lexicon for cheese (Brown et al., 2003). ... 33
Table 2-1. Descriptive sensory lexicon used for texture analysis on a 15 point scale
anchored on the left by the term “not” and on the right by term “very.”... 62
Table 2-2. Main effects (age and fat) and interaction (combined age and fat) for sensory texture attributes hand firmness (HFirm), hand springiness (HSpring), hand rate of recovery (HRecov), first bite firmness (MFirm), first bite fracturability (Frac), degree of breakdown (Deg Break), cohesiveness (Cohes), adhesiveness (Adhes), smoothness of mass (Smooth of mass), and residual smoothness of mouth coating (smooth of mouth) of Cheddar cheese. ... 63
Table 2-3. Proximate analysis data for Cheddar cheeses of varying fat contents... 64
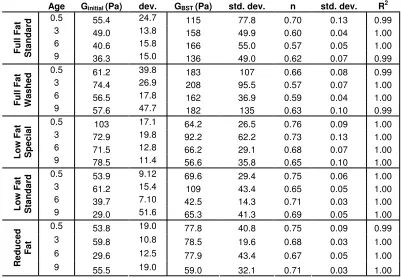
Table 2-4. Non-linear curve fitting to the GBST equation, and calculation of the initial slope (Ginitial) of the non-linear curve for full fat standard, full fat washed, low fat special, low fat standard, and reduced fat Cheddar cheese. ... 65
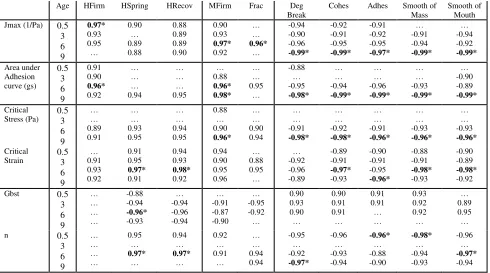
Table 2-6. Correlation values for torsional fracture at strain rates of 0.04, 0.4 and 4.0 1/s with Sensory texture terms of hand firmness (HFirm), hand springiness (HSpring), hand rate of recovery (HRecov), first bite firmness (MFirm), first bite fracturability (Frac), degree of breakdown (Deg Break), cohesiveness (Cohes), adhesiveness (Adhes), smoothness of mass (Smooth of mass), and residual smoothness of mouth coating (smooth of mouth) broke down by months of aging... 67
Table 3-1. Proximate analysis data conducted at Utah State University for Cheddar cheeses. ... 103
Table 3-2. Main effects and interactions for sensory texture attributes hand firmness (HFirm), hand springiness (HSpring), hand rate of recovery (HRecov), first bite firmness (MFirm), first bite fractuarbility (Frac), degree of breakdown (Deg Break), cohesiveness (Cohes), adhesiveness (Adhes), smoothness of mass (Smooth of mass), and residual
smoothness of mouth coating (Smooth of Mouth) of Cheddar cheese. ... 104
Table 3-3. Correlation values for fracture stress, strain, and modulus, critical stress and strain, and modulus (G′), loss modulus (G″), and complex modulus (G*) at 0.01 Hz with descriptive sensory terms of hand firmness (HFirm), hand springiness (HSpring), hand rate of recovery (HRecov), first bite firmness (MFirm), first bite fracturability (Frac), degree of breakdown (Deg Break), cohesiveness (Cohes), adhesiveness (Adhes), smoothness of mass (Smooth of mass), and residual smoothness of mouth coating (smooth of mouth) broke down by weeks of aging. ... 105
(HFirm), hand springiness (HSpring), hand rate of recovery (HRecov), first bite firmness (MFirm), first bite fracturability (Frac), degree of breakdown (Deg Break), cohesiveness (Cohes), adhesiveness (Adhes), smoothness of mass (Smooth of mass), and residual
LIST OF FIGURES
Figure 1-1. Creep/Recovery test curve with Burgers model... 34
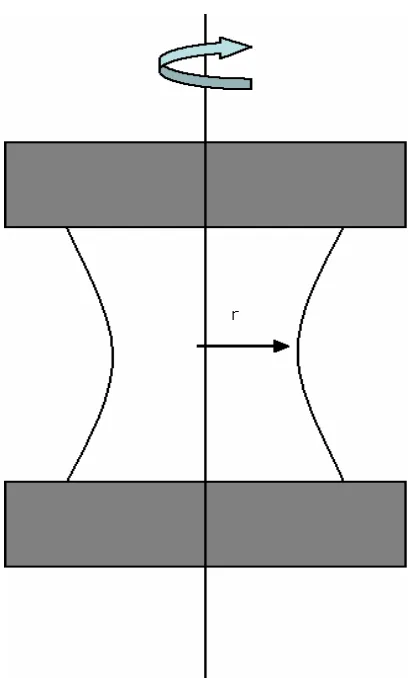
Figure 1-2. Torsion sample (Capstan)... 35
Figure 2-1. Descriptive Sensory analysis of lexicon terms fracturability (a), hand firmness (b), and first bite mouth firmness (c). Error bars represent the standard error of the mean. . 68
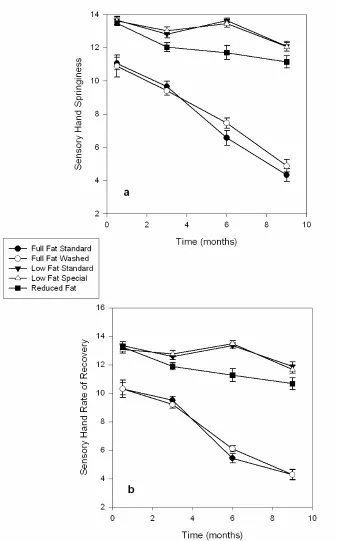
Figure 2-2. Descriptive Sensory analysis of hand measured lexicon terms springiness (a) and rate of recovery (b). Error bars represent the standard error of the mean. ... 69
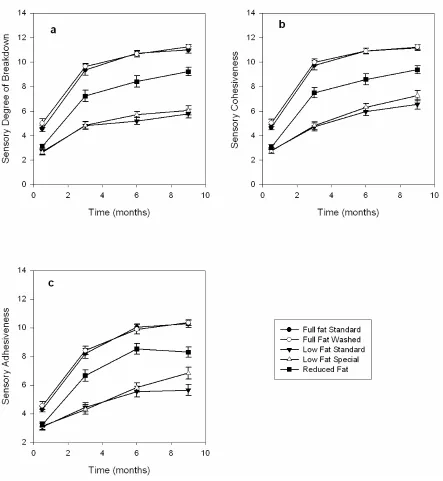
Figure 2-3. Descriptive Sensory analysis of lexicon terms degree of breakdown (a), cohesiveness (b), and adhesiveness (c). Error bars represent the standard error of the mean. ... 70
Figure 2-4. Descriptive Sensory analysis of breakdown lexicon terms smoothness of mass (a) and Smoothness of mouth feel (b). Error bars represent the standard error of the mean. 71
Figure 2-5. Critical Strain (a) and Stress (b) values for stress sweeps conducted at 10 Hz. Error bars represent the standard error of the mean... 72
Figure 2-6. Creep/Recovery test conducted at 150 Pa, results of Jmax (a), percent recovery (b), Jmin (c), and retardation time (d) were calculated. Error bars represent the standard error of the mean... 73
Figure 2-7. Non-linear fracture curves for Cheddar cheeses of varying fat contents at 6 months of age. Curves show every fifth data point improve clarity... 74
Figure 2-8. Actual data and BST equation fit for full fat standard Cheddar cheese at 6
Figure 2-9. Torsional fracture strain (a), stress (b) and modulus (c) for Cheddar cheese tested at a strain rate of 0.41 1/s. Error bars represent the standard error of the mean... 76
Figure 2-10. Rate effects on torsional fracture stress of Cheddar cheese at 0.5 months (a), 3 months (b), 6 months (c), and 9 months (d) of aging. ... 77
Figure 2-11. Rate effects on torsional fracture strain of Cheddar cheese at 0.5 months (a), 3 months (b), 6 months (c), and 9 months (d) of aging. ... 78
Figure 2-12. Area under the adhesion curve for differing fat contents of Cheddar cheese. Error bars represent the standard error of the mean... 79
Figure 3-1. Descriptive sensory analysis of hand firmness (a), mouth firmness (b), and fracturabity (c) for Cheddar cheeses. Error bars represent the standard error of the mean. 107
Figure 3-2. Descriptive sensory analysis of hand measured lexicon terms hand springiness (a) and hand rate of recovery (b) for Cheddar cheese. Error bars represent the standard error of the mean... 108
Figure 3-3. Descriptive sensory analysis of degree of breakdown (a), cohesiveness (b), and adhesiveness (c) for Cheddar cheeses. Error bars represent the standard error of the mean. ... 109
Figure 3-4. Descriptive sensory analysis of smoothness of mass (a) and smoothness of mouth feel for Cheddar cheeses. Error bars represent the standard error of the mean. ... 110
Figure 3-6. Storage modulus (G′) of Cheddar cheeses of various fat contents over a range of frequencies at 25 ºC for 2 weeks (a) and 12 weeks (b) of aging... 112
Figure 3-7. Storage modulus (G′) of Cheddar cheeses of varying fat contents and
temperatures. Values were determined at 1 Hz at 2 weeks (a), 4 weeks (b), 8 weeks (c), and 12 weeks (d) of aging... 113
Figure 3-8. Storage modulus (G′) of Cheddar cheeses with respect to fat (a) and protein content (b) at 10°C and with respect to fat (c) and protein content (d) at 25°C and measured at 1 Hz. ... 114
Figure 3-9. Critical stress (a) and strain (b) values for stress sweeps conducted at 10Hz on Cheddar cheese of various fat contents. Error bars represent the standard error of the mean. ... 115
Figure 3-10. Percent recoverable energy of compression curves of Cheddar cheese at strains of 0.18 (a), 0.22 (b), and 0.26 (c). Error bars represent the standard error of the mean. ... 116
Figure 3-11. Torsional fracture stress (a), strain (b), and modulus (c) determined at 0.41 1/s for Cheddar cheese. Error bars represent the standard error of the mean... 117
1. Review of Literature
N. R. Rogers
Introduction
Cheese in one form or another has existed throughout most of human history.
Archeologists have found evidence to suggest that cheese existed as far back as the Sumerian empire (Scott, 1986). These first cheeses were likely discovered while storing sheep or goats milk in animal stomachs. The acidification of milk due to the naturally present bacteria, combined with the enzymes present in the stomach would result in curds and whey (Fox, 2004). This early form, through years of regional development, has evolved into the diverse spectrum of cheeses found today.
While Europe is where many of the cheeses commonly consumed today originated, the largest cheese producing country is the United States (Fox, 2004). In the U. S., milk product consumption has been consistently increasing over the last thirty years. While products such as whole milk have decreased dramatically in consumption over this time period, the enormous growth in the cheese sector, tripling in availability since 1970, has more than made up the difference. Within the cheese sector, the recent growth of low fat cheese products has renewed interest in the research of low fat cheese for a substitute for the health minded consumer (Wells and Buzby, 2007).
Cheese Production
basic procedure begins with standardization of the ingredient milk by adding skim milk or removing cream (skimming off the top) to adjust the final casein to fat ratio followed by a heat treatment to eliminate unwanted microbial components (Scott, 1986). In modern cheese making, a Lactic Acid Bacteria starter is commonly added to replace the bacteria inactivated by the heat treating of the cheese milk, this bacterial culture is responsible for the
decreasing the pH of the cheese contracting the protein structure more, forcing out more whey. This is followed by the draining off of the whey from the cheese curds (Scott, 1986). Once the cheese reaches its desired pH (approximately 5.2 for Cheddar cheese), salt is added to the cheese to stop the microbial activity in the cheese and prevent the pH from dropping further. This is done through the lowering the water activity of the cheese and thus,
dehydrates the bacterial cells. This also directly effects the resulting texture and flavor of the final cheese by stopping the bacteria present which generate flavor and texture properties (Guinee, 2007). This is followed by a pressing process to allow the curds to begin to fuse together as well drives out any remain liquid whey (Fox, 2004). Variations occur to this process depending on the cheese variety, but the overall process remains very similar.
Cheddar Cheese
and salt is added to stop microbial activity (Scott, 1986). This is followed by pressing of the milled curds into a block for ageing (McSweeney, 2007a). Traditionally, the cheese is pressed for approximately 12-24 hours, this is followed by ageing at 4-10ºC for a minimum of 60 days for a young cheese or 3-6 months for aged examples (United States. Agricultural Research Service. Dairy Products Laboratory. and Sanders, 1969).
Low and Reduced Fat Cheeses
The concept of low and reduced fat cheeses is not a new one, but due to increasing interest in healthy eating, these cheeses have enjoyed renewed interest (Mistry, 2001). A normal full fat cheese has a legally required 30.5% fat minimum to be called Cheddar cheese (Johnson and Chen, 1995). According to the FDA/CFSAN (1999), a reduced fat food must have an overall fat content that is 25% less than the standard product, and to be classified as a low fat product, it must have less than 3g of fat per serving, these classifications allow for the labeling of “reduced fat cheddar cheese” and “low fat cheddar cheese.” Consumer
perception of these low and reduced fat cheeses has not necessarily been positive; often the cheeses have off flavors and a rubbery texture (Mistry, 2001).
increases the casein to fat ratio over that in regular full fat versions, which makes the protein network in the final cheese much stronger and increases the firmness (Johnson and Chen, 1995). To offset this, moisture is added back into cheese using a curd washing step where the curds, after the whey is drained, are washed or soaked again in water to increase their moisture content and remove excess lactose (Scott, 1986). If this excess lactose is not removed, the cheeses can become increasingly acidic, causing undesired sourness. This washing step does have some disadvantages; it is believed that the lack of strong flavors in these cheeses commonly found in full fat varieties is due to this washing step. This
additional moisture can not fully compensate for the fat, and thus reduced and low fat
cheeses are still firmer in texture than their full fat counterparts (Johnson and Chen, 1995).
Cheese Texture
of curd, cooking temperature, and other additional processes affect the moisture content of the curd which affects the texture of the curds and thus the final cheese.
Once the cheese enters the aging stage, the texture of the cheese is primarily affected by how the protein network, composed primarily of casein, is formed and then changed over time. Changes during the aging process involves several biochemical reactions taking place within the cheese, such as proteolysis, lipolysis, and lactose fermentation (Fox, 2004). Lipolysis involves an enzymatic hydrolysis of the triglycerides present in the cheese into fatty acids, which contributes primarily to flavor development of a cheese (Collins et al., 2004). Lactose fermentation contributes slightly during the aging process as residual lactose in the cheese (Cheddar contains 0.8-1% lactose at milling) is converted into lactic acid by the cheese culture present. This conversion is completed at a rate dependant on salt
concentration in the cheese which inhibits the cultures activity (McSweeney and Fox, 2004). This slight pH shift over the initial aging process helps to offset an tendency for a pH
large portion of the αs1 casein is hydrolyzed in the first stage of aging leaving most of the β
casein intact, the second stage involves hydrolysis of the remaining αs1 as well as the breaking down some of the other forms of casein (Lawrence et al., 1987). As these protein bonds are broken, ionic groups are exposed to the remaining moisture in the cheese; this free water is then tied up by the ionic groups. This has the effect of firming up the texture of a cheese and makes small changes in final moisture content to casein important to the final texture of the cheese (Lawrence et al., 1987).
Calcium found in the system is also a major contributor to cheese structure. The calcium in the cheese can either be free or associated with casein, as the cheese ages the percent of calcium present that is associated with casein tends to decrease (Cheddar cheese drops from 64% to 56%), this has the effect of weakening cheese structure over time (Lucey et al., 2003).
attempted to relate this concept to mozzarella cheeses, but neglected to take the temperature effect of the fat in the cheese into account. At a higher temperature (around room
temperature), the fat in cheese is in a liquid form and results in a decrease in firmness as the fat in the cheese increases. At lower temperatures such as refrigeration, the fat tends to become more solid and influences the filled model by making the materials more firm with higher filler fat. Moisture also plays a part in this picture as a higher moisture content in the cheese results in a more deformable material (Visser, 1991).
Sensory Measurement of Texture in Cheese
The ability to characterize the human texture response is a valuable tool in understanding what aspects of texture differentiate cheeses. Many aspects of texture are assessed by the consumer before the material is consumed. Initial appearance of a product (surface sheen, surface geometry), physical sensations from tactile interaction with the product, and auditory response during first bite all provide the consumer with an initial impression of the product texture that can then combine with the actual mastication texture impression to provide an overall texture impression (Wilkinson et al., 2000). Over the years, many terms have been used to describe different aspects of these texture responses, often these terms were vague, contradictory, or redundant. Szczesniak (1963) took commonly used texture terms that had been used previously and grouped them into three classes: mechanical, geometrical which are related visual responses to the product, and other
deal with sensory responses due to applied force either from the mouth or the fingers, are the primary terms that represent the overall texture of a product; this includes such aspects as hardness, cohesiveness, viscosity, elasticity, and adhesiveness along with secondary factors such as brittleness, chewiness, and gumminess (Szczesniak, 1963). Further research by Szczesniak et al (1963) dealt with determining standards for texture terms. It was found that a good standard contained the desired characteristic at the desired intensity and this
characteristic is not overshadowed by other aspects of the standard; it is also important that the material chosen is consistent. Using both standards and defined sensory terms it possible to properly assess the texture of a product form a sensory perspective.
Sensory methods involved in determining overall quality of cheeses have existed for many years; one of the most widely used grading methods was developed by the United States Department of Agriculture (USDA). The texture aspect of this grading system is used, not to differentiate cheeses, but to detect flaws in the cheese. The American Dairy Science Association (ADSA) also maintains a similar ballot used to assess quality of cheeses. This ballot (Table 1) contains terms for both flavor and texture that are considered negative such as bitter and rancid for flavor and crumbly and pasty for texture (Delahunty and Drake, 2004).
flavor profiling method. This method utilizes reference scales and panelist training to establish product references which allows for the distinguishing of minute differences in a specific product (Civille and Szczesniak, 1973). There are several methods available to conduct descriptive analysis, such as the Texture Profile method, the Quantitative
Descriptive Analysis (QDA) method, and the most recent method, the Spectrum method. In all of the methods, a panel must be formed and trained in texture evaluation. While the older Texture Profile method involves using a universal set of sensory terms, the QDA and
Spectrum method both involve panel development of texture terms or lexicon (Kilcast, 2004).
Rheological Measurement of Texture
There has been much work over the years in developing instrumental tests to determine the texture of a food. Many of the tests developed and used early on were
designed to imitate the chewing forces of the mouth; such is the case with one of the original texture instruments developed by Friedman et al (1963). This instrument utilized a plate and a plunger that applies a normal force to the sample once, and then applies the same force again. The response to this test produces two force curves with two separate peaks. Aspects of each curve, such as peak force and area are graphed by using the voltage demand for the motor compressing the sample, the harder the sample is to compress the more voltage is required to do the work. This test evolved into the commonly used Texture Profile Analysis (TPA), which utilizes the same twin compression/decompression cycles but the equipment (Instron testing equipment) allows for compression of the sample at a constant speed as opposed to the original General Foods Texturometer which due to the rotational movement of the instrument plunger changes compression speed depending on the position of the mechanism (Bourne, 2002). The TPA method has often been used to match with sensory texture data (Antoniou et al., 2000, Bryant et al., 1995, Casiraghi et al., 1989, Chen et al., 1979, Drake et al., 1999b, Drake et al., 1999c, Jack et al., 1993a, Jack et al., 1993b, Lee et al., 1978, Xiong et al., 2002), and shown to be highly correlated with sensory texture terms. While there is a high correlation with these empirical type tests, they can be very instrument specific and do not provide fundamental information about the physical properties of the material.
(Foegeding et al., 2003). Early testing of fundamental cheese properties involved using a compression test where the sample was compressed between parallel plates until it fractured; the stress and strain at fracture could then be calculated using equations related to sample geometry changes (Hort et al., 1997, Hort and Grys, 2000). Fracture testing is also performed in torsion utilizing the method developed by Diehl and Hamann (1979). This allows samples to be fractured without any changes in its geometry.
While fracture testing looks at failure of a material, small strain rheological tests are used to look at samples without damaging the structure, making it a non-failure environment. A commonly used example of this is the creep test, which involves applying a force and measuring the deformation of the sample (Foegeding et al., 2003). Tests such as these provide a good insight into to structural properties of a food material.
SMALL STRAIN RHEOLOGY
strain on the sample. This results in a range of stresses that follow a linear pattern followed by a region that deviates from the linear pattern, the point at which the pattern transition is the critical point (Gunasekaran and Ak, 2003). The critical stress and strain of a material is a good indicator of overall strength of material, the longer the linear region (higher critical point) the stronger the material (Steffe, 1996).
Once the linear viscoelastic region is determined, tests can be conducted using a constant stress or strain and varying the frequency, or the rate at which the force oscillates. This test gives insight into how the viscous and elastic components (ideal liquid and ideal solid) are affected as frequency changes, providing a kind of material fingerprint (Steffe, 1996). Frequency sweeps result in four specific values at each frequency tested: G′, G″, G*, and phase angle (δ). The values of G′ (storage modulus) and G” (loss modulus) represent the elastic and viscous components of a material respectively, where the elastic component involves the energy stored and released during each oscillation and the viscous component deals with the energy lost during each oscillation (Foegeding and Drake, 2007). The ratio of the viscous component to the elastic component is represented by the phase angle of the material (δ), this value is a numerical representation of the viscoelastic nature of a material with a phase angle of 0º being fully elastic and 90º being totally viscous (Foegeding et al., 2003). G* is the stress applied divided by the strain measured or vice versa for each oscillation (Foegeding and Drake, 2007).
0 0 *
γ
σ
=
G
Another method commonly used (Kahyaoglu et al., 2005, Nagano and Nishinari, 2001) in food rheology to determine the overall firmness and elasticity of a material is the creep/recovery test. This test involves applying a constant stress to a material and measuring the change in strain over time, the stress is then removed and the amount of recovery of the original shape is measured (Fig. 1) (O'Callaghan and Guinee, 2004). This is often described using Burgers model, this model uses representations of ideal elastic behavior (springs) and ideal viscous components (dashpots). These ideal models are arranged in such a way to represent the materials behavior as a force is applied. In the case of the Burgers model for creep, it is represented by a spring followed by a spring and dashpot in parallel followed by a single dashpot. This model fits well to the first curve (Fig. 1) (force applied) of a creep recovery test, the initial spring compares to the high initial change in J (stress divided by the strain), the parallel spring and dashpot is associated with the decreasing slope in the middle portion of the curve, and the final viscous component represents the final slope of the curve which remains fairly constant (Steffe, 1996).
Creep measurements are reported as compliance (J) at a given time (t), which is related to the deformation of the sample or the strain (γ) at the same time over the constant stress applied (σconstant).
t cons
t t
J
tan
) ( ) (
σ γ
=
can also be calculated, this value is a representation of the viscoelastic nature of a material. This value represents the time taken for a material to reach its maximum strain when the constant stress of the test is applied, in the case of a fully elastic material this time would be zero (Steffe, 1996). Looking at the amount of recovery of a material also relates to the extent of a viscoelastic materials elastic component. A fully elastic material would have 100% recovery of its shape, while a fully viscous material would have 0% recovery (O'Callaghan and Guinee, 2004).
Large Strain Fracture Rheology
The testing instrument then turns the sample at a constant shear rate and measures torque and time. The torque (τ) is then converted to stress (σ) using the equation (Brown et al., 2003, Diehl and Hamann, 1979, Hamann, 1983):
3 min 2 r K π τ σ =
Where K is a shape constant determined by Diehl and Hamann (1979) and rmin is the radius at the smallest point of the capstan shape. Determining the materials true corrected strain (γtrue) at a time point can be determined using the equations (Brown et al., 2003, Diehl and
Hamann, 1979, Hamann, 1983, Nadai, 1937):
Q r K s t 3 min 2
π
φ
γ
= + + + = 2 / 1 2 4 1 2 1 ln t t t trueγ
γ
γ
γ
Where γt represents the sample strain, φs represents the angular deformation of the sample (Brown et al., 2003) and Q is a shape constant determined by Diehl and Hamann (1979).
Pressure Sensitive Adhesion
Adhesion has been described in two forms, fundamental adhesion which relates to forces between two atoms, and practical adhesion, which relates to the force of cling between two surfaces, a combination of these two forms create overall adhesive force (Packham, 2005). An adhesive force called “tack” is a distinguishable resistance to the separation of two materials brought briefly into contact with each other (Aubrey, 2005). Tack response is made up of components related to both chemical and physical properties on the surface of the material, these properties result in weak temporary bonds being formed between the material and the adhering surface. A number of methods have evolved over the years to determine the tack force of materials such as rolling ball tests, peel tests, and probe tests. All of these tests involve measuring energy required to break the adhesive bonds on the surface of the
material. These tests relate to the sensory aspect of feeling the stickiness of a material with a panelists finger (Hammond, 1989). The probe test is the most commonly used of these three for food materials (Childs et al., 2007, Heddleson et al., 1993, Steiner et al., 2003). The probe test looks at how changes in contact time and contact force affect tack bond formation and thus adhesiveness of a material (Hammond, 1989).
sensitive adhesive, it must fulfill certain rheological criteria; the material must be more elastic and resistant to flow; this can be determined by looking at a materials creep/recovery properties (Dahlquist, 1989). Surface energy of the material also plays a major role in the pressure sensitive adhesion of a material which relates to bond formation of the surfaces and thus overall adhesive work (Hammond, 1989).
Sensory and Rheology Correlation
While rheological tests, both empirical and fundamental, provide an excellent insight into the texture of a material, they by no means provides a complete picture of the texture of a cheese. Many rheological tests involve testing one “bite,” however materials change while being broken down in the mouth and thus every time a bite is taken a new material is formed and thus the texture changes. Chewing also involves several factors that are not measured such as temperature changes and saliva interactions in the mouth (Bourne, 1975).
correlated to instrumental terms (Bryant et al., 1995), and adhesiveness varied from study to study being positively correlated in some studies (Bryant et al., 1995) and negatively
correlated in others (Chen et al., 1979). While these tests showed strong correlation between certain terms, the empirical nature means that they have no specific structural meaning. On the other hand, fundamental tests measure properties that can be linked to structural elements (Foegeding et al., 2003).
Fundamental rheological tests, unlike their empirical counterparts are used to assess physical properties in a way in which they can be referred to using basic engineering terminology such as stress and strain (Foegeding et al., 2003). One of the earliest uses of these types of tests on cheese was in compression fracture testing (Green et al., 1985, Hort and Grys, 2000). Xiong et al (2002) found that higher correlations were seen with sensory firmness when samples were compressed to higher percentages (70% and 90% compression), which would be more likely to result in sample fracture rather than the lower compressions found in some TPA tests. Hort et al (1997) found strong relationships between fracture stress and strain for a variety of Cheddar cheeses and several of the sensory terms such as
firmness, cohesiveness, and stickiness in a variety of cheeses. Creep/recovery tests, another small strain fundamental test, has also shown strong correlations between sensory firmness and Jmax, which is related to the maximum deformation of the sample under a constant stress (Brown et al., 2003, Drake et al., 1999c). Brown et al (2003) also found that sensory
adhesiveness was correlated to percent recovery, and fracturability was correlated with retardation time. This study did not find any significant correlations with certain breakdown terms relating to cohesiveness and smoothness, Brown suggests that the lack of correlations is a result of the cannon of rheological tests used are not measuring these sensory sensations (Brown et al., 2003). While many fundamental rheological tests do correlate with sensory terms, they may not correlate as well as the TPA terms that they often replace, but the combination of the correlation along with the knowledge of structural properties provide a more complete picture of a food product (Foegeding et al., 2003).
Conclusion
Determining the differences, both rheological and sensory, of different fat contents of Cheddar cheeses is important in both developing a model for the role of fat in the cheese as well as understanding how those material properties affect the sensory texture. Sensory tests provide a numerical representation of the human response to a texture; this is the best way to understand a food texture from a consumer standpoint. Rheological tests provide an
deficiencies often associated with low and reduced fat cheeses are often textural in nature. Understanding what causes these differences is valuable in being able to change the final texture of a cheese and thus improve the consumer opinion of low and reduced fat cheeses.
References
Antoniou, K. D., D. Petridis, S. Raphaelides, Z. Ben Omar, and R. Kesteloot. 2000. Texture assessment of french cheeses. J. Food Sci. 65(1):168-172.
Aubrey, D. W. 2005. Tack. Pages 527-529 in Handbook of adhesion. 2nd ed. D. E. Packham, ed. John Wiley & Sons, West Sussex, England.
Banks, J. M. 2007. What general factors affect the texture of hard and semi-hard cheeses? Pages 200-201 in Cheese problems solved. P. L. H. McSweeney, ed. Woodhead, Boca Raton. Barrangou, L. M., C. R. Daubert, and E. A. Foegeding. 2006. Textural properties of agarose gels. I. rheological and fracture properties. Food Hydrocolloids 20:184-195.
Blatz, P. J., S. C. Sharda, and N. W. Tschoegl. 1974. Strain energy function for rubberlike materials based on a generalized measure of strain. Transactions of the society of rheology 18(1):145-161.
Bot, A., I. vanAmerongen, R. Groot, N. Hoekstra, and W. Agterof. 1996. Large deformation rheology of gelatin gels. POLYMER GELS AND NETWORKS 4(3):189-227.
Bourne, M. C. 1975. Is rheology enough for food texture measurement? J. of Texture Studies 6:259-262.
Brown, J. A., E. A. Foegeding, C. R. Daubert, M. A. Drake, and M. Gumpertz. 2003. Relationships among rheological and sensorial properties of young cheese. 86(10):3054-3067.
Bryant, A., Z. Ustunol, and J. Steffe. 1995. Texture of cheddar cheese as influenced by fat reduction. J. Food Sci. 60(6):1216-1236.
Carunchia Whetstine, M. E., P. J. Luck, M. A. Drake, E. A. Foegeding, and P. D. Gerard. 2007. Characterization of flavor and texture development within large (291 kg) blocks of cheddar cheese. J. of Dairy Sci. 90(7):3091-3109.
Casiraghi, E., M. Lucisano, and C. Pompei. 1989. Correlation among instrumental texture, sensory texture and chemical composition of five italian cheeses. Italian journal of food science 1(1):53-64.
Chen, A., J. Larkin, C. Clark, and W. Irwin. 1979. Textural analysis of cheese. J. of Dairy Sci. 62(6):901-907.
Childs, J. L., C. R. Daubert, L. Stefanski, and E. A. Foegeding. 2007. Factors regulating cheese shreddability. J. Dairy Sci. 90:2163-2174.
Civille, G. V. and A. S. Szczesniak. 1973. Guidelines to training a texture profile panel. J. of Texture Studies 4:204-223.
Collins, Y. F., P. L. H. McSweeney, and M. G. Wilkinson. 2004. Lipolysis and catabolism of fatty acids in cheese. Pages 373-389 in Cheese: Chemistry, physics and microbiology. Vol. 1. 3rd ed. P. F. Fox, P. L. H. McSweeney, T. M. Cogan, and T. P. Guinee, ed. Elsevier,
Dahlquist, C. A. 1989. Creep. Pages 97-114 in Handbook of pressure sensitive adhesive technology. 2nd ed. D. Satas, ed. Van Nostrand Reinhold, New York.
Delahunty, C. M. and M. A. Drake. 2004. Sensory character of cheese and its evaluation. Pages 455-487 in Cheese: Chemistry, Physics and Microbiology. 3rd ed. P. F. Fox, P. L. H. McSweeny, T. M. Cogan, and T. P. Guinee, ed. Elsevier, Amsterdam.
Diehl, K. C. and D. D. Hamann. 1979. Structural failure in selected raw fruits and vegetables. Journal of Texture Studies 10:371-400.
Drake, M., P. Gerard, and G. Civille. 1999a. Ability of hand evaluation versus mouth evaluation to differentiate texture of cheese. JOURNAL OF SENSORY STUDIES 14(4):425-441.
Drake, M. A., P. D. Gerard, V. D. Troung, and C. R. Daubert. 1999b. Relationship between instrumental and sensory measurements of cheese texture. J. of Texture Studies 30:451-476. Drake, M. A., V. D. Truong, and C. R. Daubert. 1999c. Rheological and sensory properties of reduced-fat processed cheeses containing lecithin. J. Food Sci. 64(4):744-747.
FDA/CFSAN. 1999. FDA backgrounder: the food label. Vol. 2008. US Department of Health and Huamn Services.
Foegeding, E. A., J. Brown, M. A. Drake, and C. R. Daubert. 2003. Sensory and mechanical aspects of cheese texture. International Dairy Journal 13:585-591.
Foegeding, E. A. and M. A. Drake. 2007. Sensory and mechanical properties of cheese texture. J. of Dairy Sci. 90(4):1611-1624.
Friedman, H. H., J. E. Whitney, and A. S. Szczesniak. 1963. The texturometer-a new instrument for objective texture measurement. J. Food Sci. 28:390-396.
Green, M. L., R. J. Marshall, and B. E. Brooker. 1985. Instrumental and sensory texture assessment and fracture mechanisms of cheddar and cheshire cheeses. J. of Texture Studies 16:351-364.
Green, M. L., A. Turvey, and D. G. Hobbs. 1981. Development of structure and texture in cheddar cheese. J. of Dairy Research 48:343-355.
Guinee, T. P. 2007. Salt in cheese. Pages 80-81 in Cheese problems solved. P. L. H. McSweeney, ed. Woodhead, Boca Raton.
Gunasekaran, S. and M. M. Ak. 2003. Cheese rheology and texture. CRC Press, Boca Raton. Gwartney, E. A., E. A. Foegeding, and D. K. Larick. 2002. The texture of commercial full-fat and reduced-fat cheese. J. Food Sci. 67(2):812-816.
Hamann, D. D. 1983. Structural failure in solid foods. Pages 351-383 in Physical properties of foods. M. Peleg and E. B. Bagley, ed. AVI, Westport, Connecticut.
Hammond, F. H. 1989. Tack. Pages 38-60 in Handbook of pressure sensitive adhesive technology. 2nd ed. D. Satas, ed. Van Nostrand Reinhold, New York.
Heddleson, S. S., D. D. Hamann, and D. R. Lineback. 1993. The Dahlquist criterion: applicability of a rheological criterion to the loss of pressure-sensitive tack in flour-water dough. Cereal Chem. 70(6):744-748.
Hort, J., G. Grys, and J. Woodman. 1997. The relationships between the chemical, rheological and textural properties of cheddar cheese. Lait 77:587-600.
Hort, J. and G. L. Grys. 2000. Rheological models of cheddar cheese texture and their application to maturation. J. of Texture Studies 31:1-24.
Jack, F. R., A. Paterson, and J. R. Piggott. 1993a. Relationships between rheology and composition of cheddar cheese and texture as perceived by consumers. International journal of food science and technology 28:293-302.
Jack, F. R., J. R. Piggott, and A. Paterson. 1993b. Relationships between electromyography, sensory and instrumental measures of cheddar cheese texture. J. Food Sci. 58(6):1313-1317. Johnson, M. E. and C. M. Chen. 1995. Technology of manufacturing reduced-fat cheddar cheese. Pages 331-337 in Chemistry of structure-function relationships in cheese. E. L. Malin and M. H. Tunick, ed. Plenum press, New York.
Kahyaoglu, T., S. Kaya, and A. Kaya. 2005. Effects of fat reduction and curd dipping
temperature on viscoelasticity, texture and appearance of gaziantep cheese. Food science and technology international 11(3):191-198.
Kilcast, D. 2004. Measuring consumer perceptions of texture: an overview. Pages 1-32 in Texture in food: solid foods. Vol. 2. D. Kilcast, ed. CRC Press, Boca Raton.
Lawrence, R. C., L. K. Creamer, and J. Gilles. 1987. Texture development during cheese ripening. J. of Dairy Sci. 70(8):1748-1760.
Lucey, J. A., M. E. Johnson, and D. S. Horne. 2003. Perspectives on the basis of the rheology and texture properties of cheese. J. of Dairy Sci. 86(9):2725-2743.
McSweeney, P. L. H. 2007a. Cheddar cheese: introduction. Pages 214-216 in Cheese problems solved. Woodhead, Boca Raton.
McSweeney, P. L. H. 2007b. Conversion of milk to curd. Pages 50-51 in Cheese problems solved. P. L. H. McSweeney, ed. Woodhead, Boca Raton.
McSweeney, P. L. H. and P. F. Fox. 2004. Metabolism of residual lactose and of lactate and citrate. Pages 361-371 in Cheese: Chemistry, physics and microbiology. Vol. 1. 3rd ed. P. F. Fox, P. L. H. McSweeney, T. M. Cogan, and T. P. Guinee, ed. Elsevier, Amsterdam.
Mistry, V. 2001. Low fat cheese technology. INTERNATIONAL DAIRY JOURNAL 11(4-7):413-422.
Mistry, V. V. and D. L. Anderson. 1993. Composition and microstructure of commercial full-fat and low-full-fat cheeses. Food Structure 12:259-266.
Nadai, A. 1937. Plastic behavior of metals in the strain-hardening range part I. JOURNAL OF APPLIED PHYSICS 8(3):205-213.
Nagano, T. and K. Nishinari. 2001. Rheological studies on commercial egg white using creep and compression measurements. Food Hydrocolloids 15:415-421.
O'Callaghan, D. J. and T. P. Guinee. 2004. Rheology and texture of cheese. Pages 511-540 in Cheese: chemistry, physics and microbiology. 3rd ed. P. F. Fox, P. L. McSweeney, T. M. Cogan, and T. P. Guinee, ed. Elsevier, Amsterdam ; Boston.
Rudan, M. A., D. M. Barbano, J. J. Yun, and P. S. Kindstedt. 1999. Effect of fat reduction on chemical composition, proteolysis, functionality, and yield of mozzarella cheese. J. of Dairy Sci. 82(4):661-672.
Scott, R. 1986. Cheesemaking practice. 2nd ed. Elsevier Applied Science Publishers ; sole distributor in the USA and Canada, Elsevier Science Pub. Co., London ; New York New York, NY, USA.
Steffe, J. F. 1996. Rheological methods in food process engineering. Freeman press, East Lansing, MI.
Steiner, A. E., E. A. Foegeding, and M. Drake. 2003. Descriptive analysis of caramel texture. Journal of sensory studies 18:277-289.
Szczesniak, A. S. 1963. Classification of textural characteristics. Journal of food science 28:385-389.
Szczesniak, A. S., M. A. Brandt, and H. H. Friedman. 1963. Development of standard rating scales for mechanical parameters of texture and correlation between the objective and the sensory methods of texture evaluation. J. Food Sci. 28:397-403.
Visser, J. 1991. Factors affecting the rheological and fracture properties of hard and semi-hard cheese. Pages 49-61 in Rheological and fracture properties of cheese. P. Walstra, ed. International Dairy Federation, Brussels, Belgium.
Wells, H. F. and J. C. Buzby. 2007. Americans' Dairy Consumption Below Recommendations. in Amberwaves. USDA/ERS.
Wilkinson, C., G. B. Dijksterhuis, and M. Minekus. 2000. From food structure to texture. Trends in food science & technology 11:442-450.
Table 1-1. ADSA Scorecard Cheese Texture Terms (Drake et al., 1999a)
Term Description
Corky Described as dry, hard, or tough. When worked, the cheese plug
may have a rubber-like consistency and a smooth silky texture is lacking. When worked, the cheese tends to curl up under the
thumb and is distributed in irregular patches.
Crumbly Described as friable. A crumbly cheese falls apart when sliced
and a plug of such a cheese will be extremely friable.
Curdy Described as rubbery. The cheese plug will resist finger
pressure. Cheese, when pressed will have a tendency to spring back to original shape. Curdy cheeses are usually firm.
Mealy When worked, the cheese will feel like cornmeal and will spread
in irregular patches under the thumb.
Pasty Upon working, the cheese will break down easily into a sticky
mass which easily sticks to the fingers.
Short Also described as flaky. The cheese will show a distinct lack of
elasticity and may be associated with a lack of homogeneity. The cheese consistency may appear loose-knit.
Weak Also described as soft. A small amount of finger pressure will
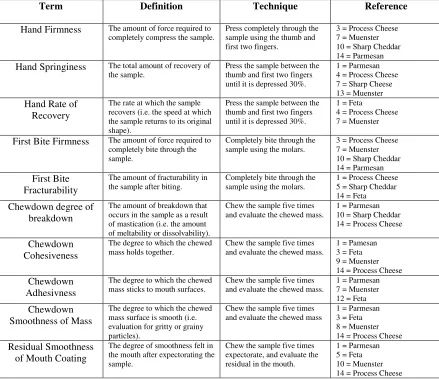
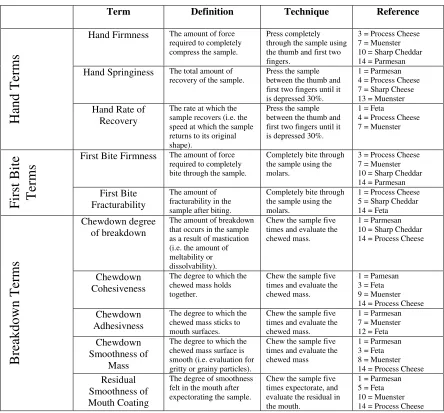
Table 1-2. Descriptive sensory texture lexicon for cheese (Brown et al., 2003).
Term Definition Technique Reference
Hand Firmness The amount of force required to
completely compress the sample.
Press completely through the sample using the thumb and first two fingers.
3 = Process Cheese 7 = Muenster 10 = Sharp Cheddar 14 = Parmesan
Hand Springiness The total amount of recovery of
the sample.
Press the sample between the thumb and first two fingers until it is depressed 30%.
1 = Parmesan 4 = Process Cheese 7 = Sharp Cheese 13 = Muenster
Hand Rate of Recovery
The rate at which the sample recovers (i.e. the speed at which the sample returns to its original shape).
Press the sample between the thumb and first two fingers until it is depressed 30%.
1 = Feta
4 = Process Cheese 7 = Muenster
First Bite Firmness The amount of force required to
completely bite through the sample.
Completely bite through the sample using the molars.
3 = Process Cheese 7 = Muenster 10 = Sharp Cheddar 14 = Parmesan
First Bite Fracturability
The amount of fracturability in the sample after biting.
Completely bite through the sample using the molars.
1 = Process Cheese 5 = Sharp Cheddar 14 = Feta
Chewdown degree of breakdown
The amount of breakdown that occurs in the sample as a result of mastication (i.e. the amount of meltability or dissolvability).
Chew the sample five times and evaluate the chewed mass.
1 = Parmesan 10 = Sharp Cheddar 14 = Process Cheese
Chewdown Cohesiveness
The degree to which the chewed mass holds together.
Chew the sample five times and evaluate the chewed mass.
1 = Pamesan 3 = Feta 9 = Muenster 14 = Process Cheese
Chewdown Adhesivness
The degree to which the chewed mass sticks to mouth surfaces.
Chew the sample five times and evaluate the chewed mass.
1 = Parmesan 7 = Muenster 12 = Feta
Chewdown Smoothness of Mass
The degree to which the chewed mass surface is smooth (i.e. evaluation for gritty or grainy particles).
Chew the sample five times and evaluate the chewed mass
1 = Parmesan 3 = Feta 8 = Muenster 14 = Process Cheese
Residual Smoothness of Mouth Coating
The degree of smoothness felt in the mouth after expectorating the sample.
Chew the sample five times expectorate, and evaluate the residual in the mouth.
2. The Effect of Aging on Low, Reduced, and Full Fat Cheddar Cheese Texture
N. R. Rogers, E. A. Foegeding, M.A. Drake
Introduction
Cheese is a very popular food in the United States; the cheese industry has
experienced rapid growth with product availability tripling since 1970 (Wells and Buzby, 2007). Trends towards healthier eating have provided an increased interest in low fat cheeses. However, consumer perception of low and reduced fat cheese has not necessarily been positive as these cheeses often have off flavors, different appearance, and rubbery texture (Mistry, 2001).
Lower fat cheeses are made from lower fat milks and thus have higher protein to fat ratios than full fat cheeses; this causes the lower fat cheeses to have a more dense protein networks and thus are more firm. To try to compensate for the increased protein
concentration, water is added back into the cheeses to offset some of the fat but the texture is still firmer than full fat cheeses (Johnson and Chen, 1995). Water addition is done through a curd washing step in the processing of the cheese, which involves the curds being washed or soaked in water after the whey draining step (Scott, 1986).
in the cheese also has an effect on texture as the proteolysis takes place, as the bonds are broken the ionic groups are exposed and tie up the free water in the cheese, increasing cheese firmness.
The ability to characterize human texture response is a valuable tool in understanding what aspects of texture differentiate cheese. Utilization of descriptive sensory panels and texture terminology (lexicon) specifically designed for cheese have been used in the past to probe the texture of many varieties of cheese (Brown et al., 2003, Carunchia Whetstine et al., 2007, Drake et al., 1999a, Yates and Drake, 2007). This sensory testing looks at several aspects of cheese texture including tactile, first bite, and breakdown during chewing. The use of a consistent descriptive lexicon of terms provides a “textural fingerprint” for a cheese that can be compared to other cheeses analyzed with the same lexicon and standards.
While sensory evaluation is the main method for determining perception of cheese texture, in order to better understand why these texture differences exist, fundamental rheological tests are needed to probe the cheese structure. The earliest measurements of these properties determined fracture stress and strain under compression (normal force) (Hort et al., 1997, Hort and Grys, 2000). Tests that apply a normal (compressive) force to cause fracture correlate well with sensory lexicon terms related to firmness. Tests have also been conducted in torsion, where the sample is twisted rather than compressed until fracture (Diehl and Hamann, 1979). Torsion testing correlates with sensory springiness and firmness
nature of a material. Small strain rheological tests can achieve this goal. Small strain tests are conducted within the linear viscoelastic region (LVR). This means that material properties such as the storage modulus (G′ or measure of the energy stored by elastic
component) and the loss modulus (G″ or the energy dissipated by the viscous component) are not dependant on level of stress or strain (Steffe, 1996). These small strain terms have been shown to correlate well with certain sensory term relating to the breakdown of the cheese during mastication as well as the firmness of both hand evaluation and during the first bite of the sample (Brown et al., 2003, Drake et al., 1999b).
The purpose of this study was to determine how cheeses with differing contents of fat are affected by aging. This is part of a multi-university investigation looking at low fat cheese. Manufacturing and chemical analysis was conducted at Utah State University. The specific goals of this research were to determine the sensory and rheological differences between Cheddar cheeses at different fat contents as they age, and to see how these differences are related to the structure of the cheeses.
Materials and Methods
Cheddar Cheese Production
Five Cheddar cheeses were produced with differing fat contents at the Utah State University Dairy Plant. Two cheeses were produced with a target fat content of 32%; one of these cheeses was made using the standard stirred curd method and referred to as the full fat
identified as full fat washed. Three more cheeses were made using the same stirred/washed curd method, a cheese with a target fat content of 16% identified as reduced fat and two cheeses with target fat content of 6%, one being identified as low fat standard and the other being identified as low fat special which used a different cheese culture than the other cheeses. Two replications of each cheese were produced for this study.
The cheeses were kept at Utah State University for aging at 8ºC for 9 months. Sample blocks were shipped to North Carolina State University at 2 weeks, 3 months, 6 months, and 9 months of age for texture testing.
Rheological Analysis
Determination of the Linear Viscoelastic Region. Stress sweeps of cheeses were done using
a Stress Tech controlled stress rheometer (ATS Rheosystems, Bordentown, NJ) fitted with a 20 mm smooth parallel plate geometry. Temperature was controlled using an integrated, induction heating device set at 25ºC. Cheese samples were cut 4 mm thick, and trimmed to the size of the plate. Samples were glued to both plates to prevent slipping using
Creep/Recovery Analysis. Creep/Recovery tests were conducted using a Stress Tech controlled stress rheometer (ATS Rheosystems, Bordentown, NJ) as described above. Tests were conducted at 100 Pa and 150 Pa, which were determined to maintain the strain within the linear viscoelastic region. Forces were applied to the sample for 200 seconds, removed, and the recovery of the sample was measured for an additional 200 seconds. Tests at each force were conducted twice for each replication. The values of maximum compliance (Jmax), instantaneous compliance (J0), retardation time (λret), and percent recovery (crp) were
determined from the creep/recovery data. Maximum compliance was the maximum compliance reached before the force was removed. Instantaneous compliance was the compliance as time approached zero. Retardation time was calculated as the time it takes for the strain to reach 63.2% of its final value. The percent recovery was calculated using the equation:
max max) ( ) (
J J J
crp= − r
(Eq. 1)
Where Jmax is the maximum compliance and Jr is the compliance after the sample has been allowed to fully recovered (Brown et al., 2003).
Large Strain Torsion analysis. Non-linear and fracture analysis were conducted using the
Rocky Hill, CT). Samples were then ground into a capstan shape using a precision grinding machine (Model GCPM92 US, Gel Consultants. Raleigh, NC). Samples were tested using a Haake VT-550 rotational viscometer (Gerbruder Haake GmbH, Karlsruhe, Germany) fitted with an attachment designed to facilitate torsion testing (Truong and Daubert, 2000), five samples were tested for each replication at three strain rates, 0.045, 0.45, and 4.5 s-1.
The torsion test measured torque and time for materials until they fractured. The point at which the material fractured was determined as the point (torque and time) where the torque values began to decrease. These values were used to calculate shear stress (σ) and true shear strain (γtrue) using the following equations (Diehl and Hamann, 1979, Hamann, 1983, Nadai, 1937).
3 min 2 r KM
π
σ
= (Eq. 2)Q r K t 3 min 2
π
φ
γ
= (Eq. 3) + + + = 2 / 1 2 2 4 1 2 1 ln t t t true
γ
γ
γ
γ
(Eq. 4)(φ) and a curvature section constant (8.45x10⁻⁶ m-3) Q (Diehl and Hamann, 1979, Nadai,
1937). Fracture modulus (Gf) was calculated using the shear stress and strain at the fracture point (Brown et al., 2003).
true f
G
γ σ
= (Eq. 5)
The nonlinear region of the fracture curves was analyzed using a nonlinear curve fitting technique using the BST model proposed by Blatz et al (1974),
(
n n)
BST n
G −
−
= λ λ
σ 2 (Eq. 6)
(
)
2 41/2 2 +
+ =
γ
γ
λ
(Eq. 7)Instrumental Adhesion Testing. Instrumental surface adhesion of the cheese was conducted using a Brookfield LFRA texture analyzer (Brookfield Engineering, Middleboro, MA) with an attached dental composite probe with a circular contact surface 12.5 mm in diameter utilizing a method modified from Steiner et al (2003). Cheese samples were cut, to provide a fresh surface for adhesion, into cubes of 17 mm x 17 mm x 17 mm. Tests were conducted with a probe speed of 0.1 mm/s, samples were loaded with a force of 200 g and this force was held on the sample for 5 seconds, and then the force was removed at the same rate. Five samples from each replication were tested. Peak adhesion and area under the adhesion curve were calculated for each sample by taking the absolute value of all force values less than zero, these values were then integrated using Simpson’s rule.
Sensory Analysis
cheeses were made available for each session. Samples were evaluated in triplicate for each replication.
Statistical Analysis
All statistical analysis was conducted using SAS statistical software (version 9.1, SAS Institute Inc., Cary, NC). Sensory data was analyzed for variance using a mixed model (PROC MIXED). This model looked at effects due to aging, fat content, and combined effects from the two variables. Relationships between sensory terms and rheological values were determined using correlation analysis (PROC CORR).
Results and Discussion
Descriptive Sensory Analysis
Main Effects and Interactions for Sensory Results. Mixed model statistical analysis for
Descriptive Sensory Terms. Results from the sensory testing of the cheese were grouped into three categories based on rheological considerations; these groupings are supported by correlations between sensory and mechanical terms shown by Brown et al (2003). Sensory terms for firmness, both hand evaluated (Fig. 1b) and first bite (Fig. 1a), as well as
fracturability (Fig. 1c), were grouped together because they all were evaluated during the initial deformation to fracture. These terms all show similar changes as the cheese aged, with a high initial decrease between 0.5 and 3 months, followed by a more gradual decrease. This decrease in firmness is expected as the proteolysis that occurs during the aging of cheese has been shown to decrease firmness (Tunick et al., 1990). The higher initial change in firmness terms between 0.5 and 3 months has been attributed to the higher rate of proteolysis known to exist during the first 14 days of aging (Lawrence et al., 1987). These differences were not seen consistently in all of the cheeses for this study, with the full fat cheeses showing this behavior and the low and reduced fat cheeses showing a steady decrease across all time points.
other hand, lost much of their initial springiness consistently as they aged. The reduced fat cheese showed behavior in between the two extremes. This clearly points to structural differences in the protein-fat network due to level of fat. Reducing fat in the cheese resulted in an increase in total protein (protein, water and water-soluble compounds) (Table 3); however, it did not cause any differences in protein network composition. This can be described using the filled gel model, where the filler (fat) in the cheese is being removed and thus replaced by more network. This creates a more homogeneous and connected network in the lower fat cheeses with less weak points caused by the fat. This more connective structure caused the lower fat cheeses to have higher initial springiness and recovery and, over time, could reduce the effect of proteolysis on the texture.
Sensory terms degree of breakdown (Fig. 3a), cohesiveness (Fig. 3b), adhesiveness (Fig. 3c), smoothness of mass (Fig. 4a), and smoothness of mouth feel (Fig. 4b) have been grouped together as the show similar trends and are correlated with each other (Brown et al., 2003, Drake et al., 1999a). The breakdown terms, which are evaluated after several chewing cycles, showed similar separations based on fat content as the other sensory terms, with the full fat and the low fat cheeses being very similar and the reduced fat in between the two. All cheeses showed the same high initial change between 0.5 and 3 months followed by a
interrelated as the degree of breakdown of a material determines the particle size distribution, and particle size is related to cohesiveness, adhesiveness, and the coating left in the mouth. Higher adhesiveness results in greater mouth coating, as the cheeses have higher cohesive properties and thus stick together more forming a smoother surface of the chewed mass which translates to smoothness of mouth coating (Brown et al., 2003).
Overall, low fat Cheddar cheeses did not change as much over a 9 month period as compared to full fat cheeses. The textures of low fat cheeses were firm and springy initially and did not loose springiness over time as compared to the full fat cheeses. In addition, full fat cheeses broke down more as they aged becoming more cohesive and adhesive than the low fat cheeses. These results provide valuable insight into how the cheeses vary, but to understand why these differences exist, structural analysis through rheological measurements were also conducted.
Viscoelastic properties
Stress Sweeps. Critical strain (Fig. 5a) and stress (Fig. 5b) values from linear viscoelastic
had lower critical stress and strain and thus a shorter linear viscoelastic region than the lower fat cheeses. This means that the full fat cheeses structure broke down at a lower force and deformation making them weaker than their low and reduced fat counterparts. These tests are likely probing when the structure of the protein network begins to breakdown. This coming apart translates into a critical stress and strain at which the cheese begins to break the weak bonds holding the protein network together. The full fat cheeses showed no real changes in critical point values as they aged. The low and reduced fat cheeses showed no general trends over aging times with no real change in critical values at 0.5 and 9 months. Higher fat cheeses are dominated by the higher fat to protein ratio and thus the measurement of the protein network is consistently lower and less prone to change over time. The more a protein network dominates a material, the greater effect hydrolysis has on this network and thus as the protein network is broken down, the structure becomes more deformable, and values for critical stress and strain increase.
Creep/Recovery. While the stress sweep looks at material responses on a very small time
Jmax, differentiating the full fat and the low fat cheeses and showing the same low fat aging effects. The reduced fat cheese behavior appears to follow the full fat behavior in both compliance terms. This indicates that within the linear region, the cheese network structure behaves in a very similar fashion as the full fat cheeses and that the fat is present in sufficient quantities in the material as to properly emulate the behavior of the higher fat cheese.
Percent recovery (Fig. 6b) and retardation time (Fig. 6d) did not show any significant difference in either age or fat content.
Fracture and non-linear properties
Non-linear curve fitting. Data for mathematical curve fitting utilizing the BST model and
8). The mathematical representation of these shapes is represented by the shape factor
constant (n) in the BST model. These n values share the same trends as the GBST values, with low and reduced fat cheese showing slightly higher values than the full fat cheeses. A value of n=2 is considered an ideal elastic material, thus deviation from this gives an idea to the relative elasticity of a material with a value lower than two being less elastic and thus more viscous in behavior (Barrangou et al., 2006a). This means that the low and reduced fat cheeses with their higher n values are more rubbery and elastic in texture than their full fat counterparts. The shape of the curves (Fig. 7) reveals a strain weakening behavior of all of the cheeses.
Torsional fracture. Fracture stress, strain, and modulus (determined at 0.41 1/s) are
represents the combination of the stress and strain terms and thus provides one term that can relate the data from both. This data fit the sensory firmness well with a good inverse
relationship.
Many studies have been conducted looking at ideal materials such as gelatin and agarose and how their structure is related to sensory properties. In the case of agarose, torsional fracture was conducted along with small strain tests and it was found that these fracture terms were more related to the assessed sensory terms than the small strain data (Barrangou et al., 2006b). These relationships can not be expected at the same level for cheeses. Under normal conditions, weak spots or cracks in the material are present; in ideal gels such as agarose these cracks are few and small but still contribute to the failure of a material (van Vliet and Walstra, 1995). In the case of cheese however, these cracks and imperfections are much larger and more numerous, affecting the way the material fractures. Thus, comparing and applying sensory information on structure gleaned from polymer gel models to cheese structure is not always consistent. Because of this, it is important to understand not only why the simpler, ideal, systems work, but also to understand how more complex structures, such as cheese, behave.