ISSN(Online): 2320-9801
ISSN (Print) : 2320-9798
I
nternational
J
ournal of
I
nnovative
R
esearch in
C
omputer
and
C
ommunication
E
ngineering
(An ISO 3297: 2007 Certified Organization)
Vol. 4, Issue 3, March 2016
Plant Classification with Pollen Characters
using Neural Network
Shraddha Dasharathrao Gadge1, Vijay.L.Agrawal2
PG Student, Dept. of E&T C, HVPM’S College of Eng in eering and Technology Amravati, India
Associate Profess or, Dept. of E&T C, HVPM’S College of Engineering and Technology Amravati, India
ABSTRACT: In this paper a new classification algorithm is for the Plant Classification with Pollen Characters using Neural Network. In order to develop algorithm 30 SEM images of Plants pollen have been considered consisting diffrent-diffrent plant pollen SEM(Scanning Electron microscope) images. With a vie w to extract features from the SEM images after image processing, an algorithm proposes (FFT) Fast Fourier Transform domain coefficients . The Efficient classifiers based on Generalized feed-forward (GFF) Neural Network. A separate Cros s - Va lidation dataset is used for proper evaluation of the proposed class fiction algorithm with respect to important performance measures , Such as MSE and classification accuracy. The Average Classification Accuracy of GFF Neural Network comprising of one hidden layers with 3 7 PE’s organized in a typica l topology is found to be superior (100 %) for Training . Finally, optimal algorithm has been developed on the bas is of the best class ifier performance. The algorithm will provide an effective alternative to traditional method of P l a n t Classification with Pollen Characters using SEM image's.
KEYWORDS: Image Processing, Neural Network, Transformed domain Technique, MATLAB ,Microsoft office excel , Statistic, SEM images.
I. INTRODUCTION
Pollen grains are widely used as fingerprints of plants. No wonder that pollen is often referred to as the Wonder Dust of Nature. Pollen grains play a vital role in the life of plants, animals and man. No seed, fruit or grain could be produced without the help of pollen. Traditionally, pollen morphological characters are used for plant classification and identification of plants. Pollen can tell us a lot about the world both past and present. Pollen grains can tell us what plants were around thousands of years ago,or even who may have committed a crime thus provide a biological and historical record of thousands years. The extremely small size allows the pollen to travel great distances and `hitch' rides employing all manner of materials and methods. Pollen can travel by transport of any form including insects, animals, birds, human and other transient materials such as planes, trains and boats; practically any moveable material. Many researcher, who uses Palynology as a primary research tool may have to spend up to 30 months of microscopic work for identifying and classifying the pollens.
Pollen grains are widely used as fingerprints of plants. No wonder that pollen is often referred to as the Wonder Dust of Nature. Pollen grains play a vital role in the life of plants, animals and man. No seed, fruit or grain could be produced without the help of pollen. Pollen also occupies a strategic position in the matter of food supply to mankind (Agashe, 2006).
Traditionally, pollen morphological characters are used for plant classification and identification of plants. The pollen grains are very typical and could provide very useful data for the delimitation of various genera and subsequently help to solve many stratigraphical and taxonomic problems (Sharma, 1968). Pollen can tell us a lot about the world both past and present. Polleng rains can tell us what plants were around thousands of years ago, how our ancestors used them, how plants have moved across the region, country and globe, what plants produced a certain variety of honey or even who may have committed a crime (Agashe, 2006).
ISSN(Online): 2320-9801
ISSN (Print) : 2320-9798
I
nternational
J
ournal of
I
nnovative
R
esearch in
C
omputer
and
C
ommunication
E
ngineering
(An ISO 3297: 2007 Certified Organization)
Vol. 4, Issue 3, March 2016
transport of any form including insects, animals, birds, human and other transient materials such as planes, trains and boats; practically any moveable material. Polleng rains are a valuable record of plant life. They provide information on subjects ranging from the nature and timing of evolutionary events to the relationship between vegetation and climate. The amount of morphological information recovered from pollen is crucial to the process of classification. To get the morphological details, SEM images were used for better understanding of pollens. High resolution is the advantage of SEMs, as they are able to capture details c) pollen surface that are unable to be resolved or captured using light microscope. The extra details in SEMs hold information that can better distinguish between different pollen types
Any researcher, who uses Palynology as a primary research tool may have to spend up to 30 months of microscopic work for identifying and classifying the pollens. Thus, automation of Palynology could lead to many advances: rapid results, larger data sets, objectivity, fine resolution sampling and possibly finer determinations (discriminations). Thus, in this research, the above problem was studied and an efficient algorithm which was a finite sequence of steps was used for image processing, feature extraction and design of CI based classifier which was reported as a final outcome of the study that will solve the problem of pollen classification. It is a list of well-defined instructions for completing the task of pollen classification.
The objective of the research is to develop an efficient classification based on computational intelligence approaches that provides the benefits of advances in engineering and technology to overcome the limitations of the present classification techniques giving precise classification accuracy of the sample pollen species of the pollen class.
II. RELATED WORK
From the related work reported so far in the published literature, it is observed that some of the researchers employed neural network for pollen identification and classification.
Flenley (1968), was the first to identify the need to automate the process of classification of pollen grain. Langford et al. (1990) established a co-occurrence matrix of grey levels for each sample. Then texture measures were calculated and used as input to a classification programme. France et al. (2000) developed an automated system for identification, classification and counting of pollen grains.
The choice of the classification method is vital for satisfactory results. Simple discriminating algorithms, e.g. one nearest neighbor, have been used for clustering due to their easy implementation and sometimes, the low computational expense. For instance, Rodriguez-Damian et al. (2003) chose a minimum distance classifier. In order to select the most critical feature, a Floating Search Method (FSM) was performed, reducing the vector size from 14 to 5 in the optimal case. Boucher et al. (2002) reported also the minimum distance concept to assign probabilities to shape feature vectors. The class decision was made by confirming hypothesis probabilities by palynological features.
Rodriguez-Damian et al. (2004) presented a complete system for classification of pollen allergenic species of Urticaceace family. The images were taken by an optical microscope. A coarse border of pollen grain was estimated using Hough Transform. A set of shape measures was computed, which were used to discriminate between species. They considered 18 images per class, so that total number of images was 234. Similarly, Zhang et al. (2004) used IA texture and shape features to classify to 97% accuracy for 5 taxa of modern New Zealand pollen types. A workable set of features has been selected by Zhang (2004) and the study of image proposed by Hold away (2004) has paved usefully automates Palynology.
Li et al. (2004) used image analysis (IA) texture features coupled with ANN to correctly classify 100% of 13 taxa of modern pollen and spore types found in New Zealand. Flenley et al. (2004) demonstrated the first successful automated identification, with 100% accuracy. The technique involved a use of neural network classifier applied to surface texture data from LM images. Rodriguez- Damian et al. (2004) proposed brightness and shape descriptors for pollen classification. Zhang et al. (2004) employed a supervised multilayer perceptron to classify a 6-dimensional vector. Zhang et al. (2005) recommended a method of texture description using wavelet transforms in combination with concurrence matrices and neural network with a view to classify the extracted image features. Sixteen types of airborne pollen grains were used, and more than 91% images were correctly classified.
ISSN(Online): 2320-9801
ISSN (Print) : 2320-9798
I
nternational
J
ournal of
I
nnovative
R
esearch in
C
omputer
and
C
ommunication
E
ngineering
(An ISO 3297: 2007 Certified Organization)
Vol. 4, Issue 3, March 2016
Baladal et al. (2010) suggested a computer vision as its artificial "eye" and an ANN as its artificial "brain". An automated image analysis procedure was used to extract gray-scale spectral values of pollen image and pollen classifier was designed based on 3-layer ANN and the gray-scale spectral values were used as input. Results showed that the automated procedure correctly classified pollen grains 78.7% of the time. Travieso et al. (2011) developed contour feature based classification, which was based on an HMM kernel.More standard characteristics like geometrical features and Fourier descriptors have been added to the pollen grain descriptions. Over this multiple feature vector, PCA has proven to increase the classification system performance.
Holt et al. (2012) employed a system known as "classifynder" using robotics and image processing to locate, photograph and classify image fossil pollen on a conventionally prepared pollen slide and coupled it with a neural network based classifier to identify the pollen in captured images. Results justify that the accuracy of the neural network based classifier was quite variable, caused partly by misclassification of deformed or broken grains.
In view of the above reviewed work, the use of CI based neural classifier techniques is justified, in the light of the facts that the obtained classification accuracy is 100%, except for one pollen sample.
III. PROPOSED ALGORITHM
A. Research Methodology
Fig 1.Flow Chart
ISSN(Online): 2320-9801
ISSN (Print) : 2320-9798
I
nternational
J
ournal of
I
nnovative
R
esearch in
C
omputer
and
C
ommunication
E
ngineering
(An ISO 3297: 2007 Certified Organization)
Vol. 4, Issue 3, March 2016
B. Description of the Proposed Algorithm:
1) Images Collected
We have collected the 30 SEM images of plant pollen grains from different different sources. By using this SEM images an algorithm is developed which purposes two-dimensional fast fourier transforme domain coefficient in addition to Average, Standard deviation, Entrophy, Contrast, Corelation, Energy, Homeginity this total digital coefficent get on excel sheet which will give as an input to the Neural network.
2)Feature Extaction
Collected SEM images of plant pollen in .jpg format. By using SEM images image processing using MATLAB the 128 features are extracted.
Fig 2.Few Samples of input processed SEM images of plant pollen
3) Neural Networks
Following neural networks are tested:
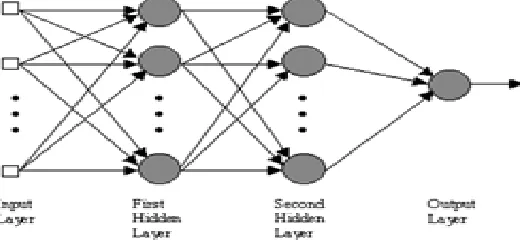
a) Multilayer perceptron (MLP)
The most common neural network model is the multi layer perceptron (MLP). This type of neural network is known as a supervised network because it requires a desired output in order to learn. The goal of this type of network is to create a model that correctly maps the input to the output using historical data so that the model can then be used to produce the output when the desired output is unknown. A graphical representation of an MLP is shown below:
ISSN(Online): 2320-9801
ISSN (Print) : 2320-9798
I
nternational
J
ournal of
I
nnovative
R
esearch in
C
omputer
and
C
ommunication
E
ngineering
(An ISO 3297: 2007 Certified Organization)
Vol. 4, Issue 3, March 2016
The MLP and many other neural networks learn using an algorithm called propagation. With back-propagation, the input data is repeatedly presented to the neural network. With each presentation the output of the neural network is compared to the desired output and an error is computed. This error is then fed back (back-propagated) to the neural network and used to adjust the weights such that the error decreases with each iteration and the neural model gets closer and closer to producing the desired output. This process is known as "training".[10]
b) Learning Rules used :
i) Momentum
Momentum simply adds a fraction m of the previous weight update to the current one. The momentum parameter is used to prevent the system from converging to a local minimum or saddle point. A high momentum parameter can also help to increase the speed of convergence of the system. However, setting the momentum parameter too high can create a risk of overshooting the minimum, which can cause the system to become unstable. A momentum coefficient that is too low cannot reliably avoid local minima, and can also slow down the training of the system.
ii) Conjugate Gradient
CG is the most popular iterative method for solving large systems of linear equations. CG is effective for systems of the form A=xb A (1)where x _is an unknown vector, b is a known vector, and A _is a known, square, symmetric, positive-definite (or positive-indefinite) matrix. (Don’t worry if you’ve forgotten what “positive-definite” means; we shall review it.) These systems arise in many important settings, such as finite difference and finite element methods for solving partial differential equations, structural analysis, circuit analysis, and math homework.
Developed by Widrow and Hoff, the delta rule, also called the Least Mean Square (LMS) method, is one of the most commonly used learning rules. For a given input vector, the output vector is compared to the correct answer. If the difference is zero, no learning takes place; otherwise, the weights are adjusted to reduce this difference. The change in weight from ui to uj is given by: dwij = r* ai * ej, where r is the learning rate, ai represents the activation of ui and ej is the difference between the expected output and the actual output of uj. If the set of input patterns form a linearly independent set then arbitrary associations can be learned using the delta rule.
Developed by Widrow and Hoff, the delta rule, also called the Least Mean Square (LMS) method, is one of the most commonly used learning rules. For a given input vector, the output vector is compared to the correct answer. If the difference is zero, no learning takes place; otherwise, the weights are adjusted to reduce this difference. The change in weight from ui to uj is given by: dwij = r* ai * ej, where r is the learning rate, ai represents the activation of ui and ej is the difference between the expected output and the actual output of uj. If the set of input patterns form a linearly independent set then arbitrary associations can be learned using the delta rule.
iii) Quick propagation
Quick propagation (Quickprop) [1] is one of the most effective and widely used adaptive learning rules. There is only one global parameter making a significant contribution to the result, the e parameter. Quick-propagation uses a set of heuristics to optimise Back-propagation, the condition where e is used is when the sign for the current slope and previous slope for the weight is the same.
iv) Delta by Delta
Developed by Widrow and Hoff, the delta rule, also called the Least Mean Square (LMS) method, is one of the most commonly used learning rules. For a given input vector, the output vector is compared to the correct answer. If the difference is zero, no learning takes place; otherwise, the weights are adjusted to reduce this difference. The change in weight from ui to uj is given by: dwij = r* ai * ej, where r is the learning rate, ai represents the activation of ui and ej is the difference between the expected output and the actual output of uj. If the set of input patterns form a linearly independent set then arbitrary associations can be learned using the delta rule.
ISSN(Online): 2320-9801
ISSN (Print) : 2320-9798
I
nternational
J
ournal of
I
nnovative
R
esearch in
C
omputer
and
C
ommunication
E
ngineering
(An ISO 3297: 2007 Certified Organization)
Vol. 4, Issue 3, March 2016
IV.SIMULATION RESULTS
1) Computer Simulation
The GFF neural network has been simulated for 30 SEM images out of which 20 SEM Images were used for training purpose and 10 SEM images used for cross validation.
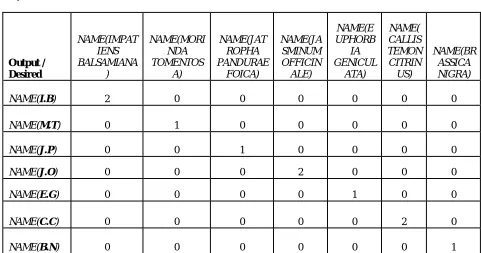
The Simulation of best classifier along with th confusion matrix is shown below:
Fig.4 GFF neural network trained with DBD learning rule
2) Result
Output / Desired
NAME(IMPAT IENS BALSAMIANA
)
NAME(MORI NDA TOMENTOS
A)
NAME(JAT ROPHA PANDURAE
FOICA)
NAME(JA SMINUM OFFICIN
ALE)
NAME(E UPHORB
IA GENICUL
ATA)
NAME( CALLIS TEMON
CITRIN US)
NAME(BR ASSICA NIGRA)
NAME(I.B) 2 0 0 0 0 0 0
NAME(M.T) 0 1 0 0 0 0 0
NAME(J.P) 0 0 1 0 0 0 0
NAME(J.O) 0 0 0 2 0 0 0
NAME(E.G) 0 0 0 0 1 0 0
NAME(C.C) 0 0 0 0 0 2 0
NAME(B.N) 0 0 0 0 0 0 1
ISSN(Online): 2320-9801
ISSN (Print) : 2320-9798
I
nternational
J
ournal of
I
nnovative
R
esearch in
C
omputer
and
C
ommunication
E
ngineering
(An ISO 3297: 2007 Certified Organization)
Vol. 4, Issue 3, March 2016
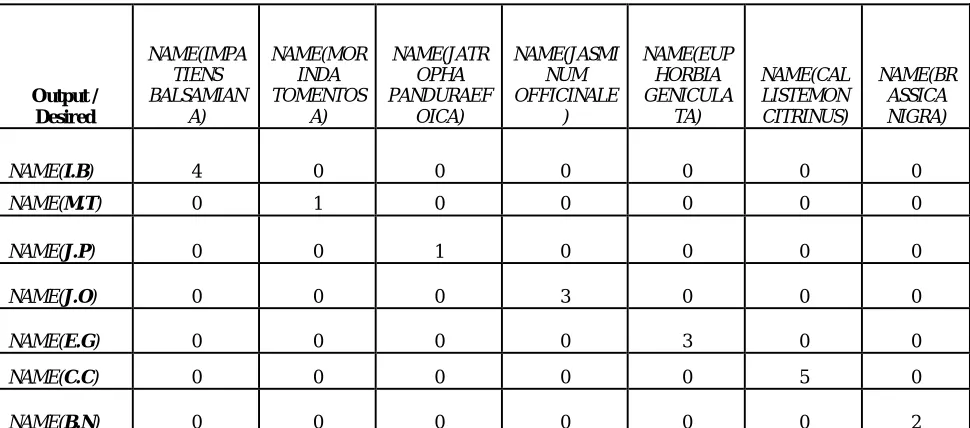
Output / Desired NAME(IMPA TIENS BALSAMIAN A) NAME(MOR INDA TOMENTOS A) NAME(JATR OPHA PANDURAEF OICA) NAME(JASMI NUM OFFICINALE ) NAME(EUP HORBIA GENICULA TA) NAME(CAL LISTEMON CITRINUS) NAME(BR ASSICA NIGRA)
NAME(I.B) 4 0 0 0 0 0 0
NAME(M.T) 0 1 0 0 0 0 0
NAME(J.P) 0 0 1 0 0 0 0
NAME(J.O) 0 0 0 3 0 0 0
NAME(E.G) 0 0 0 0 3 0 0
NAME(C.C) 0 0 0 0 0 5 0
NAME(B.N) 0 0 0 0 0 0 2
Table II. Confusion matrix on Training data set
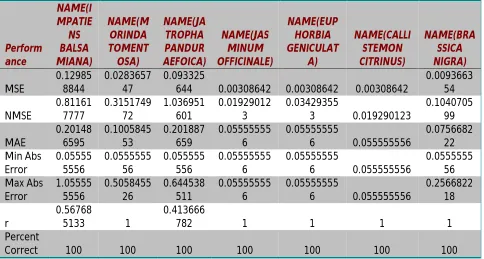
Performa nce NAME(IM PATIENS BALSAMI ANA) NAME(MO RINDA TOMENTO SA) NAME(JATR OPHA PANDURAE FOICA) NAME(JAS MINUM OFFICINAL E) NAME(EUP HORBIA GENICULAT A) NAME(CAL LISTEMON CITRINUS) NAME(B RASSICA NIGRA) MSE 0.1298588 44 0.0283657 47 0.09332564 4 0.0030864 2 0.0030864 2 0.0030864 2 0.00936 6354 NMSE 0.8116177 77 0.3151749 72 1.03695160 1 0.0192901 23 0.0342935 53 0.0192901 23 0.10407 0599 MAE 0.2014865 95 0.1005845 53 0.20188765 9 0.0555555 56 0.0555555 56 0.0555555 56 0.07566 8222 Min Abs Error 0.0555555 56 0.0555555 56 0.05555555 6 0.0555555 56 0.0555555 56 0.0555555 56 0.05555 5556 Max Abs Error 1.0555555 56 0.5058455 26 0.64453851 1 0.0555555 56 0.0555555 56 0.0555555 56 0.25668 2218 r 0.5676851 33 1 0.41366678
2 1 1 1 1
Percent
Correct 100 100 100 100 100 100 100
ISSN(Online): 2320-9801
ISSN (Print) : 2320-9798
I
nternational
J
ournal of
I
nnovative
R
esearch in
C
omputer
and
C
ommunication
E
ngineering
(An ISO 3297: 2007 Certified Organization)
Vol. 4, Issue 3, March 2016
Perform ance NAME(I MPATIE NS BALSA MIANA) NAME(M ORINDA TOMENT OSA) NAME(JA TROPHA PANDUR AEFOICA) NAME(JAS MINUM OFFICINALE) NAME(EUP HORBIA GENICULAT A) NAME(CALLI STEMON CITRINUS) NAME(BRA SSICA NIGRA) MSE 0.12985 8844 0.0283657 47 0.093325
644 0.00308642 0.00308642 0.00308642
0.0093663 54 NMSE 0.81161 7777 0.3151749 72 1.036951 601 0.01929012 3 0.03429355 3 0.019290123 0.1040705 99 MAE 0.20148 6595 0.1005845 53 0.201887 659 0.05555555 6 0.05555555 6 0.055555556 0.0756682 22 Min Abs Error 0.05555 5556 0.0555555 56 0.055555 556 0.05555555 6 0.05555555 6 0.055555556 0.0555555 56 Max Abs Error 1.05555 5556 0.5058455 26 0.644538 511 0.05555555 6 0.05555555 6 0.055555556 0.2566822 18 r 0.56768 5133 1 0.413666
782 1 1 1 1
Percent
Correct 100 100 100 100 100 100 100
Table IV. Accuracy of the network on Training data set
Hear Table no III and IV show the 37 processing element with Delta by Delta algorithm of Neuro Solution. It show the 100% accuracy in both Training as well as cross-validation data set.
V.CONCLUSION AND FUTURE WORK
The GFF Classifier with DBD learning rule gives best performance of 100% accuracy in training as well as cross-validation.
Using our Algorithm Palynologist can classified plant pollen with enough confidence. Moreover our algorithm can also be used by the expert in order to confirm their decision.
REFERENCES
1. Flenley J.R., The problem of pollen recognition. In: clowes M.B., Penny J.P.,(Eds.),Problems of picture Interpretation. C.S.I.R.O,Canberra, pp:141-145,1968
2. Sharma, B.D Contriubution to pollen morphology and plant taxonomy of the family Bombacaceae. Pakistan J.Rot. 36 (3):175-191,1968. 3. Aftab R. and Perveen A. (2006) A palynological studies ofsome cultivated trees from Karachi. Pak.J. Rot. 38 (1): 15-28.
4. Ahmad K., Khan M. A. and Shaheen N. Palyonological studies of the semi-desert plant species from Pakistan. African Journal of Biotechnology Vol. 9 (24): 3527-3535, 2010.
5. Arpaia P., Daponte D., Grimaldi D., Michaeli L., ANN-based error reduction for Experimentally modeled sensors, IEEE Transactions on Instrumentation and Measurement, 51: 23-29, 2002.
6. Baum E.B., On the capabilities of multilayer perceptrons, Journal of Complexity, 4:193- 215, 1988 . 7. Beevi H.and Nair, P.K.K. Pollen morphology of Coconut. Journal of Palynology Vol. 4: 1-118, 2006 .
8.Boucher, A., Thonnat, M.: Object recognition from 3D blurred images. In: Proceedings of 16th International Conference on Pattern Recognition, vol. 1, pp. 800-803 (2002).