University of Windsor University of Windsor
Scholarship at UWindsor
Scholarship at UWindsor
Electronic Theses and Dissertations Theses, Dissertations, and Major Papers
2014
Predicting reward sensitivity in a non-clinical population
Predicting reward sensitivity in a non-clinical population
Brianne Brooker University of Windsor
Follow this and additional works at: https://scholar.uwindsor.ca/etd
Recommended Citation Recommended Citation
Brooker, Brianne, "Predicting reward sensitivity in a non-clinical population" (2014). Electronic Theses and Dissertations. 5133.
https://scholar.uwindsor.ca/etd/5133
PREDICTING REWARD SENSITIVITY IN A NON-CLINICAL POPULATION
By
Brianne Brooker
A Thesis
Submitted to the Faculty of Graduate Studies Through the Department of Psychology In Partial Fulfillment of the Requirements for the
Degree of Master of Arts at the University of Windsor
Windsor, Ontario, Canada
2014
Predicting Reward Sensitivity in a Non-Clinical Population
By
Brianne Brooker
APPROVED BY:
_______________________________________________ C.L. McGowan
Faculty of Human Kinetics
_______________________________________________ C.A. Abeare
Department of Psychology
_______________________________________________ C.J. Miller, Advisor
Department of Psychology
DECLARATION OF ORIGINALITY
I hereby certify that I am the sole author of this thesis and that no part of this
thesis has been published or submitted for publication.
I certify that, to the best of my knowledge, my thesis does not infringe upon anyone’s
copyright nor violate any proprietary rights and that any ideas, techniques, quotations, or
any other material from the work of other people included in my thesis, published or
otherwise, are fully acknowledged in accordance with the standard referencing practices.
Furthermore, to the extent that I have included copyrighted material that surpasses the
bounds of fair dealing within the meaning of the Canada Copyright Act, I certify that I
have obtained a written permission from the copyright owner(s) to include such
material(s) in my thesis and have included copies of such copyright clearances to my
appendix.
I declare that this is a true copy of my thesis, including any final revisions, as
approved by my thesis committee and the Graduate Studies office, and that this thesis has
not been submitted for a higher degree to any other University or Institution.
This study has been approved by the University of Windsor’s Research Ethics
ABSTRACT
Reward sensitivity (RS) has been implicated in a range of suboptimal psychological
outcomes, including ADHD, antisocial personality disorder, borderline personality
disorder, and callous-unemotional personality traits. Less known, however, is the
relation between these constructs and RS in the non-clinical population. The current
study investigated the utility of these traits in predicting RS in an undergraduate sample
(N = 225). Hierarchical multiple regression analyses suggested that impulsive ADHD
symptoms and relational aggression predicted RS, as measured by two distinct
questionnaires (R2adj. = .15 for SPSRQ Sensitivity to Reward [Torrubia, Ávila, Moltó, &
Caseras, 2001]; R2adj. = .07 for BIS/BAS Scales’ BAS total score [Carver & White,
1994]). Overall measures of callous-unemotional traits were not significantly related to
RS (ps = .54 - .95), although subscale-level associations suggested a small, inverse
relation between these constructs. These findings highlight the role of RS across the
ACKNOWLEDGEMENTS
I am incredibly grateful to the many people who have contributed to the completion of
this project. First, I would like to express my utmost appreciation for the hard work and
dedication of my research supervisor, Dr. Carlin Miller; I am so thankful for your words
of inspiration and your invaluable insight! I am also indebted to my thesis committee
members, Dr. Cheri McGowan and Dr. Chris Abeare, both of whom have provided their
time, encouragement, and valuable feedback. I would like to thank my fellow student
and friend, Molly Cairncross, for her tireless and meticulous work entering the data for
this project. I am also appreciative of the many fellow students, friends, and family
members who continue to encourage my growth as a researcher, a psychologist, and an
individual. Finally, and most importantly, I am inexpressibly grateful to my husband,
TABLE OF CONTENTS
DECLARATION OF ORIGINALITY ... iii
ABSTRACT ... iv
ACKNOWLEDGMENTS ...v
LIST OF TABLES ... ix
LIST OF ABBREVIATIONS ...x
I. LITERATURE REVIEW ...1
Introduction...1
Reinforcement Sensitivity: An Overview ...2
Impulsivity and Reward Sensitivity ...4
Attention-Deficit/Hyperactivity Disorder ...5
Reward sensitivity and ADHD ...6
Impulsive Personality Disorders...8
Reward sensitivity in ASPD and BPD ...11
Callous-Unemotional Traits ...12
Reward Sensitivity and CU Traits...14
II. THE PRESENT STUDY ...16
Rationale ...16
Methods ...17
Participants ...17
Procedure ...17
Measures ...18
Reward sensitivity ...18
Sensitivity to Reward/Sensitivity to Punishment Questionnaire ...19
The BIS/BAS Scales...20
ADHD symptoms ...22
ASPD and BPD symptoms ...23
Relational Aggression Questionnaire ...24
Callous-unemotional traits ...25
Data Analysis ...26
Missing data analysis ...27
Multiple regression analyses ...27
III. RESULTS ...30
Predicting SPSRQ Sensitivity to Reward ...30
Participants included ...30
Model construction ...30
Final model ...31
Cross-validation of findings ...33
Assumptions of multiple regression ...33
Predicting BAS Total Score ...35
Participants included ...35
Model construction ...36
Final model ...36
Assumptions of multiple regression ...37
IV. DISCUSSION ...39
Impulsive symptoms and reward sensitivity ...39
ADHD symptoms ...41
Impulsive personality disorder symptoms ...42
Relational aggression ...44
Callous-unemotional personality traits and reward sensitivity ...47
Limitations ...50
Conclusions ...51
REFERENCES ...53
APPENDICES A. Notice of Research Ethics Board Clearance ...86
B. Demographic questionnaire...87
LIST OF TABLES
Table 1. Participant Demographics ...77
Table 2. Descriptive Statistics ...78
Table 3. Normality Diagnostics ...79
Table 4. Variable Intercorrelations ...80
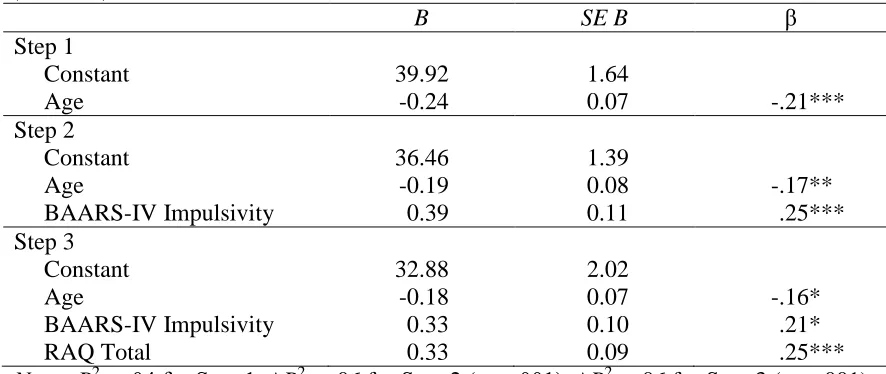
Table 5. Summary of Hierarchical Regression for Variables Predicting SPSQ Reward Sensitivity (N = 207) ...82
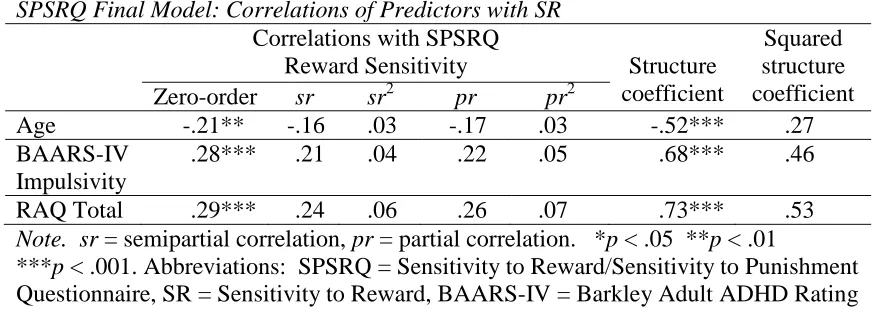
Table 6. SPSRQ Final Model: Correlations of Predictors with SR ...83
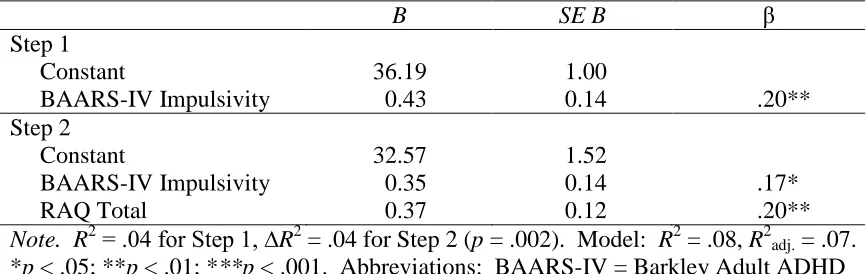
Table 7. Summary of Hierarchical Regression for Variables Predicting BIS/BAS BAS Total (N = 225) ...84
LIST OF ABBREVIATIONS
ADHD Attention Deficit/Hyperactivity Disorder
ASPD Antisocial Personality Disorder
BAARS-IV Barkley Adult ADHD Rating Scale
BAS Behavioural Approach System
BAS-T BIS/BAS Scales BAS Total Score
BIS Behavioural Inhibition System
BPD Borderline Personality Disorder
CU Callous-Unemotional or Callousness-Unemotionality
DSM-5 Diagnostic and Statistical Manual for Mental Disorders, 5th Edition
FFFS Fight/Flight/Freeze System
ICD Impulse Control Disorder
ICU Inventory of Callous-Unemotional Traits
MCAR Missing Completely at Random
MNAR Missing Not at Random
RST Reinforcement Sensitivity Theory
SPSRQ Sensitivity to Punishment/Sensitivity to Reward Questionnaire
SP SPSRQ Sensitivity to Punishment subscale
SR SPSRQ Sensitivity to Reward subscale
RAQ Relational Aggression Questionnaire
TBI Traumatic Brain Injury
I. LITERATURE REVIEW
Introduction
In our daily experiences, there are many factors that influence human behaviour.
Reward and punishment have long been understood to contribute to the development of
socially-desirable conduct. With roots in Skinner's theory of operant conditioning, the
current understanding of reward and punishment also includes the concept of individual
sensitivity. Specifically, those personal factors, such as differences in neurophysiology or
temperament, are understood to predispose individuals to respond differently to reward
and punishment (Boksem, Tops, Wester, Meijman, & Lorist, 2006; Corr, 2008).
Implicated in a number of suboptimal psychological outcomes, individual
responsivity to reward has been identified as an important personality construct. Its role
in impulsivity and impulse control disorders (Fowles, 1988), including
neurodevelopmental disorders such as attention-deficit/hyperactivity disorder, and some
personality disorders, including antisocial personality disorder and borderline personality
disorder, suggests both nosological and clinical importance for the reward sensitivity
construct. The goal of the present study is to evaluate the relations among reward
sensitivity, impulse control disorder (ICD) symptoms, and callous-unemotional
personality traits in a non-clinical sample.
This chapter describes the extant findings regarding reward sensitivity as they
relate to impulsivity-related constructs. The aim of this chapter is threefold: first, to
review the literature on reward sensitivity; second, to discuss impulsivity-related
callous-unemotional personality traits as an additional predictor of reward sensitivity in
nonclinical young adults.
Reinforcement Sensitivity: An Overview
Gray’s Reinforcement Sensitivity Theory (RST; Gray, 1970, 1981, 1987; Gray &
McNaughton, 2000) serves as a theoretical foundation for understanding individual
sensitivity to reward and punishment. This theory proposes that behaviour, affect, and
motivation itself are regulated by activity in three orthogonal, autonomic neural
networks. These networks are the Behavioural Inhibition System (BIS; Gray, 1987), the
Fight/Flight/Freeze System (FFFS; Gray & McNaughton, 2000; McNaughton & Corr,
2004), and the Behavioural Approach System (BAS, Gray, 1987; also known as the
Behavioural Activation System, Fowles, 1980). The sensitivities of these three
independent neural networks—that is, the intensity of a stimulus required for network
activation—are posited to govern individual sensitivity to punishment and reward.
According to the most recent version of Gray’s theory, the FFFS and BIS underlie
the construct of punishment sensitivity (Gray & McNaughton, 2000). Gray proposed that
the FFFS governs behaviour in the response to of aversive stimuli, as well as novelty and
frustrative non-reward. In contrast, the BIS modulates behaviour in the presence of
conflicting motivational signals (e.g. approach-avoidance conflict; Gray & McNaughton,
2000; Corr, 2008).
Gray and McNaughton (2000) proposed that these systems modulate response to
aversive stimuli via neural circuits connecting a number of regions, including the frontal
lobes (i.e., anterior cingulate cortex, posterior cingulate cortex, dorsal prefrontal cortex)
septohippocampal, and amygdalar regions). Recent functional neuroimaging research
has also suggested that decreased functional connectivity between these areas underlies
punishment sensitivity (reviewed in Kennis, Rademaker, & Geuze, 2013).
Revised RST theory describes a third neural network, the sensitivity of which is
principally responsible for determining an individual’s reward sensitivity (Gray &
McNaughton, 2000). Orthogonal to the BIS and the FFFS, the Behavioural Approach
System (BAS; Gray, 1970, 1987; Gray & McNaughton, 2000), or the Behavioural
Activation System (Fowles, 1980), is purported to underlie motivation to obtain positive
stimuli.
Like BIS and FFFS, the revised RST’s BAS sensitivity construct is thought to
emerge from circuits connecting specific brain regions. According to the revised RST,
emotional motivation driving reward pursuit involves four primary neural regions: the
prefrontal cortex, the ventral tegmentum, and the ventral pallidum and ventral striatum
(Gray & McNaughton, 2000). Accordingly, neuroimaging and electrophysiological
findings have supported the existence of reward-based neural networks; the sensitivity of
these four regions has been repeatedly identified as foundational to reward sensitivity
(Kennis et al., 2013).
In addition to the neuroimaging and electrophysiological methods used to identify
areas important for reward processing, two classes of methods are typically employed to
measure individual reward sensitivity. First, researchers have used performance-based
tasks which measure, for example, reaction time (e.g. Tripp & Alsop, 1999) or the
reward sensitivity is then quantified by comparing task performance in a condition in
which a reward is offered to performance in a no-reward condition.
Reward sensitivity is also frequently measured via self-report questionnaires. Of
note, Carver and White’s (1994) BIS/BAS scales are a popular measure of BIS/BAS
activity which include three subscales purported to measure various aspects of
BAS-related functioning. In addition, a more recent measure of the construct, the Sensitivity to
Punishment/Sensitivity to Reward Questionnaire (Torrubia, Avila, Moltó, & Caseras,
2001) is increasingly used to assess BIS and BAS sensitivity. Both measures have
allowed researchers to investigate the occurrence and correlates of self-reported reward
sensitivity in a range of populations.
Using these methods, researchers have suggested that heightened reward
sensitivity relates to a range of personal and nonclinical psychological features. For
example, reward sensitivity has been found to be lower in men than in women (Carver &
White, 1994). It has also been associated with a number of personality-based constructs;
for example, individuals who are more sensitive to reward have been found to be more
extraverted (Gray, 1970, 1987; Caseras, Avila, & Torrubia, 2003; Boksem, Tops, Wester,
Meijman, & Lorist, 2006) and proactive (Boksem et al., 2006). Greater reward
sensitivity also appears to correlate with positive affectivity (Franken & Muris, 2006;
Carver & White, 1994) and a propensity for novelty-seeking (Boksem et al., 2006).
Impulsivity and Reward Sensitivity
Germane to the present study, recent research has linked reward sensitivity to
normative impulsive behaviour. Although trait-like impulsivity and reward
2004), the two appear to be related (Gray & McNaughton, 2000). The terms have been
used interchangeably in early versions of Gray’s theory as well as by more contemporary
researchers (e.g. Ávila & Parcet, 2002). Scores on measures of reward sensitivity
correlate positively with self-reported impulsivity (Caseras, Avila, & Torrubia, 2003).
Moreover, individuals who are more sensitive to reward also demonstrate higher levels of
impulsivity-related behaviours, including more frequent risk-taking behaviours
(Zuckerman & Kuhlman, 2000). Greater reward sensitivity has also been related to
sensation-seeking (Torrubia, Ávila, Moltó, & Caseras, 2000) and related behaviours such
as reckless driving (Scott-Parker, Watson, King, & Hyde, 2011, 2013).
Reward hypersensitivity has also been implicated as a mechanism in disorders for
which poor impulse control is a central feature. For example, some research has
suggested altered reward processing as a correlate of substance abuse (e.g. Knyazev,
Slobodskaya, Kharchenko, & Wilson, 2004) and traumatic brain injury (e.g. Larson et al.,
2007). Of particular interest for the present study, a robust body of evidence has also
suggested a role for reward hypersensitivity in three disorders of impulse control:
attention-deficit hyperactivity disorder (ADHD), antisocial personality disorder (ASPD),
and borderline personality disorder (BPD).
Attention-Deficit/Hyperactivity Disorder
Attention-deficit/hyperactivity disorder (ADHD) is a common disorder of impulse
dyscontrol characterized by pervasive inattention and/or hyperactivity (American
Psychiatric Association, 2013). Although pediatric ADHD has long been a focus of
Diagnostic and Statistical Manual for Mental Disorders, Fifth Edition (DSM-5;
American Psychiatric Association, 2013).
ADHD is frequently accompanied by significant impairments in social
functioning (Maedgen & Carlson, 2000) and academic abilities (Barbaresi, Katusic,
Colligan, Weaver, & Jacobsen, 2007). Individuals with a history of ADHD in childhood
are also at risk for a number of comorbid disorders associated with poor impulse control,
such as conduct disorder (Mannuzza, Klein, Abikoff, & Moulton, 2004), Cluster B
personality disorders (Halperin, Rucklidge, Powers, Miller, & Newcorn, 2011), substance
abuse (Biederman et al., 1995), and intermittent explosive disorder (Kessler et al., 2006).
While much of these findings relate to clinical ADHD samples, individuals possessing
non-clinical levels of ADHD symptoms may nevertheless experience functional
impairments (Barkley et al., 2006). Given that ADHD symptoms appear to be normally
distributed in the general population (Cornish et al., 2005), the correlates of ADHD
symptomatology are relevant to the population as a whole.
Reward sensitivity and ADHD. It has been suggested that ADHD and similar
disorders result from atypical BAS regulation (Quay, 1988, 1997). In keeping with this
hypothesis, considerable research has implicated reward hypersensitivity as an etiological
mechanism of ADHD. Compared to typically-developing children, those with ADHD
typically demonstrate greater performance gains in response to reward (Luman, Meel,
Oosterlaan, & Guerts, 2012), with some evidence of a “speed-accuracy” tradeoff for this
improved performance in ADHD (reviewed in Luman, Oosterlaan, & Sergeant, 2005).
Heightened reward sensitivity in children with ADHD is also supported by physiological
Molen, 2003; Luman et al., 2005). Individuals with ADHD also demonstrate
neurophysiological anomalies in regions which contribute to reward processing,
including thinning of the prefrontal cortex (Shaw et al., 2006) and reduced activation in
the dorsal anterior mid-cingulate cortex (Bush, 2011). Research has further suggested
that individuals with ADHD differ in terms of their dopaminergic response to reward
(Tripp & Wiekens, 2008), although the research investigating this theory remains
somewhat equivocal (Luman, Tripp, & Scheres, 2010).
This relationship between clinicalADHD and reward hypersensitivity is
well-supported. However, although some studies have investigated the relationship between
ADHD symptoms and reward sensitivity in non-clinical samples, findings from this body
of work have not been wholly consistent. Although some have found reward
hypersensitivity to be related to the hyperactive/impulsive symptoms of ADHD (Gomez
& Corr, 2010; Hundt, Kimbrel, Mitchell, & Nelson-Gray, 2008; Mitchell, 2010; Mitchell
& Nelson-Gray, 2006), the relation between RST constructs and the inattentive
symptoms of ADHD is more equivocal. For example, reward hypersensitivity has been
associated with inefficient attention on a performance-based measure (Avila & Parcet,
2002); however, it is unclear whether performance on this computerized,
laboratory-based task generalizes to attentional abilities and difficulties observed in the general
population. Indeed, others have found that self-report inattention is associated with
punishment sensitivity rather than reward sensitivity (Gomez & Corr, 2011), yet still
others have found inattention to be linked to heightened reward sensitivity in females
necessary in order to gain a true understanding of the motivational mechanisms
underlying ADHD symptoms in a non-clinical population.
Impulsive Personality Disorders
Personality disorders consist of maladaptive personality traits as well as
deficiencies in one’s view of self and interpersonal patterns (American Psychiatric
Association, 2013). Two such disorders described by the DSM-5 areantisocial
personality disorder (ASPD) and borderline personality disorder (BPD; American
Psychiatric Association, 2013). In addition to their momentous personal cost to
individuals who suffer from these disorders, ASPD and BPD account for a substantial
proportion of the medical and incarceration costs incurred by society (Teplin, 1994;
Beauchaine, Klein, Crowell, Derbidge & Gatzke-Kopp, 2012; Bender et al., 2001).
In terms of their DSM-5 diagnostic criteria, ASPD and BPD represent
distinct-but-related constructs. Antisocial personality disorder is typified by a manipulative
interpersonal style and pervasive disregard for social norms. Additionally, individuals
with ASPD demonstrate a marked disregard for others’ rights and feelings, instead
motivated to fulfill their own desires and needs (American Psychiatric Association,
2013). Borderline personality disorder, in contrast, represents a constellation of
symptoms which result in the appearance of emotional instability and relational volatility
(American Psychiatric Association, 2013). As conceptualized by the DSM-5, individuals
with BPD achieve a sense of fulfillment only through their relationships with others.
Individuals with BPD typically idealize their relationships at the onset; however, when
slighted, these individuals typically feel abandoned and become aggressive, emotionally
While diagnostically discrete entities, ASPD and BPD share a high degree of
overlap in their central features. In fact, it has been suggested that ASPD and BPD
represent the gender-specific phenotypes of the same disorder (Paris, 1997). Aggression,
for example, is a trait often observed in both ASPD and BPD (APA, 2013). In
particular, relational aggression−a form of aggression characterized by expressing anger
by damaging peers’ social status−is a correlate of symptoms of both disorders (Ostrov &
Houston, 2008; Werner & Crick, 1999). Although relational aggression is often
conceptualized as a predominantly female form of aggression (Crick & Grotpeter, 1995;
Werner & Crick, 1999), the above-cited studies have identified this link in mixed-gender
samples, suggesting that relational aggression may also apply to males with these
disorders.
While relational aggression represents an important feature of these disorders’
symptomatic presentation, perhaps the most salient point of overlap between ASPD and
BPD is their underlying impulsivity (Fossati et al., 2007; Looper & Paris, 2000; Steel &
Blaszczynski, 1998). ASPD and BPD are also frequently comorbid with
impulsivity-related issues such as substance abuse (Tragesser, Sher, Trull, & Park, 2007; Trull, Sher,
Minks-Brown, Durbin, & Burr, 2000) and pathological gambling (Barry, Stefanovics,
Desai, & Potenza, 2011; Slutske et al., 2001; Steel & Blaszczynski, 1998). Reckless
driving is also associated with both ASPD and BPD (Malta, Blanchard, & Freidenberg,
2005). In BPD, this characteristic impulsivity may also lead to self-harm (Brodsky,
Malone, Ellis, Dulit, & Mann, 1997) and risky sexual behaviours (Rickards & Laaser,
The impulsivity noted in ASPD and BPD appears to be related to neuroanatomical
anomalies in these groups. While controls activate primarily prefrontal regions while
inhibiting prepotent responses, ASPD and BPD groups activate diffuse neural networks
throughout the frontal and temporal lobes; this pattern suggests that more neural
resources are required for successful impulse control in ASPD and BPD (Völlm et al.,
2004). Similarly, atypical cortical and subcortical serotonin synthesis differentiates
individuals with BPD from normal controls (Leyton et al., 2001). Diminished serotonin
synthesis in in frontal areas (particularly the medial frontal gyrus), the striatum, and
cortical areas in the temporal lobe relates to the heightened impulsivity demonstrated by
BPD subjects (Leyton et al., 2001).
There is some evidence that the patterns of impulsivity observed in ASPD and
BPD may be related to an etiological overlap with ADHD. Research has suggested that
both ASPD and BPD often proceed from a childhood history of ADHD (Fossati, Novella,
Donati, Donini, & Maffei, 2002; Mannuzza, Klein, Bessler, Malloy, & LaPadula, 1998).
Evidence likewise exists for elevated co-occurrence of adult ADHD with BPD (Torok,
Darke, & Kaye, 2012; Speranza et al., 2011) and ASPD (Semiz et al., 2008).
The behavioural impulsivity associated with ASPD and BPD has been most
frequently studied in clinical samples. However, it must be noted that the relationship
between these personality disorder symptoms and impulsivity has also been identified in
nonclinical populations. James and Taylor (2007) found a self-report measure of overall
impulsivity to be related to ASPD (but not BPD) symptoms in nonclinical subjects.
Individuals who demonstrate BPD and ASPD features have also been found to
consequences; Fossati et al., 2004). ASPD and BPD symptoms in nonclinical samples
have also been linked to self-reported impulsive behaviours such as substance abuse
(Taylor, 2005) and self-harm (Casilas & Clark, 2002).
Reward sensitivity in ASPD and BPD. Heightened reward sensitivity appears
to be a possible mechanism for the impulsivity characteristic of these disorders. Both
ASPD and BPD have been shown to relate to heightened self-reported BAS
hypersensitivity in clinical samples (i.e., personality-disordered; Ross, Keiser, Strong, &
Webb, 2013). Moreover, self-reported ASPD and BPD symptoms are also associated
with heightened reward sensitivity in non-clinical groups (Ross, Keiser, Strong, & Webb,
2013; Pastor et al., 2007).
Additional support for reward hypersensitivity as a feature of ASPD may be
inferred from research investigating a similar construct, psychopathy. Although
psychopathy and ASPD do not appear to be wholly interchangeable (for a review, see
Ogloff, 2006), they share a conceptual core defined by egocentricity, antisocial
behaviour, and impulsivity. Thus, research identifying reward hypersensitivity in
individuals with psychopathy may have utility in supporting the link between reward
sensitivity and ASPD.
While it has been suggested that varying levels of punishment sensitivity may
distinguish distinct “primary” and “secondary” psychopathy subgroups, it is broadly
accepted that elevated reward sensitivity underlies most forms of psychopathy (e.g.
Blackburn, 2006; Lykken, 1995). Accordingly, empirical findings have found reward
hypersensitivity to underlie both primary and secondary psychopathy subgroups (Ross et
reward sensitivity is an important facet across psychopathy subtypes. In a study which
used a passive avoidance learning task in juvenile offenders, psychopathic adolescents
differed from non-psychopathic adolescent offenders in their response to reward, but not
to aversive stimuli (Scerbo et al., 1990). Individuals with clinically-elevated psychopathy
also display poor impulse control in the presence of reward (Masui & Nomura, 2011).
While the link between reward sensitivity and psychopathic traits is relatively
well-established in clinical groups, it has also been supported in work with a non-clinical
population (Masui & Nomura, 2011).
Callous-Unemotional Traits
As outlined above, symptoms of ICDs are thought to be strong predictors of
reward hypersensitivity. However, a growing body of evidence has also supported a
relation between reward sensitivity and a cluster of personality features known as
callous-unemotional (CU) traits. These personality traits appear to be stable throughout
adolescence and adulthood (Loney, Taylor, Butler, & Iacono, 2007) and encompass a
range of atypical affective features and patterns of social processing. Central to these
appear to be a lack of empathy and theory of mind (Pardini, Lochman, & Frick, 2003;
Muñoz & Frick, 2012; Stellwagen & Kerig, 2013) and an absence of guilty feelings after
wrongdoing (Frick & White, 2008; Muñoz & Frick, 2012).
Additionally, callous-unemotional traits appear to be related to atypical
neuroanatomical features. Research has particularly focused on the amygdala, which is
implicated in emotion processing (Dawel, O’Kearney, McKone, & Palermo, 2012);
accordingly, amygdalar malformation and dysfunction has repeatedly been identified as a
Taken together, these biological correlates suggest that CU traits are, at least in part, the
result of a neurobiological mechanism.
There is some evidence that CU traits approximate the normal distribution in the
general population (e.g. Loney, Butler, Lima, Counts, & Eckel, 2006). It has further been
suggested that some degree of CU traits may be normative, particularly in adolescence
and early adulthood (reviewed in Moffit, 1993). However, elevated
callousness-unemotionality has been associated with a range of behavioural and psychiatric disorders.
While CU traits have been most frequently investigated as a core feature of psychopathy
(Cooke, Michie, & Hart, 2005) emerging evidence suggests that CU traits comprise a
cross-disorders construct (Herpers, Rommelse, Bons, Buitelaar, & Scheepers, 2012). It
has been suggested, for example, that CU traits may serve as a marker for a more severe
subtype of conduct disorder (Kahn, Frick, Youngstrom, Findling, & Youngstrom, 2012).
Callous-unemotional traits have further been observed in a subset of individuals with
ADHD (Brammer & Lee, 2011) and a subgroup of non-clinical adolescents displaying
symptoms of BPD (Chabrol, Valls, van Leeuwen, & Bui, 2012), suggesting that they may
be a construct independent of these disorders themselves.
This construct has been identified as a risk factor for an array of maladaptive
behaviours, including substance abuse (Wymbs et al., 2012). They have also been shown
to incrementally predict future criminal behaviour (Kahn, Byrd, & Pardini, 2012;
McMahon, Witkiewitz, Kotler, & the Conduct Problems Prevention Research Group,
2010); similarly, CU traits have been consistently linked with higher displays of
instrumental aggression (that is, aggression which does not result from provocation but is
Callous-unemotional traits have also been shown to differentiate psychopathy from pure
antisocial behaviour (Christian et al., 1997) and predict antisocial personality disorder
diagnosis (McMahon et al., 2010). In addition to the ramifications of their own
behaviour experienced by individuals with CU traits, their associated interpersonal style
may encourage their peers to delinquency, although individuals who are CU are unlikely
to be influenced by their peers themselves (Kerr, van Zalk, & Stattin, 2012).
Reward Sensitivity and Callous-Unemotional Traits
Although the CU construct has come to the fore in only relatively recent years, a
few studies have investigated the relation between CU traits and reward sensitivity. This
growing body of literature has provided support for altered reward sensitivity in
individuals who display CU traits. For example, a number of studies have suggested that
CU traits accompany reward hypersensitivity. Children with CU traits appear to respond
more to positive reinforcement and reward than more punishment-based (e.g. time-out)
behavioural management strategies (Hawes & Dadds, 2005). Individuals with CU traits
also appear to overvalue the positive outcomes of aggression while undervaluing the
punitive consequences (Lorber, Hughes, Miller, Crothers, & Martin, 2011; Pardini,
Lochman, & Frick, 2003).
Support for the reward hypersensitivity of individuals with CU traits may also be
inferred from research investigating similar constructs. For example, high levels of
risk-taking behaviours, which have been argued to represent reward hypersensitivity
particularly in adolescence, have been observed in individuals with callous-unemotional
traits (Centifanti & Modecki, 2013; Essau, Sasagawa, & Frick, 2006; Frick, Lilienfeld,
2009). Of note, however, it is also possible that this increased risk-taking in individuals
with CU traits may instead be driven by low punishment sensitivity.
However, the literature investigating reward sensitivity in individuals with CU
traits is equivocal, as not all studies have found increased reward sensitivity to be
associated with CU. In fact, several studies have found diminished reward sensitivity as
a correlate of CU traits (e.g. Centifani & Modecki, 2013; Marini & Stickle, 2010; Roose,
Bijttebier, Claes, & Lilienfeld, 2011; Roose, Bijttebier, Decoene, Claes, & Frick, 2010;
Verona, Patrick, Curtin, Bradley, & Lang, 2004). As such, additional research is
II. THE PRESENT STUDY
Rationale
As reviewed above, the literature surrounding reward sensitivity includes
relatively strong evidence for the association between disorders of impulse control,
callous-unemotional traits, and reward sensitivity. However, several limitations of the
current literature exist which the present study is designed to address. Firstly, to this
author’s knowledge, a concurrent analysis of the utility of ICD symptoms and CU traits
in predicting reward sensitivity has yet to be conducted. Given that CU traits may
co-occur with ICD symptoms (e.g. McMahon et al., 2010; Brammer & Lee, 2011; Chabrol,
Valls, van Leeuwen, & Bui, 2012), simultaneous investigation of these features may
provide a more ecologically valid understanding of these traits.
Additionally, research investigating the impulsivity-reward sensitivity relation has
typically focused on clinical groups and incarcerated individuals. While research in these
groups is vital to an understanding of the clinical manifestations of these disorders, it
assumes that categorical diagnoses adequately capture the nature of disorder. However,
given evidence that impulsivity and callousness-unemotionality are personality traits
which approximate a normal distribution (e.g. Cornish et al., 2005; Loney et al., 2006),
using an arbitrary cutoff for treatment and research may disregard individuals who
nonetheless experience personally significant impairment. Although less is known about
the association between reward sensitivity and ICD and CU features in non-clinical
groups, this topic is nonetheless of great import.
Using self-report measures of ICD symptoms, CU traits, and reward sensitivity,
previous findings, it is hypothesized that greater self-reported ICD and CU features will
predict heightened reward sensitivity in a non-clinical sample. Support for an association
between these features may have important implications for motivating individuals who
display impulsive and callous-unemotional traits.
Methods
Participants
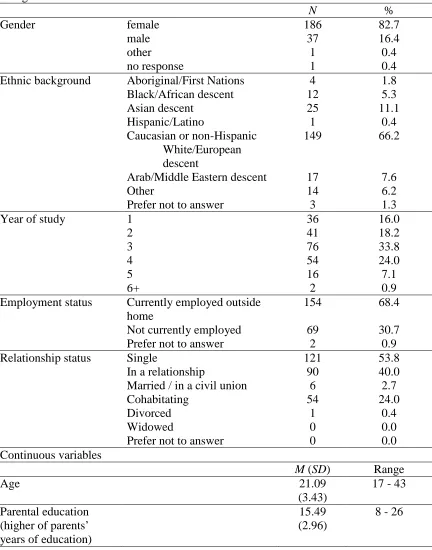
Two hundred twenty-five participants (186 females, 37 males; 1 indicated
“other”, 1 did not respond) were recruited through University of Windsor’s participant
pool. This electronically-based system allows full- and part-time undergraduate students
currently enrolled in psychology courses (and select business courses; 21 students
reported a business-related major) to receive course credit in exchange for participation in
a research study. Upon registration, participants complete a screening questionnaire,
allowing researchers to make their study invisible to participants who do not meet
inclusion criteria. For the present study, participants were unable to view the online
study advertisement and subsequently enroll if they indicated that they were unable to
read, write, and/or speak English.
Participant demographic information is presented in Table 1.
Procedure
The procedures used in this study were approved by the University of Windsor’s
Research Ethics Board (see Appendix A). Students who met the criteria for inclusion
were scheduled for participation via the University’s Department of Psychology
Participant Pool. All testing appointments were conducted by the author in on-campus
informed consent prior to participation in the study. Through this process, the
participants were apprised of the nature and duration of the study. Further, the minimal
risks of participation were explained, as were the benefits to participants (i.e., course
credit). In all, testing appointments lasted no longer than 90 minutes. Each participant
was awarded 1.5 credits for participation, in accordance with published participant pool
policy.
After consent had been obtained, participants completed a demographic
questionnaire and a packet containing several additional questionnaires, as described
below. Questionnaires were ordered randomly for each participant. Multiple participants
completed questionnaire packets during the same testing session. To ensure
confidentiality of responses, participants were not seated directly next to or across from
another participant. Further, participants were provided with a cover sheet to conceal his
or her responses, if desired.
Measures
Demographic information. A series of demographic questions was constructed
for the present study (see Appendix B). This questionnaire collected information
regarding participants’ age, birth month and year, ethnicity, marital status, and academic
standing. The demographic questionnaire also screened for a history of traumatic brain
injury. Information regarding parents’ academic and vocational attainment was also
gathered for the purposes of coding socio-economic status.
Reward sensitivity. The measurement of reward sensitivity has been deemed
“historically elusive” and limited by imperfect tools (Cogswell, Alloy, van Dulmen, &
measurement of this construct and are therefore used in the present investigation: the
Sensitivity to Reward/Sensitivity to Punishment Questionnaire (Torrubia et al., 2001) and
Carver and White’s (1994) BIS/BAS scales.
The Sensitivity to Punishment/Sensitivity to Reward Questionnaire (SPSRQ).
The SPSRQ (Torrubia et al., 2001) consists of forty-eight items to which individuals may
respond either “yes” or “no”. The SPSRQ is comprised of two subscales: Sensitivity to
Reward (SR) and Sensitivity to Punishment (SP). A total subscale score is derived for
both SR and SP by totaling the number of “yes” responses for each subscale. The SR
subscale is comprised of the measure’s even-numbered items. Questions such as “do you
generally give preference to those activities that imply an immediate gain?” and “are you
interested in money to the point of being able to do risky jobs?” measure approach
behaviours, corresponding with reward sensitivity. The odd-numbered SP items
measure avoidance behaviours with questions such as “whenever you can, do you avoid
going to unknown places?” and “do you often refrain from doing something you like in
order not to be rejected or disapproved of by others”?
The SPSRQ was constructed as a measure of specific reward- and
punishment-sensitive behaviours; consistent with Gray’s theory, the SPSRQ measures situational
manifestations of reward sensitivity rather than one’s general tendencies across different
types of situations (Torrubia et al., 2001). As such, the SPSRQ items are designed to
maximally discriminate individuals who possess a construct (i.e. reward sensitivity or
punishment sensitivity) to a high degree from those who are low on the construct. Unlike
many other measures of reward and punishment sensitivity, the SPSRQ produces
While it has been shown to be imperfect (Cogswell et al., 2006), the SPSRQ
represents a relative improvement over previously conventional measures of reward
sensitivity such as the BIS/BAS scales (Carver & White, 1994), described below. The
authors of the SPSRQ and others report “good” internal consistency (αmales= .78, αfemales
= .75, Torrubia et al., 2001; α = .75, Cogswell et al., 2006) for the SR subscale in large
non-clinical samples. The authors of the SPSRQ also claim “adequate” test-retest
reliability for the SR subscale (Torrubia et al., 2001).
The BIS/BAS Scales. As a supplement to the SPSRQ, Carver and White’s
(1994) BIS/BAS Scales were also administered. The BIS/BAS scales consist of
twenty-four self-statements encompassing a range of approach and avoidance behaviours. In
comparison to the SPSRQ, the BIS/BAS scale items measure general patterns of
BAS-relevant behaviours in response to rewarding stimuli (Torrubia et al., 2001). Participants
rate the degree to which they agree with each statement using a four-point Likert scale
([1] “very false” to [4] “very true”). The scale items reflect four content areas related to
BIS and BAS sensitivity: BIS (e.g. “I worry about making mistakes”), measuring
avoidance of aversive stimuli; BAS Drive (e.g. “When I want something, I usually go
all-out to get it”), measuring one’s work ethic or drive to obtain desired all-outcomes; BAS
Fun-Seeking (e.g. “I crave excitement and new sensations”), measuring spontaneity and the
pursuit of novel positive stimuli; and Reward Responsiveness (e.g. “When I get
something I want, I feel excited and energized”), measuring one’s affective responses to
possible reward. Utilizing a non-clinical sample, the authors report internal consistency
Responsiveness, α = .73; Drive, α = .76) and also provide some support for its convergent
validity (Carver & White, 1994).
Despite their frequent use, the three BAS subscales have garnered recurrent
criticism from RST researchers. Of paramount concern, the subdivision of BAS into
these three component domains is not rooted in RST theory, problematizing interpretation
of any relations between the scales and other constructs (Torrubia et al, 2001; Torrubia,
Ávila, & Casearas, 2008). From a psychometric standpoint, the factor structure of the
scale items is also unclear. Some argue that Carver and White’s four-factor model (BIS
and BAS Drive, Fun Seeking, Reward Responsiveness) does fit the scale items (Heubeck,
Wilkinson, & Cologon, 1998; Jorm et al., 1999; Leone, Perugini, Bagozzi, Pierro, &
Mannetti, 2001; Ross, Millis, Bonebright, & Bailley, 2002), although fit statistics
reported in these studies are typically only moderate and do not provide convincing
support for a four-factor model (Poythress, Skeem, Lilienfeld, Douglas, & Edens, 2009).
The validity of the individual BAS scales has also been subject to criticism. For
example, it has been suggested that the Fun Seeking scale measures BAS correlates, such
as impulsivity and novelty-seeking, rather than BAS itself (Caseras et al., 2003; Knyazev,
Slobodskaya, & Wilson, 2004; Zelenski & Larsen, 1999); as a result, the Fun Seeking
scale may be inappropriate for use as a standalone measure of reward sensitivity. The
psychometric properties of the individual BAS scales have also been criticized; for
example, internal consistency (as measured by Cronbach’s α) for the Reward
Responsiveness subscale has been as low as .59 in one sample (Cooper, Smillie, &
Jackson, 2008). Further, this subscale has been found to load on both BIS and BAS
In order to circumvent potential problems associated with using the less robust
subscales yet maintain continuity with the majority of previous studies of RST, some
researchers working with nonclinical samples have utilized a BAS total score (BAS-T)
comprising the combined scores of the three BAS subscales (e.g. Gomez & Gomez,
2002; Jorm et al., 1999; Murphy, Murphy, & Garavan, 2013; Stange et al., 2012).
Indeed, the scale authors initially reported that the BAS scales loaded onto a higher-order
BAS factor (Carver & White, 1994); others have found that scree values suggest a
two-factor (BIS, BAS-T) solution (Jorm et al., 1999). Using this approach, the BAS-T has
been demonstrated to have improved internal consistency compared to the subscales
individually (α = .81 in a large nonclinical sample; Smillie, Jackson, & Dalgleish, 2006).
In concordance with this approach (and in recognition that the BIS/BAS scales, in all
forms, imperfectly measure BAS sensitivity yet are the cornerstone of self-report RST
literature), the BAS-T was used in the present study.
ADHD symptoms. Current symptoms of ADHD were assessed using the
self-report Barkley Adult ADHD Rating Scale (BAARS-IV, Barkley, 2011). This
questionnaire was designed to assess the degree to which self-reported DSM symptoms of
ADHD deviate from a normative adult sample. The BAARS-IV consists of a list of 27
symptoms. Using a four-point Likert scale (from [1] “never or rarely” to [4] “very
often”), individuals rate the frequency with which each item has applied to them in the
past six months.
The BAARS-IV items measure ADHD symptoms across four domains:
Inattention (e.g. “difficulty sustaining my attention in tasks or fun activities”),
seated is expected”), Impulsivity (e.g. “blurt out answers before questions have been
completed, complete others’ sentences, or jump the gun”), and Sluggish Cognitive
Tempo (e.g. “I don’t seem to process information as quickly or as accurately as others”).
While examiners may compute a symptom count for these domains and for overall
ADHD symptomology (i.e., how many items were rated as “often” or higher), scale and
overall total scores (sum of all item ratings for each domain) were deemed more
appropriate for the present non-clinical sample. The BAARS-IV also assesses the
pervasiveness of ADHD symptoms (i.e., “In which settings did these symptoms impair
your functioning?”) and the approximate age of symptom onset.
Internal consistency values for the BAARS-IV, as reported by the scale’s author,
range from “good” (α = .78, Hyperactivity; α = .81, Impulsivity) to “excellent” (α = .90,
Inattention; α = .91, Current ADHD Total Score; Barkley, 2011). Satisfactory test-retest
reliability is also reported when participants were retested after an interval of two to three
weeks (rs ranging from .66 to .88). As evidence for the validity of this measure, the
author cites small to medium correlations between BAARS-IV Current scale scores and a
continuous performance test, and medium to large correlations with a self-report measure
of executive functioning (Barkley, 2011). Although developed for clinical use, the
BAARS-IV has been applied in some studies using non-clinical samples (e.g. Flannery,
Becker, & Luebbe, 2014; Langberg, Becker, Dvorsky, & Luebbe, 2014).
ASPD and BPD symptoms. Features of ASPD and BPD were assessed using the
Wisconsin Personality Disorders Inventory (WISPI-IV; Klein & Benjamin, 1996).
Derived from the DSM personality disorder diagnostic criteria, the WISPI-IV items
cognition associated with each of the personality disorders. The full-length WISPI-IV
consists of 214 items. For the current study, however, only the items corresponding to
each DSM-5 Cluster B diagnosis were administered in an effort to minimize participant
fatigue.
For each of the items, participants are asked to rate how much each statement has
applied to his or her “usual self” over the past five or more years. Responses fall on a
ten-point scale, ranging from “never/not at all” (1) to “always/extremely” (10). A mean
score for each personality diagnosis may be derived. Additionally, participants’ mean
scores for each diagnosis may be compared to a normative sample using scoring
software. Scores for each of the WISPI-IV diagnostic dimensions have demonstrated
“good” to “excellent” internal consistency in a partially non-clinical population (Klein et
al., 1993). The WISPI-IV also boasts reasonable convergent and discriminant validity
compared to other personality disorder measures (i.e. the Structured Clinical Interview-II;
Smith, Klein, & Benjamin, 2003). This measure has been previously applied in studies
investigating personality functioning in the non-clinical population, including RST
correlates of personality disorder symptomology (e.g. Kimbrel, Mitchell, Hundt,
Robertson, & Nelson-Gray, 2012).
Relational Aggression Questionnaire. Aggression is an important feature of the
DSM-5 diagnostic criteria for both ASPD and BPD. However, these criteria (and tools
based on them, such as the WISPI-IV) are largely biased toward acts of physical
aggression. It has been suggested that the manifestation of aggression varies by gender;
while males may enact aggression physically, it has been suggested that females’
gossip, excluding others, etc.; Crick & Grotpeter, 1995; Werner & Crick, 1999). Given
the overrepresentation of females in the university participant pool, inclusion of a
measure of relational aggression may better capture the aggressive ASPD and BPD
features of the current university sample.
For the current study, a seven-item Relational Aggression Questionnaire (RAQ)
was included as a brief and general measure of this construct. The items were originally
developed as a peer nomination tool (Werner & Crick, 1999); in this original form,
participants provided the name of a peer who typifies each item. Individuals who
received more frequent peer nominations were deemed to exhibit more relational
aggression. In order to feasibly use this measure to assess relational aggression in a
university sample, the seven items were adapted into a self-report questionnaire.
Participants were asked to rate the frequency at which each of the original items applies
to him- or herself on a five-point Likert scale (ranging from [1] “never true” to [5]
“always true”). A total score was then calculated, with higher scores reflecting a more
pervasive pattern of relational aggression. In its original form, this measure boasts good
reliability (α = .87; Werner & Crick, 1999). Although applied for the first time as a
self-report tool in the present sample, its reliability in the current study was adequate (α =
.60).
Callous-unemotional traits. Finally, callous-unemotional traits were assessed
using the Inventory of Callous/Unemotional Traits (ICU; Frick, 2004). The ICU consists
of twenty-four items designed to measure the behavioural and affective features of
callousness-unemotionality. The ICU items comprise three orthogonal factors (Essau,
Callous (e.g. “I do not care who I hurt to get what I want”), and Unemotional (e.g. “I am
very expressive and emotional”). Participants were asked to rate their agreement with
each statement on a four-point Likert scale ([1] “not at all true” to [5] “definitely true”).
An ICU total score as well as scores for each factor were calculated by summing
the response values for corresponding items. The internal consistency and test-retest
reliabilities of the ICU total score and the Uncaring and Callous factor scores have been
noted to be “good” (α = .83, ICU Total Score; α = .79, Callousness; α = .77, Uncaring; α
= .73, Unemotional; Roose et al., 2010). Because it has only five items, the Unemotional
subscale has demonstrated “poor” internal consistency in an incarcerated juvenile sample
(α = .57; Kimonis et al., 2008). However, the reliability of the Unemotional subscale was
found to be adequate in a non-clinical population (Roose et al., 2010). Moreover,
evidence exists for the convergent validity of the self-report ICU in non-clinical
populations. The ICU scores have been found to correlate significantly with measures of
psychopathy, personality, and reward and punishment sensitivity in a non-clinical sample
(Roose et al., 2010).
Data Analysis
The aforementioned measures yield several variables of interest in the current
analyses. Potential predictors of reward sensitivity (as measured by the SPSRQ and
BIS/BAS BAS-T) included ADHD symptoms (BAARS-IV total score), antisocial and
borderline personality disorder symptoms (ASPD and BPD scores from the WISPI-IV, as
well as a relational aggression total score from the RAQ), and callous-unemotional traits
Missing data analysis. The extent of missing data and the patterns by which data
are missing are important factors for consideration when addressing missing data
(Tabachnik & Fidell, 2001). For example, the generalizability of results may suffer for
datasets which are missing more than five percent of data points, or in which the data are
systematically missing (i.e., Missing Not at Random [MNAR]). In contrast, sparse,
random missing data are seen as less problematic.
Given importance of data missingness for informing subsequent analysis
decisions (Tabachnik & Fidell, 2001), the dataset was examined for missing data points
on all variables to be included in the analysis. Data were missing on 17.2% of the
variables of interest (i.e., questionnaire items, and as a result, total scores). Of the 225
participants, 33 (14.7%) had one or more missing data points. Overall, 0.1% of the total
dataset was missing. Little (1988)’s MCAR test was not statistically significant (χ2 [5919]
= 5763.780; p = .924), indicating that the data were likely missing completely at random.
Taken together, these findings suggest that the small amount of missing data is unlikely
to influence analysis results or their generalizability. Given the negligible quality of the
missing data, missing data points were imputed using expectation maximization, a
standard strategy for missing data imputation. This imputation and all subsequent
analyses were conducted in SPSS, v. 19.
Multiple regression analyses. A hierarchical multiple regression analysis was
designed for each of the two reward sensitivity variables: 1) SPSRQ Sensitivity to
Reward and 2) the BAS total score from the BIS/BAS Scales. Predictors for each model
traits. A theoretical entry order for potential predictor variables was predetermined as
follows:
1. In the first block of the analysis, potential confounding variables correlated
with the outcome variable were entered. For example, research has shown
gender differences in reward processing (e.g. Torrubia et al., 2001); for this
reason, gender was entered as a dummy-coded variable in Block 1. Because
both participant age and parental education (as estimated by the highest level
of parental education attained) have been shown to be related to functioning in
reward-related neural networks (Christakou, Brammer, & Rubia, 2011;
Gianaros et al., 2011), these variables were also entered in Block 1. This
allowed a less biased assessment of the incremental ability of
impulsivity-based measures to predict reward sensitivity.
2. Given that they have garnered the greatest degree of support as potential
correlates of reward sensitivity, variables representing symptoms of ADHD
(BAARS-IV ADHD total score; Inattention, Hyperactivity, Impulsivity,
and/or Sluggish Cognitive Tempo domain scores) were entered in the second
block.
3. Cluster B personality symptoms (WISPI-IV ASPD and BPD scores;
Relational Aggression Questionnaire total scores) were entered in Block 3.
4. Finally, to assess their incremental utility in predicting reward sensitivity,
callous-unemotional personality traits were entered in Block 4.
While this model was constructed to systematically guide the regression analyses, any
included in the regression analyses. Likewise, variables which did not incrementally
III. RESULTS
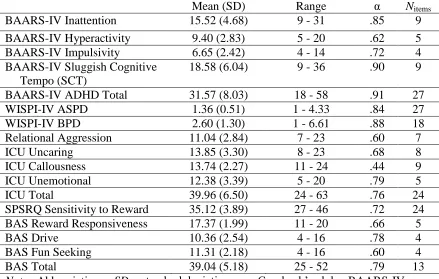
Descriptive statistics for the aforementioned variables of interest in predicting
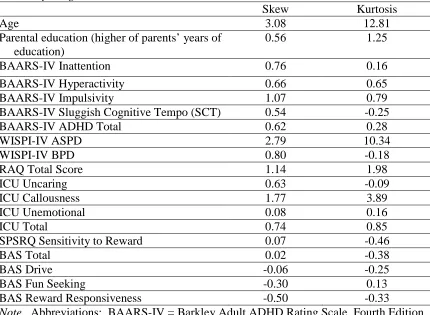
reward sensitivity are displayed in Table 2. Skew and kurtosis values were examined in
order to assess the degree to which measured traits approximated the normal distribution
(as indicated by a skew statistic < |2| and kurtosis statistic < |3|). With the exception of
age, ASPD symptoms, and ICU Callousness, all variables of interest adequately
approximated the normal distribution in the current sample (Table 3; Field, 2009).
Predicting SPSRQ Sensitivity to Reward
A series of hierarchical multiple regression models was conducted to identify
those variables which best predict reward sensitivity, as measured by the SPSRQ
Sensitivity to Reward (SR) scale.
Participants Included
Sixteen participants (7.1%) endorsed a history of traumatic brain injury (TBI)
resulting in a loss of consciousness. Because self-reported history of TBI was associated
with significantly higher SPSRQ Sensitivity to Reward scores (t(221) = -2.63; p = .009),
these participants were excluded from the analysis predicting SPSRQ scores, along with
the two participants who did not respond to this question. Gender was not significantly
related to history of TBI (χ2
(3) = 4.18, p = .24.).
Model Construction
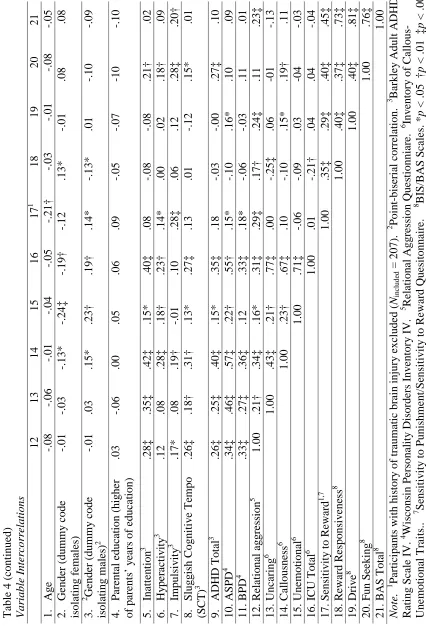
Correlations between each potential predictor and SPSRQ SR (in addition to all
relevant variable intercorrelations) are reported in Table 4. Contrary to preliminary
hypotheses, SR was not significantly correlated with variables measuring
Several variables were likewise correlated with Sensitivity to Reward but failed to
account for unique variance in the outcome variable when entered into the hierarchical
regression model. In particular, although a marginally significant relation emerged
between SR and the two dummy-coded gender variables (each isolating either
participants who identified themselves as males or females; point-biserial rmales = -.12, p
= .08; rfemales = .14, p = .05), the dummy-coded gender variables did not concurrently
predict SR scores when added with age in the first entry step of the model. They were
therefore eliminated as a possible predictor of SR scores.
Similarly, the BAARS-IV Impulsivity Total Score emerged as the only robust
ADHD-related variable in predicting SPSRQ Sensitivity to Reward; when entered
concurrently with this Impulsivity variable, neither the other BAARS-IV scale scores
(Inattention, Hyperactivity, and Sluggish Cognitive Tempo) nor the BAARS-IV Total
Score accounted for significant variance in SPSRQ Sensitivity to Reward. Thus, of the
BAARS-IV variables, only Impulsivity was retained for the final regression model.
Though significantly correlated with SR, WISPI-IV ASPD and BPD scores also failed to
account for unique variance in Sensitivity to Reward when entered in Step 3 and were
removed prior to construction of the final model.
Final Model
A final hierarchical regression model was constructed which accounted for 16.4%
of the variance in SPSRQ Sensitivity to Reward scores (R2adj. = .15; Table 5). In the first
block, age significantly predicted Sensitivity to Reward (R2adj. = .04; p = .002). The
addition of BAARS-IV Impulsivity in the second block significantly increased the
Fchange (1, 204) = 13.88, p < .001). The final addition of Relational Aggression
Questionnaire total scores likewise improved the model (∆R2 = .06; Fchange(1, 203) = 14.
22, p < .001). This final model significantly fit the data (F(3, 203) = 13.24, p < .001).
The predictor with the greatest weight was relational aggression (β = .25), though the
weight of impulsivity scores in predicting SR was nearly equivalent (β = .21). Age was
given the least weight in predicting SR (β = -.16).
Because β-weights may be influenced by the variables included in or excluded
from the model (Cohen, Cohen, West, & Aiken, 2003), additional statistics are reported
in Table 6 to provide a more global estimate of each variable’s importance in predicting
SR. These include squared partial correlations (indicating the proportion of variance in
the outcome variable that is both attributable to the given predictor and not accounted for
by other predictors; Cohen et al., 2003), squared semi-partial correlations (indicating the
proportion of overall variance in the outcome variable that is attributable to the given
predictor; Cohen et al., 2003), and squared structure coefficients (indicating the
proportion of the variance accounted for by the model that is attributable to the given
predictor, calculated as a correlation between a predictor and predicted scores;
Thompson, 2006).
Of note, the pattern of squared structure coefficients supported the relative
importance of each variable in predicting SR. By this metric, Relational Aggression had
the greatest weight in predicting SR (squared structure coefficient = .53), followed by
Impulsivity (squared structure coefficient = .46). Age had the least weight in predicting
Cross-Validation of Findings
While the adjusted R2 values reported above provide some estimation of the
shrinkage in predicted power expected when generalizing this model to the population as
a whole (derived via Wherry’s equation for R2; Stevens, 2002), the variance accounted
for by the model predicting SPSRQ was further cross-validated by using Stein’s formula
for a cross-validated R2 (Field, 2009; Stevens, 2002). This equation suggests that the
final SPSRQ model would account for slightly less variance were the model built upon
population-wide data, R2cv = .13.
Assumptions of Multiple Regression
In order to assess the validity and generalizability of these findings, variables
included in the final model were checked for violations of the assumptions of multiple
regression analysis. Multiple regression assumes an absence of outliers and influential
observations (Cohen et al., 2003; Tabachnik & Fidell, 2001). In the model predicting
SPSRQ Sensitivity to Reward, no cases had values which represented outliers on Y (i.e.
all standardized residuals < 3.27; Tabachnik & Fidell, 2001). However, while eight cases
had extreme values for one or more of the predictor variables (with leverage values >
[3{k + 1}/N]; Cohen et al., 2003), the data did not contain influential observations (all
Cook’s d values < 1.0; Stevens, 2002). Thus, cases which represented outliers on the
predictor variables were retained to preserve the integrity of the regression parameters
(Stevens, 2002).
In addition to an absence of outliers and influential observations, multiple
regression assumes an adequate sample size (Cohen et al., 2003). Conventionally, fifteen
will generalize to the population (Stevens, 2002); as such, the sample of 207 participants
would be adequate for the current three-predictor model. To verify, a post hoc power
analysis was run using G*Power (Faul, Erdfelder, Lang, & Buchner, 2007) using the
sample size of 207 and three predictors. The statistical power for the SPSRQ model
exceeded .99, indicating a low likelihood that the null hypothesis was incorrectly rejected
in the detection of a significant effect for the model.
Further analyses explored possible violations of additional assumptions of
regression. Intercorrelations between predictors were small (r values ranging from -.09
to .16). Taken together with in-range collinearity diagnostic statistics (i.e., all tolerance
values > .1 [range: .96 - .98], Field, 2009; all Variance Inflation Factor [VIF] values < 10
[range: 1.02 - 1.05], Stevens, 2002), the variables appear to demonstrate an acceptable
absence of multicollinearity. The residuals adequately approximated the normal
distribution, as indicated by histograms and a non-significant test of normality
(Shapiro-Wilk statistic (207) = .992; p = .32).
Multiple regression also assumes homoscadasticity, or that the variance for
residuals is equal across all values of the predictor variables, and that the predictors are
linearly related to the residuals (Field, 2009). Visual inspection of bivariate scatter plots
did not indicate violations of these assumptions. The model likewise demonstrated
independence of errors (Durbin-Watson statistic = 2.01). Additionally, multiple
regression assumes that variables are measured without error. Cronbach’s alpha values
are reported in Table 2. Internal consistency of the variables in the equation ranged from
“adequate” (α = .60, Relational Aggression Questionnaire Total Score) to “good” (α =
Finally, an assumption critical to the validity of a regression model is that of
independent observations (Stevens, 2002). The design of the present study makes both
final regression models constructed minimally susceptible to violations of this
assumption. Although it is likely that some of the participants in the present study
interact in courses or in their respective programs of study, the variables included in the
final model measure somewhat static personality features rather than behaviours that are
readily influenced by peer involvement. Second, the non-experimental design of the
present study meant that participants provided information for only one time point and
were not selected into groups, which would invite further peer influence. Finally,
participants were discouraged from speaking during questionnaire completion, and efforts
were made to conceal participants’ answers from fellow participants. In sum, while a
minor violation of this assumption is inevitable--particularly in a university sample--its
effects on the validity of the study’s findings are likely minimal.
Predicting BAS Total Score
A second series of hierarchical multiple regression models was constructed to
identify those variables that best predict reward sensitivity as measured by the BAS-T.
Participants Included
The 16 participants reporting a history of traumatic brain injury with loss of
consciousness did not differ significantly in terms of BIS/BAS BAS total scores (t(221) =
-1.03; p = .31) and were therefore retained for this analysis. Individual scores on the