University of Windsor University of Windsor
Scholarship at UWindsor
Scholarship at UWindsor
Electronic Theses and Dissertations Theses, Dissertations, and Major Papers
1-1-1970
An experimental investigation of the switching of a bistable fluidic
An experimental investigation of the switching of a bistable fluidic
amplifier.
amplifier.
C. J. Williams
University of Windsor
Follow this and additional works at: https://scholar.uwindsor.ca/etd
Recommended Citation Recommended Citation
Williams, C. J., "An experimental investigation of the switching of a bistable fluidic amplifier." (1970). Electronic Theses and Dissertations. 6881.
https://scholar.uwindsor.ca/etd/6881
SWITCHING OF A BISTABLE FLUIDIC AMPLIFIER
A The sis
Submitted to the Faculty of Graduate Studies through the
Department of Mechanical Engineering in Partial Fulfilmen
of the Requirements for the Degree of
Master of Applied Science at the
University of Windsor
by
C. J. Williams
B.Sc., The University College of Swansea, S. Wales
Great Britain, 1968
Windsor, Ontario, Canada
UMI Number: EC52847
INFORMATION TO USERS
The quality of this reproduction is dependent upon the quality of the copy
submitted. Broken or indistinct print, colored or poor quality illustrations and
photographs, print bleed-through, substandard margins, and improper
alignment can adversely affect reproduction.
In the unlikely event that the author did not send a complete manuscript
and there are missing pages, these will be noted. Also, if unauthorized
copyright material had to be removed, a note will indicate the deletion.
®
UMI
UMI Microform EC52847Copyright 2008 by ProQuest LLC.
All rights reserved. This microform edition is protected against
unauthorized copying under Title 17, United States Code.
ProQuest LLC 789 E. Eisenhower Parkway
fibU'2H
S c c C r
Approved by: ^ C"tv.Cvv
'Hi' dt-‘
cL*
r
"S .
A B S T R A C T
This thesis presents an experimental study of the
effects of main flow rate, control flow, setback and back
pressure on the switching time of a bistable fluidic amplifier.
An amplifier with a throat width of 1/4" was constructed
and the switching time was measured b y recording the output
of hot wires placed in the control channel and output leg
on an oscilloscope screen.
It was found that increasing the main flow rate decreased
the switching time and the percent of the main flow which
would be required to switch the amplifier.
The fact that different mechanisms for switching exist
for low and high values of control flow, slow and rapid
switching respectively, is discussed in detail.
A low value of control flow gave long unpredictable
switching times while a high value gave a short constant
switching time. The latter was the minimum switching time of the
amplifier for the particular configuration of variables
being used. This time was expressed as a Strouhal number ,
and the minimum Strouhal number range was found to lie between
control flow required to switch. Also for slow'switching,
increasing the setback increased the switching time
whereas during rapid switching a change in the setback
did not affect the switching time.
Increasing the back pressure on the amplifier ( i.e.
the loading of the output ports ), by reducing the output
area, was found to reduce the entrained flow in the passive
leg. This led to a decrease in the interaction region
pressure drop, and to the minimum Strouhal number range
reducing to
11
-19
.Using an alternative method for imposing the back
pressure on the amplifier viz., tanks at the output ports,
the effect of a capacitance was added to the switching mechanism.
This increased the minimum strouhal number range to 30-75
from a range of
11-19
for a mere reduction in the outletarea of the outputs. It was found that the ratio of the minimum \
control flow required to switch divided b y main flow rate
AC KNOWLEDGEMENTS
The author is indebted to Prof. W. G. Colborne for
providing the opportunity to pursue this investigation, and
would like to thank him for his guidance and many useful
suggestions while supervising the project.
The technical advice of Mr. 0. Brudy and the staff in
the Central Machine Shop is appreciated. Thanks are also
due to Mr. R. Myers for his assistance in constructing the
apparatus.
The research for this thesis was supported by the
Page
ABSTRACT iii
ACKNOWLEDGMENT V
TABLE OF CONTENTS vi
NOTATION i*
LIST OF FIGURES xi
LIST OF PLATES xiv
CHAPTER I INTRODUCTION 1
1.1 Development of the Technology of 1
Fluidics
1.2 The Bistable Fluidic Amplifier 3
CHAPTER II LITERATURE SURVEY 5
2.1 Principle of Operation 5
2.2 The Switching Mechanism
10
2.2.1 Terminated Wall or Bleed-type
11
Switching
2.2.2 Contacting Both Walls
11
2.2.3 Splitter Switching
12
2.2.4 Critical Attachment Angle Switching
12
2.2.5 The Three Usual Modes of Switching 13
2.3 The Switching Time l4
2.4 Effect of Three of the Parameters of 16
the Switching Mechanism
2.4.1 Setback l
6
2.4.2 Main Flow Rate l
6
2.4.3 Back pressure 17
2.5 The Effects of the Three Parameters 17
on the General Operation
CHAPTER III EXPERIMENTAL EQUIPMENT 19
3.1 Air Supply and Main Flow Measurements 19
3.2 Settling Chamber and Bellmouth 19
3.3 The Bistable Amplifier and its Instru-
20
mentation
CHAPTER IV EXPERIMENTAL PROCEDURE 26
4.1 Calibration 26
4.3 Experiments Performed
CHAPTER V RESULTS AND DISCUSSION OF RESULTS
5.1 Pressures in Legs When Active
5.2 Effect of Setback and Main Flow Rate
on the Minimum Control Flow Required to Switch
5.3 Effect of Control Flow on Strouhal
5.4 Effect of Main Flow Rate on Switching
Time
5.5 Effect of Setback on Switching Time
5.6 Presentation of Effects of Setback
and Main Flow Rate on Switching Time
5.7 Effect of Back Pressure on Main Flow
Rate
5.8 Effect of Back Pressure Upon Lateral
Flow condition
5.9 Effects of Back Pressure on Switching
CHAPTER VI CONCLUSIONS
6.1 Switching Properties
6.2 Switching Under Back Pressure
REFERENCES
FIGURES
PLATES
Plate 1 Savkar, Hansen and K e l l e r s , Illustra tion of Switching in a Bistable Ampli f ier
Plate 2 The Apparatus
Plate 3 Dimensions of the Bistable Amplifier Plate 4 Overhead View of the Amplifier
APPENDIX A
Table Table Table Table 3 4
Pressure in Legs When Active
Effect of Setback and Main Flow Rate on QC,m m
Effect of Control on Switching Time Effect of Setback, Main Flow Rate and Control on Switching Time
Table
6
Effect of Back Pressure (Measured Without Back Pressure Tanks) and Control Flow on Strouhal Number Table 7 Effect of Back Pressure, ControlFlow and Main Flow on Strouhal Number
APPENDIX B USEAGE OF NON-DIMENSIONAL NUMBERS
B. 1
B .
2
B.3
b .4
APPENDIX C
The Strouhal Number
Non-Dimensional Control Flow Non-Dimensional Back Pressure Pressure and Flow Gains
SUMMARY OF EXPERIMENTS PERFORMED
NOTATION
B.P. Back pressure, i.e. the loading on the out
puts of the amplifier
D n Main flow nozzle width
E Entrained flow
Ngp Non-dimensional back pressure (see appendix
B3)
Static Pressure Tap Locations
PgT Settling chamber
P sth Throat of Amplifier
Pgp
1
st tap in output legPS2 2nd tap in output leg
P
S3
3
rd tap in output legPgi|. ^th tap in output leg
PgB Bcick pressure tank
(Subscripts of R and L refer to right or left legs)
QC Control flow
QCmin Minimum control flow required to switch the amplifier
QS Main flow
U Dn
R e Reynolds number,
---S Setback of attachment walls from main flow nozzle
S/Dn Non-dimensional setback
D
STmin Minimum Strouhal Number capable of being produced b y the amplifier
t Switching time of the amplifier
U Velocity of the Main Flow Measured at the nozzle
n
Exit
L I S T OP F IG U R E S
Fig. 1 Initial Fluid Flow Between Parallel Walls
Fig. 2 Final Fluid Flow Between Parallel Walls
Fig. 3a Schematic Diagram of Attached Jet
Fig. 3k Pressure Distribution Along Attached Wall
Fig. 4 Separation Bubble Flows
Fig. 5 Streamlines of the Coanda Effect
Fig.
6
Diagram of the Bistable ElementFig. 7 Terminated Wall or Bleed Switching
Fig.
8
Contacting Both VJalls SwitchingFig. 9 Splitter Switching
Fig. 10 Critical Attachment Angle
Fig. 11 Schematic Diagram of the Apparatus
Fig. 12 Venturi Flow Meter Calibration
Fig. 13 Calibration of control Channel Hot Wire Against Rotameter
Fig. l^i Explanation and Examples of Switching Pattern as Displayed on Oscilloscope
Fig. 15 Pressures in Legs when Active
Fig. 16 Effect of Setback and Main Flow Rate on
^ m i n
Fig. 17 Extension of Foster And Jones Results on Effect of Setback on QCm j_n
Fig. 19 L u s h ' s Results on Effect of Control
67
Flow on Switching Time
Fig. 20 Effect of Main Flow Rate on Switching Time
68
Fig. 21 Effect of Setback on Switching Time 69
Fig. 22 Effect of Main Flow and Control Flow on JO
Strouhal Number, S = 0"
Fig. 23 Effect of Main Flow and Control Flow on 71
Strouhal Number, S = .015"
Fig. 24 Effect of Main Flow and Control Flow on J2
Strouhal Number, S = .030"
Fig. 25 Effect of Main Flow and Control Flow on 73
Strouhal Number, S = .045"
Fig. 26 Effect of Setback on STm ^n and QCm j_n (ST) 7^
Fig. 27 Effect of Back Pressure on Main Flow Rate 75
Fig. 28 Effect of Back Pressure on Internal Pressures j6
Fig. 29 Nomenclature for Static Pressure Taps 77
Fig. 30 Interaction Region Pressure Drops, j8
QS ~ 6.4 scfm
Fig. 31 Interaction Region Pressure Drops, 79
QS = 11.2 gcfm
Fig. 32 Interaction Region Pressure Drops,
80
QS — 14.5 scfm
Fig. 33 Effect on Entrained Flow
8
lFig. 34 Effect of Back Pressure (Measured Without Back 82
Pressure Tanks) and Control Flow on Strouhal N u m b e r .
Fig. 35 Effect of Back Pressure and Control Flow on
83
Strouhal N u m b e r .q s = 6.4 scfm
Page
Fig.
36
Effect of Back Pressure and Control Flow on 84Strouhal Number QS = 9*2 scfm
Fig. 37 Effect of Back Pressure and Control Flow on 85
Strouhal Number q s = 12.5 scfm
Fig.
38
Effect of Back Pressure and Control Flow on 86Strouhal Number QS = 14.5 scfm
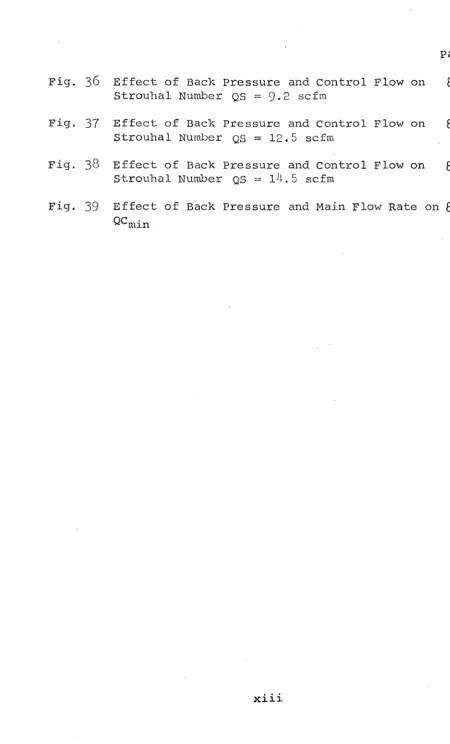
Fig. 39 Effect of Back Pressure and Main Flow Rate on
87
Plate 1
Plate 2
Plate 3
Plate 4
Savkar, Hansen and Kellar's Illustration of Coanda Flow.
The Apparatus
Dimensions of the Bistable Amplifier
Overhead V i e w of the Amplifier
CHAPTER I
INTRODUCTION
I .1 Development of the Technology of Fluidics
The tendency for a jet to attach to an adjacent
surface, is the basis of operation of the bistable fluidic
amplifier. This tendency was first noted by Thomas Young
%
in l800(l).Dr.Henri Coanda is reported to have noticed the
effect in
1910
, but it was not until the1930
's that thephenomenon was re-examined and was subsequently named the
Coanda effect. An interest in using this effect for control
ling fluid logic (fluidic) devices was first announced by the
Harry Diamond Laboratory in
1960
(2
)In the past ten yearsthere has been a growing interest in the technology of fluid
ics, which describes the general field of fluid devices or
systems performing sensing,logic, amplification and control
functions employing primarily no moving parts.
There are two categories of elements; active and
passive. Comparing these with familiar electronic components
the passive elements consist of resistances which are cap
illary tubes causing a restriction to the flow, and capaci
tances formed by cavities. Active elements, so named because
their function results in a power amplification, are based
flow modulates the relatively high powered supply flow.
There are, to date, primarily six such amplifiers v i z . y
i) Proportional deflection of the supply jet b y
the momentum of the control jet.
ii) Supply jet impact amplifier,
iii) Vortex amplifier in which a vortex in the main
flow is formed or destroyed by the control jet.
iv) The movement of the point of separation in flow
round an elbow,
v) The turbulence amplifier in which the supply jet
goes from a laminar flow to a turbulent flow by
the application of the control flow,
vi) The bistable amplifier which is described in
section 1.2.
A number of other methods of modulating the supply
flow form the basis of operation of other fluidic devices,
which normally perform special functions. A description of
these can be found in K i r s h n e r ’s book (1) and the
1967
1,2 The Bistable Fluidic Amplifier
The bistable amplifier is the most frequently used
element in fluidic circuits thus it has received the most
attention from research w o r k e r s ,
The bistable, or flip-flop, wall attachment amplifier
can be defined as a digital component with two stable out
puts and sufficient hysteresis so that it has a "memory". The
output channel in which the flow occurs is changed by a control
pulse. A continuous control signal is not necessary for the
main jet to remain in a given output condition.
The mechanism for switching from one output to the
other has been studied by the eight workers mentioned in
Chapter 2. Measurements of the time taken for the jet to
switch from one output port to the other have been made by
Lush (3), Savkar, Hansen and Keller(4) and Muller (5). The
present study aims at experimentally verifying the results
available on the switching time and performing a preliminary
investigation on the effects of geometry on the switching time.
Information obtained from this study would be useful
in furthering the understanding of the switching mechanism
and in attempting to find the optimum design with reference
reports of fluidic circuits being too slow for some industrial
applications(1 5 ) .Also, as the technology of fluidics advances,
the number of components used in one application increases,
CHAPTER II .
LITERATURE SURVEY
The material covered in this chapter summarizes
the existing literature dealing with the principle of oper
ation, the switching mechanism and the switching time of a
bistable elements.
2.1 Principle of Operation
A knowledge of how a bistable amplifier works,and
the flow pattern therein^ is essential for the understanding
of the switching mechanism and subsequently for the determination
of the importance of the factors affecting the switching time.
Kirshner (l) has given the most complete description.
The characteristics of a fluid stream flowing between
boundary walls and emerging in a similar medium are shown in
fig (l). As the jet issues from the nozzle its particles
collide with those of the surrounding fluid. By these colli
sions and turbulent mixing the jet entrains a portion of
the surrounding fluid. The removal of fluid from the inter
action region lowers the pressure in the area between the
jet and the boundary walls. This low pressure zone induces
a flow from the relatively high ambient pressure region beyond
the opening to maintain equilibrium. Due to the random
the right hand side of the main jet will result in fewer
particles being returned to this side of the jet. There
will then be a lower local pressure existing on the right
hand side of the jet. This low local pressure existing near
the right wall and the higher pressure on the left wall, will
force the stream towards right wall. This results in an even
greater pressure differential due to an even smaller counter
flow. Thus, a self reinforcing action occurs that quickly
shifts the stream completely against the right wall as shown
in fig. (2). Once the stream is forced against the wall, the
pressure differential holds it there as long as the main stream
is flowing. The low-pressure region is called a low-pressure
or separation bubble. Along the wall, downstream of the
low-pressure bubble, the low-pressure suddenly increases greatly at
the region of attachment fig. (3^)» This high pressure region
tends to seal off the low pressure bubble from pressures
existing in the region downstream of the point of attachment.
Equilibrium is established when the volume of the returned
flow equals the volume of the fluid entrained from the
low-pressure region, fig. (^). This equilibrium pressure is a
direct function of stream velocity; increasing or decreasing
entrained* thereby resulting in greater or lesser pressure
differential across the stream. As the stream is introduced
into the chamber through the nozzle, it can be caused to
attach to a selected wall b y a relatively slight assymetry
of the walls. The typical flow through a wall interaction
amplifier is shown in fig. (3)* There is a central core
which has not yet been affected by entrainment and which is
at essentially the same pressure as the source. An outer
mixing zone exists which is similar to that for submerged
streams not affected by walls. There is also a separation
bubble, near the wall, which consists of flow originally in
the power stream. This flow has a relatively low kinetic
energy and a low pressure. A vortex motion occurs in the
separation bubble as the stream continually entrains fluid
which is replaced by backflow from the attachment point.
Between the separation bubble and the core is the
inner mixing zone, which consists of flow originally in the
main stream and fluid entrained from the separation bubble.
If high pressures occuring downstream could proceed
upstream through the boundary layer into the low pressure
region, the stream would leave the boundary wall in a manner
similar to stall on an air-plane wing. However, the local
attach-ment must be exceeded before the equilibrium can be
disturbed. The point of attachment, in general, moves
downstream as the velocity of the stream increases.
The above is a description of the two dimensional
jet flowing adjacent to a flat plate as first investigated
b y Bourque and Newman (6), and Sawyer (7 and 8).
Several other workers have confirmed and added to
this explanation and below is a summary of their conclusions.
Experimental results on the switching will be presented
separately in the next section.
Muller (9) proceded to examine the effects of the
length of the attachment wall and of the aspect ratio, defined
as the ratio of the nozzle width to nozzle depth, on re
attachment. He set the angle of the inclined wall at the
optimum value of 15 degrees. With increasing wall angle the
minimum Reynolds number of the main jet necessary for jet
attachment to occur increases, while a low wall angle causes
instability.
A short wall, of 15 times the nozzle width was found
to be preferable as this produced a higher flow and pressure gain,
see Sec.B^. The reason for investigating the aspect ratio is that
for constant supply pressure the Reynolds number becomes
the critical value below which the jet no longer attaches
to the wall. Miniaturization of the elements is very
important for short switching times at low power consumpt
ion. It was found that the minimum Reynolds number for
attachment was reduced only slightly when the aspect ratio was
more than two. A further increase in the aspect ratio is
no longer economical as the power consumption is proportional
to the m o d e
1
d e p t h .Foster and Jones (10) added to the description b y
predicting the streamlines of the flow and adding the re
attaching streamline fig. (5). They stated that there is
no net flow across this line; all the flow above continues
downstream while all the flow below is recirculated.
Lush (3) extended this flow pattern by adding a
setback, defined by S as shown in fig. (
6
). He included adescription of the flow entrained by the main jet from the
separation bubble and that returned to bubble fig. (4). He
also stated that when the main jet flow remains constant and
the control flow =
0
, then the bubble volume is also constantand the entrained flow equals the returned flow. By using
a dye injected into water this condition was shown by observ
ing that the bubble shrank to a constant size after switch
The most effective photographs of the flow inside
a bistable amplifier have been produced by Savkar, Hansen
and Keller (4) who suspended aluminium particles in water
for photographing the flow. As is shown in Plate 1 the
aforementioned details of the flow are all clearly shown.
2.2 The Switching Mechanism
To shift the stream for one wall to another, control
channels are introduced on the sides of the power stream as
in fig. (6). Basically the switching mechanism can be ex
plained thus: if fluid is allowed to enter the low-pressure
region on the right at a greater rate than the main stream
can entrain and remove it, the pressure will increase} as
the flow continues the separation bubble will expand and the
pressure differential across the jet will approach zero.
The jet moves to the centre and the Coanda effect will then
cause the stream to attach to the left wall.
As this switching process was studied in more detail
it was realized that there are in effect four different
mechanisms contributing to the switching of a wall attachment
type amplifier. For ease of reference these are individually
listed below with each worker's contribution to that particular
11
2.2.1 Terminated Wall or Bleed-type Switching
Terminated wall or bleed type switching will be
predominant in amplifiers which have short wall lengths or
bleeds, see fig. (7)* As explained b y Kirshner (l), Foster
and Jones (10), and Wilson (11) the action of control flow
is to help satisfy the entrainment of the jet and hence
reduce the vacuum in the low pressure region so that the
bubble increases in size. This action continues until the
attachment point moves to the bleed outlet,or the end of the
wall, where the ambient fluid is drawn into the separation
bubble causing the jet to switch.
2.2.2 C o ntacting«-Both-WTalls switching
Foster and Jones (10) state that the second wall can
have a predominant effect. If the setback of the attachment
walls from the nozzle exit is low, then due to bubble ex
pansion and the momentum of the impinging control flow the
main jet is deflected far enough to allow entrainment to
cause a low pressure region on the opposite wall. This may
happen before the main jet loses contact with the initial
wall resulting in a separation bubble on the initial wall
which is being expanded b y the control flow, and one on the
opposite wall being contracted b y entrainment. Lush (3) and
as shown diagramatically in fig. (8). Wilson (11) adds
that this type of switching will occur when a high control
flow is used and in that case the second separation bubble
is formed before the effects of splitter switching come into
fo r c e .
2.2.3 Splitter Switching
When a splitter, as shown in fig. (6), is used to
separate the output flow then this can become a large in
fluence on the switching process. A point can be reached
at which the jet strikes the splitter at an angle as shown
in fig. (9h), resulting in a low pressure region towards the
tip of the splitter. This will help to lift the jet from
the wall. This explanation given b y Foster and Jones (10),
Kirshner (1) and Wilson (11) is demonstrated b y Savkar, Hansen
and Keller (4), b y flow vizualization as previously mentioned.
2.2.4 Critical Attachment Angle Switching
Wilson (11) and Foster and Jones (10) indicate that
Bourque and Newman's (6) works on the attachment angle, see
fig. (10), leads to one of the most important parameters in
jet switching. This angle controls the amount of flow returned
to the attachment bubble and, thus indirectly dictates the
amount of control flow required to switch the main jet. Con
13
of attachment angle correspondingly decreases the amount
of control flow required for switching. This mechanism for
switching can occur after a short burst of control flow.
The bubble is left in a condition such that i t ’s growth is
self-sustaining,i.e .,the returned flow is greater than the
entrained flow. This is often called rapid switching.
2.2.5 The Three Usual Modes for Switching
Depending upon the conditions under which the ampli
fier is operating three common modes of switching are:
i) Slow switching: as this requires the least
control flow it was the only mode examined by
Muller (5), Savkar, Hansen and Keller (4) and
Lush (3)- Wilson (11) summarizes their des
cription by explaining that a low value of the
control flow is used to primarily cause termin
ated wall or bleed switching, augmented by
splitter and contacting both walls switching.
During the whole process until separation
occurs the angle of attachment is increasing,
ii) Rapid or Momentum switching: this was only
described by Wilson (11) who states that if
a control pulse of sufficient strength is
attachment angle will be exceeded, hence the
switching process may continue even if the
control flow is shut off.
iii) Load switching: is explained by Foster and
Jones (3) as a separation of the jet beyond
the reattachment point. With increasing back
pressure on the active leg the separation point
approaches, and eventually reaches the position
of reattachment which causes the separation
bubble to be vented and hence switching occurs.
2.3 The Switching Time
Switching time is defined, b y Savkar, Hansen and
Keller (4), as the time elapsed between the initiation of
the control pulse and the attainment of a steady state flow
signal as measured b y a flow sensor in the output channel.
Their definition is incomplete as the location of the flow
sensors to detect the main and control flows must be accur
ately described. Savkar, Hansen and Keller (4) used water
flowing through a large scale model and a thermistor placed
in the output leg to measure the switchtime. They showed
that switching time decreased with increasing control pulse
15
initiate switching. By performing a similar experiment
Muller (5) measured the time for the main jet to be re
leased from the active wall. He combined this time with the
time taken for the maximum pressure of the main flow to
be detected at the receiver in the previously passive leg,
to give the switching time. From these experiments he con
cluded that the switching time decreased with increasing
control flow and that a minimum switching time existed
for the particular fixed geometry of his amplifier.
Lush (3) used a large scale model with constant
parameters and air as the fluid. In order to measure the
time for the main jet to move from one output leg to the
other he placed pressure transducers in the output legs, on
the point of the splitter and at various points along the
attachment walls. The initiation of the control pulse was
measured from a pressure transducer placed in the control
line. By recording these readings on an ultra-violet recorder
he was able to determine the same quantities as the above
two w o r k e r s .
It is meaningless to compare the results of these
three experimenters with each other as in each case the geom
etries differed considerably. Where possible an attempt has
been made to correlate their results with those of the present
2.4 Effects of Three of the Parameters on the Switching
Mechanism
2.4.1 Setback
The generally recognized fact that reducing the
setback has the effect of decreasing the minimum control
flow required to switch a bistable amplifier has been ex
perimentally proved by Savkar et al (4), Foster and Jones
(lo)
and Moses and McCree (12). Kirshner (1) explains thisas the effect of reducing the setback gives rise to a smaller
separation bubble and a movement upstream of the reattachment
region. The latter result has the effect of increasing the
flow returned to the separation bubble and hence less control
flow will be required to fill the now smaller separation
bubble. Foster and Jones ('10) showed that when the setback
was increased beyond a value equal to the throat width of
the main jet, then the control flow required to switch will
begin to gradually reduce. This is due to the ease of
det-tachment of a jet from a distant wall, but this would lead
to instability in a fluidic device.
2*4.2 Main Flow Rate
Foster and Jones (10) examined the effects of vary
ing the main flow rate. Their general conclusion was that
17
bubble and therefore decreased the relative flow required
to switch. Muller (5) using an amplifier with much lower
setbacks found that as the Reynolds number increased the
relative flow required to switch increased. He gave no ex
planation of this but the difference in results probably
occurs due to a difference in geometry and hence flow pattern
inside the amplifier.
2.4.3 Back Pressure
The only persons to have studied this, Foster and
Jones (10), concluded that the relative flow required to
switch decreased with increasing back pressure. Their ex
planation of this is similar to L u s h ’s (3) for load switching
as given in section 2.2.5 (iii).
2.5 The Effects of the Three Parameters on the General
Operation
It is generally recognized b y most of the afore
mentioned workers that changing the setback b y a small a m o u n t ,
when the setback to nozzle width ratio is low, has a
neglig-able affect on both the pressure and flow recoveries.
There exists a minimum main nozzle Reynolds number
below which the amplifier will not operate, i.e.# attachment
The effect of increasing the back pressure is to
reduce the entrained flow in the passive leg. A further
increase in back pressure will reduce the entrained flow
to zero and then result in spillover of the main jet into
the passive leg. It is obviously undesirable to increase
the back pressure much further as the resulting spillover
into the passive leg will reduce the hysterisis effect upon
19
CHAPTER III
EXPERIMENTAL EQUIPMENT
The apparatus is shown in schematic diagram in
Fig. 11 and an overall view is given in Plate 2. The
following sections are all discussed with reference to these
two illustrations.
3.1 Air Supply and Main Flow Measurements
The main flow air through the appratus was supplied
through a one inch pipeline from the building service, which
was capable of providing 15 s.c.f.m. at
80
p.s.i - 5 p.s.i.It was first passed through a
982
x C Trerice pressure reducer which had an output range of 10-»50 p.s.i. and then
through a similar reducer with a range of 0 - 20 p.s.i.
Pressure gauges were situated downstream of the reducers to
record the pressure entering the second reducer and to ensure
that the output of the second reducer was free from any
pressure variation, A typical output pressure from the re
ducers was 5 p.s.i. with no measurable fluctuation.
The main flow rate could be varied b y means of gate
valve No. 1 and measured b y the venturi flowmeter which
was calibrated in situ with a Blackwell 4l5 gas meter.
3.2 Settling Chamber and Bellmouth
was designed to have a maximum air velocity of 50 ft./min.
This resulted in a chamber 12" in diameter. At the inlet
end of the chamber a 3" diameter baffle was placed to spread
the fluid evenly over the area of the tank. The chamber was
made
26
" long so that the two wire mesh screens could be placed6" and 10" downstream of the baffle to dampen some of the
turbulence out of the flow. To further assist in obtaining
laminar flow in the nozzle of the amplifier the 6" diameter
outlet of the tank was reduced down to 1 1/2" diameter alumin
ium pipe by a plexiglass bellmouth.
A statis pressure tap was located at the top of the
settling chamber.
3.3 The Bistable Amplifier and its Instrumentation
The flow channels of the amplifier were formed by
bolting 1" thick pieces of plexiglass to a 1/2" thick plexi
glass base plate. With a nozzle width of 1/4" the aspect
ratio of the amplifier is 4:1. This figure was chosen from
the discussion given b y Poster and Jones (10) on the effects
of aspect ratio on a jet wall. They concluded that with an
aspect ratio of 4;1 or above, the effects on the internal
flow of the boundary layer, forming on the top and bottom plates
of the flow channel can be ignored.
21
given in Plate 3 and a view of the assembled pieces covered
b y the 3/8" thick plexiglass top is given in Plate 4.
The angle of inclination of the attachment wall,
12°, and the location of the splitter, 5 to 6 nozzle widths
downstream of the nozzle exit, were taken from information
given by SarJ?kaya (13). He studied the effects of these
two parameters on the gain of a bistable amplifier and con
cluded that the values given above were the optimum.
The walls of all the channels were machined to a
smooth finish to prevent any disturbance of the flow. Also
any interfaces were machined smooth and smeared with silicone
grease to prevent leakage.
The square inlet to the nozzle was bored out with
a conical tool to provide a 1 1/2" diameter inlet which could
be coupled to the aluminium flange from the plexiglass bell
mouth. This provided a smooth transition from the circular
aluminium tube to the square channel of the amplifier inlet.
To assemble the amplifier the segments were bolted
loosely to the base plate with bolts passing through over
sized holes in the segments. By placing gauge blocks of the
correct thickness in each of the channels, and pushing the
segments against these blocks before tightening the segments,
The dimensions of the amplifiers were chosen
by-scaling up approximately by a factor of ten a Bowles
Engineering Corporation Flip Flop B-
207
-A. The main jetnozzle width of this is 0.023" with a control channel
width of 0.015". The maximum flow recommended for normal
operation is 0.4 s.c.f.m. which produces a Reynolds number
at the throat of 19,000. For the amplifier used in this
investigation a throat width of 0.25" was chosen with a
Reynolds number range of 12,500 to 30,000. The control
channel width was 0.125".
The setbacks used were 0, 15,30 and 45 thousandths
of an inch which would provide machineable dimensions when
scaled down by a factor of ten. These values also served
to extend the setback range examined by Foster and Jones (10).
The oversized bolt holes mentioned above allowed sufficient
movement of the segments to acheive this setback range.
The outlets from the legs of the amplifier were
1 1/2" long by 1" diameter aluminium flanges bolted onto
the output ports as shown in Plate 4.
The inputs for control flow were flanges, of the
same dimensions as above, bolted to the lower side of the
1/2" thick plexiglass base. During all the experiments one
fed a pulsed flow of air to acheive switching. The pulsing
of control flow, obtained from a compressed air bottle and
pressure reducer, was acheived b y means of a rotating disc
with a slot cut in it. The disc was driven by a Dodge
S.C.R. 3/^ H.P. motor, the speed of which was varied b y a
Dodge S.C.R. speed controller. In order to reduce the speed
still further a Dyna minidrive speed reducer was used. The
pressure reducer on the outlet of the compressed air bottle
was used to vary the volume of control flow entering the
control channel. The disc intercepted the control line, either
closing the control line completely b y forming a seal between
the atmosphere and the control channel with the solid part
of the disc, or allowing a control flow to pass through the
slot in the disc into the control channel. In all the exper
iments the speed of the disc was set to produce a control
pulse which would last during the whole switching process.
A Disa type 55a53 miniature hot wire probe was
mounted 2 3/^ nozzle widths away from the nozzle exit in the
control channel to record the initiation of the control pulse.
It was calibrated against a wet test flowmeter and a Brooks
0-3 s.c.f.m. rotameter to measure the control flow. A similar
hot wire was placed 42 nozzle widths from the nozzle exit
in one of the output legs to record effects of flow in this
of a Disa type 55D50 Anemometer. A constant current gener
ator in the instrument heats the wires at the probe tips.
A flow of air passing over the wire will cool it resulting
in a change in electrical resistance. The probes actually
constitute one arm of a Wheatstone bridge.
The voltage across the probes is measured on the
bridge and given out at the output terminal of the Anemometer.
The difference in time between the first resistance changing,
due to control flow and the second, due to output flow was
measured b y displaying the output from the anemometer
on an oscilloscope screen. The trace on the oscilloscope
screen was triggered b y an electrical pulse_,given out just
before the slot in the disc opened the control channel to
the compressed air source. This was acheived b y positioning
two wires close to the circumference of the rotating disc.
A bolt was screwed into the circumference of the disc so that
as it passed the two wires it would momentarily complete the
triggering circuit. There is no concern over the time responses
of the apparatus used as both wires are in series in the same
arm of the Wheatstone bridge. Plate 3 shows two bleed channels
located at the end of the attachment walls. It was found
that a large amount of air was exiting from these bleeds due
to the fact that they had been located too far upstream.
switching of an unvented bistable amplifier.
As shown in Fig.29 static pressure taps were
located throughout the apparatus in order to study the flow.
To examine the effects of back pressure a 12" b y 7"
diameter tank was connected to each output leg. At the exit
of these tanks a 2 3/^" diameter rubber hose was connected.
These could be clamped down in order to reduce the output
area and hence increase the loading on the amplifier. Three
static pressure taps were spaced equally around the circum
ference of the drum to give a true measure of total pressure
unaffected b y the direction of the flow inside the tanks.
All the static pressure taps were connected to a
o
o
bank of manometers which could be inclined from
19
to90
CI-IAPTER IV
EXPERIMENTAL PROCEDURE
4.1 Calibration
The venturi flow meter was calibrated by connecting
a Blackwell 4l5 gas meter in the line between the venturi
and the settling chartiber. The relationship between main
flow rate and the manometer reading from the venturi is
shown in Fig. (12). A calculation was performed as recommend
ed in Ref. (14) and there was a good agreement with Fig. (12).
The control flow was calibrated by connecting a rota
meter in the control line, which was at no point left open
to atmosphere during the calibration. A graph was plotted,
Fig. (13), of the output.of the anemometer, as read on the
oscilloscope screen, against the various levels of control
flow read from the rotameter. To complete the lower portion
of the curve a wet-test gas meter was used for a higher
accuracy.
4.2 Setting the Geometry of the Amplifier.
The plexiglass segments which formed the channels of
1"
the amplifier were assembled on the base plate. A -jj- thick
gauge block was placed between the walls forming the nozzle.
1"
Two -g thick gauge blocks were placed in the control channels.
The segments forming the nozzle and the wall pieces were then
27
in place. This produced a model with a setback of zero. For
the other values shims of either 15,30 or 45 thousandths of
1"
an inch thickness were placed on either side of the gauge
block at the nozzle exit. The wall pieces were then set
back a known distance, i.e.,0,15,30 or 45 thousandths of an
inch from the line of the nozzle wall.
The wall pieces had been accurately machined to be in
clined at 12° from the control channel walls. Gauge blocks
3"
•g thick were placed in each of the output legs to ensure that
the channels were of a constant width before the remaining
walls pieces were tightened.
4.3 Experiments Performed
Readings taken which departed from normal experimental
procedures are described below. A full list of all the ex
periments performed is given in Appendix C.
In order to measure the pressures in each leg while active
both control channels were closed to atmosphere. Readings were
then taken of the static pressures at ten locations, PgT
PS T H ’ PS1' PS 2 ’ Ps3 ’ and Ps 4 f° r an active left le9 and then
an active right leg.
The minimum control flow required to switch was measured
b y slowly increasing the flow rate of the pulsed control flow.
This procedure was repeated several times to ensure that the
minimum control flow necessary for switching had been found.
Using this value, a photograph, Fig. (l4a), was taken of the
switching pattern as displayed on the oscilloscope screen.
This was accomplished by opening the camera shutter before
the initiation of the control pulse and closing it after
switching was completed. Tri~x film was used with the aperture
set at f 5.6.
The upper curve in Fig. (l4a) shows the hot wire in the
control channel being affected by the control flow alone.
The hot wire in the left output channel was, at this time,
measuring the constant main flow passing by it and was unaffected
by the addition of the relatively small control flow. The
control flow was then recorded as the distance between the
two parallel lines, Fig.(l4b), is proportional to the control
flow as shown in Fig. (13)• This was measured by projecting
the negative onto a screen and measuring the distance as shown
on the enlarged image, the enlargement factor being known.
The switching time produced by this control flow was
measured from the lower curve. Again, by projecting, the
distance is measured from the initiation of the control pulse
to the point of switching. With the sweep rate of the oscillos
29
Figs. (l4b) - (l4d) explain this switching pattern.
Fig. (l4c) shows the pattern produced during switching b y the
hot wire in the left leg. Initially there is entrained fluid
in the left leg which is represented by the horizontal portion
of the trace. During switching this entrained fluid is reduced
and then has its direction reversed by the main flow which is
beginning to flow down the left leg. The dip in Fig. (l4c)
represents initially a reduction in the output from the ane
mometer and then an increase due to the main flow having an
increased cooling effect on the hot wire. The latter signal
meant that the amplifier had switched.
For each value of control flow used three negatives were
taken of the switching pattern to give more confidence in the
r esults.
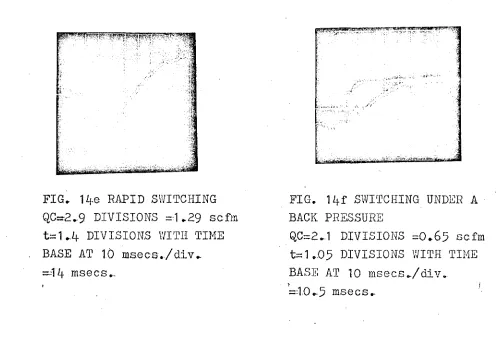
To illustrate the switching pattern produced by rapid
switching Fig. (l4e) is included.
The result on the main flow rate of increasing the back
pressure was determined by reducing the area of the outlets
of the back pressure tanks. This experiment was then repeated
measuring the values of static pressure as tabulated in
Appendix
c,
Series No.21 - 27
to determine the effect ofback pressure on the internal pressures.
with the back pressure on the amplifier being measured by
the static pressure at Pg^- For the reason given in section
5.9, the back pressure was then recorded by measuring the
static pressure in the back pressure tanks. As the velocity
of the air in these tanks was low, this gave the value of
CHAPTER V
RESULTS AND DISCUSSION OP RESULTS
5.1 Pressures in Legs When Active
The values of the total pressures calculated from
the recorded static pressures were plotted, as shown in
Fig. 15, to determine whether there was an equal resistance
to the flow by each output leg. A maximum difference in
pressures occurs in the 6.4 s.c.f.m. flow rate. At this
flow the difference in pressure produced by the flow in
the left and right legs at static pressure tap number two
was b$> of the total pressure at that point. This and the
other small differences between the left and right channel
values are due to the fact that the area of each of the
outputs legs is slightly different.
It was considered that this difference in the resis
tance to the flow of each leg was not large enough to affect
the switching properties of the amplifier.
5•2 Effect of Setback and Main Flow Rate on the Minimum
Control Flow Required to Switch
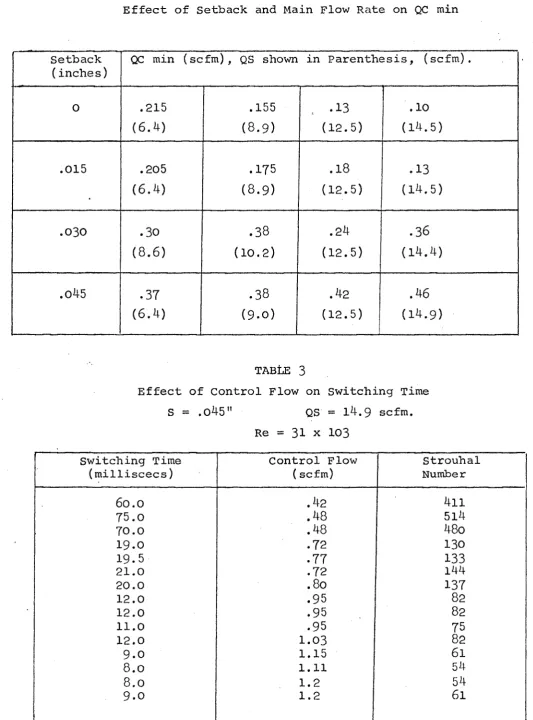
In Fig. l6 the curves for constant setback demonstrate
the effect of the main flow rate on the minimum control flow
required to switch the amplifier. At the low main flow rate
the minimum control flow required for switching is higher
fore any change in the conditions around the separation
bubble will have a noticeable affect on the control flow
required to expand the bubble to cause switching. As the main
flow rate increases the fluid entrained from the outer edge
of the bubble increases. In order to return to a steady
state condition the returned flow to the bubble at the point
of reattachment must increase. This can only be accomplished
by an increase in the angle which the reattaching streamline
makes with the wall. With the separation bubble in this
condition a relatively lower control flow is required to
commence switching as the reattachment angle of the stream
line will soon reach the value at which dettachment of the jet
o c c u r s .
As the setback increases the control flow required
to switch the amplifier increases for any given flow rate.
This is due to the fact that with increasing setback the
size of the separation bubble also increases. Hence more
control flow is required to expand the bubble for the mech
anism of slow switching to occur.
Foster and Jones (10) using an apparatus with a
33
was required to switch the amplifier, as shown in Fig. 16.
They also found a reduction in relative control flow required
to switch with an increase in the main flow rate.
Using values of QC min/QS from Fig. l6 for the same
Reynolds number at which Foster and Jones operated their
4
amplifier Re = 2 x 10 , Fig. 17 was plotted. It shows that
with a reduction in setback the minimum control flow required
to switch reduces.
5.3 Effect of Control Flow on Strouhal Number
The various values of control flow produce the diff
erent switching times as shown in Appendix A table (3). The
time is expressed as the non-dimensional Strouhal Number and
plotted against the control flow in cubic feetper minute of
air as shown in Fig. 18.
The lowest control flow QC min, at which the amplifier
will just switch gives a wide range of switching times. With
this value of control flow slow switching occurs. This mode
of switching results in an unsteady flow condition and there
fore the wide variation in switching times measured with this
value of control flow can be expected.
As the control flow is increased the switching time
is seen to decrease. The added momentum of the jet assists
in moving the jet across the interaction region, as well as
the separation bubble is larger but the flow returned to
the bubble from the point of reattachment is larger. There
fore with this increased control flow a shorter time will
elapse before the jet dettaches from the wall and the ampli
fier switches.
With a further increase in control flow the switching
time is seen to reach a constant value. This is explained
b y the fact that rapid switching is occurring in which the
important factor affecting the switching time is the ratio
of the momentum of the main jet to that of the control jet.
At very high values of control flow the main jet is blown
from the active leg to the passive leg. When the main stream
velocity is 100 ft/sec the distance it has to travel, after
switching, along the passive leg before it will have any
effect on the hot-wire in the output leg is approximately
ten inches. This would take 10 milliseconds to occur and
therefore a shorter switching time cannot be produced with
this apparatus at the main stream velocity mentioned. As
is shown in Table 4 increasing the main flow rate reduces
the minimum switching time.
The switching time produced by any value of control
flow between approximately 0.6 and 0.8 s.c.f.m. results due
35
unadvisable to operate an element at this condition as with
a small change in control flow the switching time will change
drastically.
If an accurately defined value of control flow is
available and the switching time of the amplifier is of no
consequence then the most economical value to use will be
QC min, i.e. approximately 3-5^ of Q S . If, however, the
switching time is to be a minimum then the smallest value
of control flow which will produce this is approximately 6fo
of QS.
Lush obtained the results as shown in Fig. 19 using
a bistable amplifier with a much larger setback and a Reynolds
4
number of operation of 9 x 10 . The values for the control
flow are drastically different to those of the present in
vestigation which is probably due to a large difference in
control channel width, and other geometrical variations. Fig
ure
19
does, however, present an indication of the shapeof the control flow v switching time curve which agrees with
that of the present investigation.
5.4 Effect of Main Flow Rate on Switching Time
For a setback of zero the control flow v switching
time curves for four different main flow rates are shown in
propogates more quickly with a higher main flow rate as
explained in Appendix B, section Bl. The influence of
the Coanda effect from the unattached wall, after the jet
has been initially inclined, will also be stronger with a
higher main flow rate. This is because the fluid is en
trained away from the low pressure region at a faster rate,
thus in a shorter time a force sufficient to move the jet
away from the attached wall will be produced. These results
prove that switching with a high control flow is not purely
a momentum effect, otherwise the minimum switching time
would increase with the increasing ratio of momentum of
main jet to momentum control jet.
5.5 Effect of Setback on Switching Time
For a low value of control flow the switching time
decreases with decreasing setback for a given control flow
as shown in Fig. 21. This is because an amplifier with a
small setback requires less control flow for switching as
explained in section 5.2.
When switching with a high value of control flow
then rapid switching is occurs and the size of the separa
tion bubble is relatively unimportant. It would therefore