Segmentation Quality Prediction Based on
Reverse Classification Accuracy Method in the
Absence of ground Truth
Varsha E. Jaware 1, Rajesh H. Kulkarni 2P.G. Student, Department of Computer Engineering, JSPM Narhe Technical Campus, Pune, Maharashtra, India1
Associate Professor, Department of Computer Engineering, JSPM Narhe Technical Campus, Pune, Maharashtra, India2
ABSTRACT:Segmentation of Magnetic Resonance Imaging (MRI) and Computed Topography (CT) scan images in medical analysis, especially brain , plays a vital role to inform major decisions of a particular disease. It is important to be able to detect when an automatic method fails to avoid inclusion of wrong measurements into subsequent analysis which could otherwise lead to incorrect conclusion. Sometimes due to absence of Ground Truth (manually labeled) (GT) images it is difficult to detect the failure of automatic segmentation methods. Before deployment, performance is quantified using different metrics. In some exceptional cases it becomes difficult to know about its real performance after deployment when a reference is unavailable. To that end, this work aims to develop an improved and advanced technique of Reverse Classification Accuracy (RCA) on new data which enables us to discriminate between the successful and failed cases. Segmentation quality, performance and failure are assessed by considering the evaluation metrics like Hausdorff distance (HD) and Average surface distance (ASD) and novel Random Forest algorithm for Classi_cation purpose. Further, for correctly and accurately segmented and classified brain MRI and CT scan images, early stages of Alzheimers disease (AD) are being detected using Random forest algorithm.
KEYWORDS:Machine Learning, Image Segmentation, classification, Ground Truth, Random Forest, Mild Cognitive Impairment, Alzheimer's disease.
I. INTRODUCTION
Fig. 1. A segmented image of femur bone
Traditionally segmentation performance was evaluated by randomly selecting a dataset for whom a manually labeled segmented image was obtained. It was then compared to the automatic one. In order to solve segmentation problems, different methods were proposed based on statistical models [2], multi-atlas label propogation [3]and supervised classification [4]. MRI is generally more sensitive in detecting brain abnormalities during the early stage of disease and is excellent in early detection of cases of tumors, Alzheimer’s disease etc. A very common form of dementia known as Alzheimer’s disease.
Motivation to the above observations ,we in this paper improvised RCA model for reverse testing and extending further to detect AD in correctly classified brain images. Mild cognitive impairment (MCI) is generally considered o be an intermediate state between healthy aging and AD, which is hardly severe enough that it could disturb with daily life routines. Despite of the fact that not all MCI subjects develop to AD instead for many years it can remain cognitively stable. Generally there is no well versed accepted cure for AD, but
there are several treatments that exists for delaying its course. However, taking into consideration it is very important to perform early diagnosis and detect the MCI subjects that are likely prone to be an imminent risk of conversion to AD. The recently emerged concepts of Machine learning and pattern recognition algorithms have been proven to precisely classify AD patients and healthy controls (HC) and further differentiate between stable MCI (sMCI) subjects and progressive MCI (pMCI) that could be converted to AD in future. Among all ensembles approaches it was discovered that Random Forest (RF) [5] produced the best accuracy results in many scientific fields. Finally, to solve this challenge of segmentation field, an improved method for estimating the real segmentation performance after deployment in the absence of GT and further classification of brain images to detect the presence of AD in them is being proposed.
II. RELATED WORK
In many domains from graphics, remote sensing to marketing strategies, it has become difficult to retrieve an objective performance evaluation without GT. The lack-of-label problem has been tackled by exploiting transfer learning in [5] using a reverse validation procedure when the number of labeled data is limited in the general machine learning domain. The basic idea of reverse validation [5] is based on reverse testing [6] new proposed classifier is initially trained on prediction of the test data and later evaluated on Training data. This thought of reverse testing is closely related to the approach of RCA in [1].
Various fields like graphics, remote sensing areas to well versed marketing designing, there has always been a difficulty in estimating performances on the lack of GT. The ideal concept of validation in a reverse manner [5] relies on reverse testing [6] recently proposed classifier is initially given prediction training on the test data and later figured out on Training data. The segmentation performance is evaluated by several tasks like separating the perceptual salient structures [7], automatically generating semantic GT [8], [9] or by observing at contextual properties [10].A method for analyzing precision an objective metric and also recall on lack of GT is proposed but it failed with data sets that had partial GT as probabilistic model approach is used. System proposed by [11] used region-correlation matrix to quantify the performance of various segmentation algorithms.
information, neuropsychological tests, cerebrospinal fluid (CSF) bio markers, and brain imaging data are considered for the initial diagnosis procedure of AD. The changing rate of
these variables represents an extended source of knowledge for detecting AD by assessing the risk factor of conversion from MCI. Traditionally single classifier method was used but did not give the desired results. Thus an ensemble classifier [12] with Merit Merge feature selection is applied to enhance the efficiency of classification in a multivariate multiclass medical data for effective disease diagnostics. The large volumes of features extracted from brain Magnetic Resonance Images and neuropsychological tests for diagnosis lead to more complexity in classification procedures. A higher level of objectivity than what readers have is needed to produce reliable dementia diagnostic techniques. A consistent trajectory during pathogenesis of the disease is followed by AD, and the very first changes can be detected very early before the disease manifests clinically. These findings have fuelled clinical interest in the use of specific imaging markers for Alzheimer’s disease to predict future development of dementia in patients who are at risk [14]. Ensemble approach which is trained with features selected from multiple bio markers facilitated accurate classification when compared with conventional classification techniques.
Different Ensemble approach for feature selection can be experimented with classifiers like Nave Bayes, Random forest, C4.5 and Support Vector Machine. The proposed system uses Random forest algorithm which is a group or ensemble of Classification and Regression Trees (CART) [11]. Although among all ensembles approaches Random Forest produces the best accuracies in many scientific fields and other neurological diseases.
III. SYSTEM OVERVIEW
A system framework aimed to assess the performance of the segmented images in a reverse manner has helped to solve cases where there is no reference available to compare with. RCA in [1] is applied to estimate the segmentation quality by using one of the specific segmentation method like Multi Atlas, Single Atlas or Random Forest. RCA model was applied with Single Atlas, Constrained CNN and Atlas Forest. But among those algorithm Constrained CNN failed to give a high accuracy as compared to Single Atlas and Atlas Forest. This model worked well on large body organs like brain, stomach, liver, pelvis and but estimated less accuracy for smaller organs like spleen, adrenal glands and clavicles. System has two phases, mainly segmentation phase and then comparing it with the reference database for predicting the accuracy in a reverse manner. The supposition mentions that the RCA classifier which is trained using predicted segmentation that acts as pseudo GT, worked well if the segmentation quality was high for a new image. Similarly, if the segmentation quality revealed to be poor then it would poorly perform on the reference images. Considering the scenario that in cases of absence of GT images, it becomes difficult to analyze the segmentation performance. It is also necessary to check when the automatic segmentation method fails RCA has the advantage of allowing to predict the accuracy for each individual case and also allows drawing conclusions for the overall performance of a particular segmentation method.
RCA Model:
The RCA framework is based on the thought of training reverse classifiers on individual images utilizing their predicted segmentation as pseudo GT. In this system three different methods for RCA classifier along with combination of different segmentation methods. Fig.2 shows the detailed architecture of the RCA framework.
Consider the segmentation result of image I, called Si. A segmentation Si is obtained, by training a chosen algorithm with reference database (for which GT is available). Unfortunately for this image no GT is available, thus there is no real accuracy. Hence RCA classifier is used for that. RCA classifier is trained using the result of segmentation Si. Then test back to the reference database to obtain the segmentation. From those segmentation in the reference database, since GT is present calculate the accuracies. The final prediction accuracy of Si by RCA, is the maximum accuracy of the segmentation present among the reference database.
Segmentation phase: In this step, segmentation of MRI images of organs like brain, liver, lung, etc. is done using Single Atlas, Multi Atlas and Convolution Neural Network (CNN).
Reference Database: For storing images two partitions of database named as Training and Testing database. Absence of GT is only for Testing database (which we wish to predict using the RCA). To get the segmentation on testing database, reference (Training) database to train a classifier. This training database has GT, which is used to train and segment testing database and also to predict the segmentation accuracy using improved RCA model. Fig. 2 describes the architecture of the proposed RCA model.
Disease Detection Phase: Further, in correctly classified brain images from the RCA model, the presence of disease like AD is detected by observing the early prediction stages.
Fig.2 Architecture of the Proposed System
Steps to be Carried
Step 1: Initially segment the MRI and CT scan images for which GT is absent.
Step 2: The segmented image obtained from previous step is then applied to RCA Model. Step 3: RCA Model then Classifies those segmented images and predicts its accuracy. Step 4: Further correctly classified Brain images are used for AD disease detection. Step 5: Using Random Forest algorithm the presence of disease is detected.
IV. PROPOSED ALGORITHM
A. Classifier Algorithms:
Random Forest, Multi Atlas and CNN method are used for Segmentation Phase. RCA model includes Single Atlas, Atlas Forest and Constrained CNN methods for classification.
a) Atlas Forests:
as they naturally handle multi-class problems and are computationally efficient. They do not (necessarily) require preregistration of the images neither at training nor testing time, since they operate as voxel-wise classifiers. Registering location probability maps to each atlas and new image, is not a general requirement for using AFs to encode atlases. In fact, the way AFs are employed within RCA framework does not require any image registration. The forest-based RCA classifiers were trained all with the same set of parameters of maximum depth 30 and 50 trees. Atlas Forests give high accuracy in this work for RCA model.
b) Deep Learning:
CNNs is also used as one of the RCA classifiers. A Deep Medic is utilized for a 3D CNN architecture for automatic segmentation [21]. The architecture is computationally efficient as it can handle large image context by using a dual pathway for multi-scale processing. CNNs are able to learn highly complex and discriminative data associations between input data and target output. The architecture of the network is defined by the number of layers and the number of activation functions in each layer. In CNNs, each activation function corresponds to a learned convolutional filter, and each filter produces a feature map (FM) by convolving the outputs of the previous layer. Through the sequential application of many convolutions, highly complex features are learned that are then used to produce voxel-wise predictions at the final, fully-connected layer. CNN shows less accuracy as compared to the other Atlas forests and Random Forests.
c) Atlas-based label propagation:
The third approach considered is atlas-based label propagation. Label propagation using multiple atlases are used to on many segmentation problems [3]. A common procedure in multi-atlas methods is to use non-rigid registration to align the atlases with the image to be segmented and then perform label fusion strategies to obtain predictions for each image point. Multi-atlas methods are based on registration but are not strictly voxel-wise classifiers as they operate on the whole image during registration, the final stage of label fusion can be considered as a voxel wise classification step. An approach that has been originally developed in the context of segmentation of cardiac MRI [22] is used. For the purpose of RCA, however, there is only a single atlas and thus no label fusion is required.
d) Random Forest:
Random Forests grows many classification trees. Each tree is grown as follows:
I) If the number of cases in the training set is N, sample N cases at random but with replacement, from the original data. This sample will be the training set for growing the tree.
II) If there are M input variables, a number m is specified such that at each node, m variables are selected at random out of the M and the best split on these m is used to split the node. The value of m is held constant during the forest growing.
III) Each tree is grown to the largest extent possible. There is no pruning.
B. Mathematical Model:
Equation of a proxy measure for predicting the segmentation accuracy is as follows, where ρ is any evaluation metric, such as DSC, ASD or HD
*SI denotes the predicted segmentation that here acts as pseudo GT *I be an image that has been segmented by any segmentation method *Segmentation Function FI, SI (J) = SJ
*Image J which produces a segmentation SJ
V. RESULT AND PERFORMANCE ANALYSIS
A. Performance Metrics for Prediction Accuracy:
The Dices similarity coefficient is the most widely used measure for evaluating segmentation performance , and the main results in this study focused on how well the DSC, predicted good results using RCA framework. In order to quantify prediction accuracy, three different measures, namely the correlation between predicted and real DSC, the mean absolute error (MAE), and a classification accuracy were incorporated in this model. Arguably, the most important measure for direct evaluation of how well RCA works is the MAE directly reveals how close the predicted DSC is to the real one. Correlation is of great importance, as it conveyed a relation between predicted and real scores. Segmentation Failure Detection in clinical measures it is of great importance to be able to detect when an automated method fails. Low real DSC scores if obtained are correctly predicted and failed segmentations are identified from the score. It is important to exclude failed segmentations from the subsequent analysis as it leads to wrong results or conclusions.
The final results are represented in gist in Tab.1, where quantitative analysis of predicted accuracy is shown. We have used Single Atlas forest for Segmentation purpose and Random Forest as an algorithm for RCA analysis. The correlation achieved between the DSC's overlap based score of predicted and real values is good. We improvise the Distance based metric in this system as it resulted in low correlation, high value Mean Absolute Error(MAE) and low accuracy rate of classification in the previous system. Distance based errors are unbounded hence a threshold value is being set for HD and ASD which lays the boundary reference values for categorizing error rate. For HD the boundary reference values are [0,10]for good segmentation quality, [10,60] for medium segmentation quality, [60,150] for bad segmentation quality. ASD's reference boundary range is as follows [0,2], [2,5], [5,10] for good, medium and bad quality segmentation .For this experiment Single Atlas Forest or Atlas forest are used for segmentation and Random Forests as RCA classifier. The results are encapsulated in Tab I using Random
Forest (proposed) method.
Table 9.1: Predicting Different Segmentation Metrics for Random Forest(proposed)
Metric Correlation(%) MAE(%) Accuracy(%)
DSC 90 10 80
HD 25 35 40
ASD 25 3 40
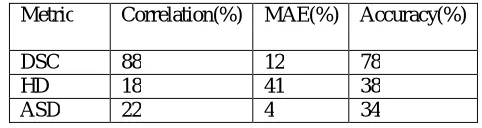
The results are summarized in Tab II using Atlas Forest (existing).
Table 9.2: Predicting Different Segmentation Metrics for Atlas Forest (existing)
Metric Correlation(%) MAE(%) Accuracy(%)
DSC 88 12 78
HD 18 41 38
ASD 22 4 34
For detecting segmentation failure Random Forest represents high value correlation, low value MAE and a good rate of classi_cation accuracy as compared to Single Atlas and Atlas Forest. Failed segmentations are correctly identifed by precisely correcting the low real DSC scores.
Table 9.3: Detecting Segmentation Failure using Random Forest (proposed)
RCA Classifier Correlation(%) MAE(%) Accuracy(%)
Random Forest (proposed)
89 9 95
Atlas Forest (existing)
85 9.6 88.4
Single Atlas (existing)
87 9.7 92.8
From the DSC,HD,ASD scores of different images a bar graph is being plotted. Fig.5 shows good quality image segmentation whereas Fig.6 shows bad quality segmentation. The bar plot are evaluated from 18 reference images stored in a database consisting of preserved GT in it for which good and bad quality segmentation is predicted. The bar plots shown above represents the example of abdomen images that predict the real value DSC in red color and predicted value DSC in Green color. The predicted value DSC in Green color is selected according to equation 1 that matches well with the real DSC. HD and ASD is also improved approximately around 10 to 20%
B. Summary:
An appealing property of the proposed framework is that unlike the supervised methods no training data is required that captures examples of good and bad segmentations. Instead, RCA simply relies on the availability of a reference database with available GT segmentations. The drawback, however, is that assumption of a linear relationship between predicted and real scores which should be close to an identity mapping, something only found in the case of using Single-Atlas label propagation. In the case of off-diagonal correlation, as for example found for Atlas Forests, an extension to RCA could be considered where the predictions are calibrated. This, however, requires training data from which a regression function could be learned. CNN show a very less accuracy level for classification as compared to Atlas forest and Single Atlas.
Table No. 1Detecting Segmentation Failure Using Random Forest
RCA Classifier Correlation MAE Accuracy
Random Forest
(proposed) 89% 9% 95%
Atlas Forest
(existing) 85% 9.6% 88.4%
Single Atlas
(existing) 87% 9.7% 92.8%
VI. CONCLUSION AND FUTURE SCOPE
proves to be a boon for integrating it into an automatic processing pipelines when used in clinical routine study. It is of vital importance in case of large scale analysis to study the detection of failed segmentation images as there is no feasibility in employing manually assisted quality control along with visual inspection. Further detection of AD in such cases is also done that proves to be a time saving analysis.
In future the proposed system may try to find out liver disorders after correctly classifying liver images from RCA model.
REFERENCES
1. Vanya V. Valindria, Ioannis Lavdas, Wenjia Bai, Konstantinos Kamnitsas, Eric O. Aboagye,Andrea G. Rockall, Daniel Rueckert, and Ben Glocker, “Reverse Classificaton Accuracy: Predicting Segmentation Performance in the absence of Ground Truth,” IEEE Transactions on Medical Imaging, Vol. 36, No. 8, August 2017.
2. T. Heimann and H.-P. Meinzer, “Statistical shape models for 3D medical image segmentation: A review]” Med. Image Anal., vol. 13, no. 4, pp. 543563, 2009.
3. J. E. Iglesias and M. R. Sabuncu, “Multi-atlas segmentation of biomedical images: A survey” Med. Image Anal., vol. 24, no. 1, pp. 205219,2015.
4. E. Geremia et al., “Classification forests for semantic segmentation of brain lesions in multi-channel MRI” in Decision Forests for Computer Vision and Medical Image Analysis. London, U.K.: Springer, 2013, pp. 245260.
5. E. Zhong, W. Fan, Q. Yang, O. Verscheure, and J. Ren, “Cross validation framework to choose amongst models and datasets for transfer learning” in Proc. Joint Eur. Conf. Mach. Learn. Knowl. Discovery Databases, 2010, pp. 547562.
6. W. Fan and I. Davidson, “Reverse testing: An efficient framework to select amongst classifiers under sample selection bias,” in Proc. 12th ACM SIGKDD Int. Conf. Knowl. Discovery Data Mining, 2006, pp. 147156.
7. F. Ge, S. Wang, and T. Liu, “New benchmark for image segmentation evaluation,” J. Electron. Imag., vol. 16, no. 3, p. 033011, 2007.
8. L. Goldmann et al., “Towards fully automatic image segmentation evaluation,” in Proc. Int. Conf. Adv. Concepts Intell. Vis. Syst., 2008, pp. 566577.
9. H. Li, J. Cai, T. N. A. Nguyen, and J. Zheng, “A benchmark for semantic image segmentation”,in Proc. IEEE Int. Conf. Multimedia Expo, Jul. 2013, pp. 16.
10. K. Sikka and T. M. Deserno“Comparison of algorithms for ultrasound image segmentation without ground truth”, Proc. SPIE, vol. 7627,pp. 76271C176271C9, Feb. 2010.
11. Leo Breimen,“Random Forest”,2001.
12. K.Yogeswara Rao, M.James Stephen, D.Siva Phanindra,“Classification Based Image Segmentation Approach”,IJCST, Vol 3, Issue 1,2012. 13. Xiaofeng Ren and Jitendra Malik,“Learning A Classification Model for Segmentation”.