ABSTRACT
LEKSRISOMPONG, NIRADA. Effect of temperature during incubation and brooding on broiler chickens. (Under the direction of John T. Brake)
A series of experiments was conducted to study the effects of the interaction between incubation and brooding temperature on chicks and early broiler performance. Braun Thermoscan infrared thermometer methodology was used to measure internal egg temperature. Ross 344 x 308 broiler hatching eggs were used exclusively and 53% relative humidity was maintained during incubation. During the first 13 or 14 d of incubation air temperature was 37.5-37.70C (99.5-99.80F) following which eggs were assigned to either a HIGH 39.5-40.60C (103.1-105.10F) or a NORMAL 37.7-37.90C (99.9-100.20F) temperature incubator (range varied by experiment).
Six experiments, in various manners, measured the effects of incubation temperature, brooding temperature, sex, egg size, and all possible interactions on body weight (BW) on day of hatching (0 d) up to 28 d of age as well as relative weights of tissues and organs from 0 d to 21 d of age. Certain experiments measured feed consumption, BW, adjusted feed conversion ratio (AdjFCR), and deaths at 0, 2, 5, 7, 12, 14, 21, and 28 d of age.
Feed consumption was decreased by increased incubation temperature at all ages but was increased by hotter brooding temperature during the 0-7 d period but decreased during the 7-14 d period. Hot-brooded chicks that had been incubated in the normal incubator consumed the most feed while cool-brooded chicks that had been incubated in the hot incubator consumed the least feed during the 0-2 and 0-7 d periods.
BW was significantly decreased by increased incubation temperature up to 21 d. Cool brooding increased BW more for normal incubated chicks than did hot brooding at 7 d of age. By 14 d the high incubation-hot brooding chicks were smaller than all other groups while the normal incubated-cool brooded chicks were larger than all other groups. Males with a combination of normal incubation temperature and cool brooding temperature exhibited heavier BW than males with a combination of high incubation temperature with cool brooding temperature while brooding had less effect on males from hot incubation and there was little differentiation among the females at 14 d of age.
EFFECT OF TEMPERATURE DURING INCUBATION AND BROODING ON BROILER CHICKENS
by
NIRADA LEKSRISOMPONG
A thesis submitted to the Graduate Faculty of North Carolina State University
in partial fulfillment of the requirements for the Degree of
Master of Science
POULTRY SCIENCE
Raleigh 2005
APPROVED BY:
V. L. Christensen J. W. Spears
BIOGRAPHY
iii ACKNOWLEDGEMENTS
The author would like to express her DEEP appreciation and thanks to Dr. John T. Brake who through his mentorship, constructive criticism, and friendship has contributed substantially to her professional and personal development in a manner that has extended far beyond the scope of the graduate degree program. Appreciation is also expressed to Dr. Jerry Spears and Dr. Vern Christensen for serving on the graduate committee and providing helpful criticism and insight.
iv TABLE OF CONTENTS
Page
L
IST OF TABLES ……….………...……….……….………. viiL
IST OF FIGURES ….…….……….……….………. xiiL
IST OF ABBREVIATIONS ……….………... xviI
NTRODUCTION …….……….. 1L
ITERATURE REVIEW …….……….. 3Factor Affecting Embryonic Growth and Development ……..……..………… 3
Organ Growth and Development .……….…….… 4
Effects of Hyperthermic and Hypothermic Incubation Temperatures ... 5
Temperature and Thermoregulatory Effects On Metabolism and Oxygen Dynamics ……… 9
Incubation Temperature Effects On Blood Oxygen Carrying Capacity and Hemoglobin-Oxygen Affinity ……..……….. 10
Development of Ascites ..………... 12
Metabolic and Physiologic Adjustments at Hatching …..……….. 14
Role of Hormones in Late Embryonic Development and Subsequent Brooding ……….……… 15
Nutrient Availability At Hatching ……....…………... 17
Factors That Affect Hatching Time and the Effect Of Delayed Removal of Chicks ………….……… 18
Brooding ……...…...……….……….. 19
Effect of Brooding Temperature on Organ Development ……...………... 22
v Page
M
ATERIALS AND METHODS 37Experiments 1 ……...……….………. 37
Experiment 2 and 3 …..………...……… 40
Experiment 4 and 5 ……..………...……… 43
Experiment 6 ……..………. 52
Experiment 7 ………..………. 56
R
ESULTS ……..………...…..………. 61Experiment 1 ……….………... 61
Experiments 2, 3, 4, 6, and 7 Concerning Organ Development ………... 61
Experiment 2 ……….………... 61
Experiment 3 …...………... 61
Experiment 4 ……...………... 64
Experiment 7 …...………... 64
Experiment 4 ……...………... 69
Experiment 6 …...………... 69
Experiment 4, 5, 6, and 7 Concerning Chick Growth ….…….... 69
Experiment 4 …...………... 74
Experiment 5 ………... 81
Experiment 6 ………... 102
Page
D
ISCUSSION …...……… 113Calibration ……...………... 113 Effects Of Incubation Temperature On Chick BW
and Organ ……… 114 Effect Of Incubation Temperature and Brooding Temperature
On Chick Growth, Feed Consumption, and Mortality …….…... 122
S
UMMARY AND CONCLUSIONS ……… 134R
EFERENCES ………. 136A
PPENDIX …..………. 140vii LIST OF TABLES
Page Results
Table R-1. Comparison of mercury thermometer temperature and infrared
thermometer temperature in Experiment 1……….. 62
Table R-2. Body weight and relative weights of tissues and organs from broiler chicks on day of hatching in Experiment 2 as influenced by incubation temperature, sex, and incubation temperature by sex interaction………. 63
Table R-3. Body weight and relative weights of tissues and organs from broiler chicks on day of hatching in Experiment 3 as influenced by incubation temperature, sex, and incubation temperature by sex interaction………. 66
Table R-4. Body weight and relative weights of tissues and organs from broiler chicks on day of hatching in Experiment 4 as influenced by incubation temperature, sex, and incubation temperature by sex interaction………. 66
Table R-5. Body weight and relative weights of tissues and organs from broiler chicks on day of hatching in Experiment 7 as influenced by incubation temperature, sex, and incubation temperature by sex interaction………. 67 Table R-6. Body weight and relative weights of tissues and organs from broiler
chickens at 14 d of age in Experiment 4 as influenced by incubation temperature, brooding temperature, sex, incubation temperature by brooding temperature
interaction, brooding temperature by sex interaction, and incubation temperature by
brooding temperature by sex interaction……….. 70-72 Table R-7. Body weight and relative weights of tissues and organs from broiler
chickens at 21 d of age in Experiment 6 as influenced by incubation temperature, brooding temperature, and incubation temperature by brooding temperature
interaction………. 73 Table R-8. Feed consumption of broiler chickens as affected by incubation
temperature, brooding temperature, sex, incubation temperature by brooding temperature interaction, brooding temperature by sex interaction, and incubation temperature by brooding temperature by sex interaction in Experiment
viii Page Table R-9. Body weight of broiler chickens as affected by incubation temperature,
brooding temperature, sex, incubation temperature by brooding temperature
interaction, brooding temperature by sex interaction, and incubation temperature by brooding temperature by sex interaction in Experiment 4……….………
78-80
Table R-10. Adjusted feed conversion ratio (AdjFCR) of broiler chickens as affected by incubation temperature, brooding temperature, sex, incubation temperature by brooding temperature interaction, brooding temperature by sex interaction, and incubation temperature by brooding temperature by sex interaction
in Experiment 4………... 82-84 Table R-11. Percentage mortality (deaths) of broiler chickens as affected by
incubation temperature, brooding temperature, sex, incubation temperature by brooding temperature interaction, brooding temperature by sex interaction, and incubation temperature by brooding temperature by sex interaction in
Experiment 4……….………. 85-87
Table R-12. Feed consumption of broiler chickens as affected by incubation temperature, brooding temperature, sex, incubation temperature by brooding interaction, brooding temperature by sex interaction, incubation temperature by sex interaction, and incubation by brooding temperature by sex interaction in
Experiment 5 ………. 89-91 Table R-13. Body weight of broiler chickens as affected by incubation temperature,
brooding temperature, sex, incubation temperature by brooding temperature
interaction, brooding temperature by sex interaction, incubation temperature by sex interaction, and incubation temperature by brooding temperature by sex interaction
in Experiment 5………. 92-94 Table R-14. Adjusted feed conversion ratio (AdjFCR) of broiler chickens as
ix Page Table R-15. Percentage mortality (deaths) of broiler chickens as affected by
incubation temperature, brooding temperature, sex, incubation temperature by brooding temperature interaction, brooding temperature by sex interaction, incubation temperature by sex interaction, and incubation temperature by brooding
temperature by sex interaction in Experiment 5……… 99-101 Table R-16. Feed consumption of broiler chickens as affected by incubation
temperature, brooding temperature, and incubation temperature by brooding
temperature interaction in Experiment 6……… 103 Table R-17. Body weight of broiler chickens as affected by incubation
temperature, brooding temperature, and incubation temperature by brooding
temperature interaction in Experiment 6………... 104 Table R-18. Adjusted feed conversion ratio (AdjFCR) of broiler chickens as
affected by incubation temperature, brooding temperature, and incubation
temperature by brooding temperature interaction in Experiment 6………... 106
Table R-19. Percentage mortality (deaths) of broiler chickens as affected by incubation temperature, brooding temperature, and incubation by brooding
temperature interaction in Experiment 6………... 107
Table R-20. Feed consumption of broiler chickens as affected by interaction
temperature in Experiment 7……….. 108 Table R-21. Body weight of broiler chickens as affected by incubation
temperature in Experiment 7………... 109 Table R-22. Adjusted feed conversion ratio (AdjFCR) of broiler chickens as
affected by incubation temperature in Experiment 7………. 111 Table R-23. Percentage mortality (deaths) of broiler chickens as affected by
incubation temperature in Experiment 7……… 112 Discussion
Table D-1. Number of pipped eggs and hatched chicks at E 20 of incubation,
x
Appendix A. Page
Table A-1. Body weight and gross weights of tissues and organs from broiler chicks on day of hatching in Experiment 2 as influenced by incubation temperature, sex, and incubation temperature by sex interaction………... 141 Table A-2. Body weight and gross weights of tissues and organs from broiler
chicks on day of hatching in Experiment 3 as influenced by incubation
temperature, sex, and incubation temperature by sex interaction………... 142 Table A-3. Body weight and gross weights of tissues and organs from broiler
chicks on day of hatching in Experiment 4 as influenced by incubation
temperature, sex, and incubation temperature by sex interaction………... 143 Table A-4. Body weight and gross weights of tissues and organs from broiler
chicks on day of hatching in Experiment 7 as influenced by incubation
temperature, egg size, and incubation temperature by egg size interaction………... 144 Table A-5. Body weight and gross weights of tissues and organs from broiler
chickens at 14 d of age in Experiment 4 as influenced by incubation temperature brooding temperature, sex, incubation temperature by brooding temperature
interaction, brooding temperature by sex interaction, and incubation temperature by brooding temperature by sex interaction………..……… 145 Table A-5 (continued). Body weight and gross weights of tissues and organs from
broiler chickens at 14 d of age in Experiment 4 as influenced by incubation temperature brooding temperature, sex, incubation temperature by brooding temperature interaction, brooding temperature by sex interaction, and incubation
temperature by brooding temperature by sex interaction………. 146 Table A-5 (continued). Body weight and gross weights of tissues and organs from
broiler chickens at 14 d of age in Experiment 4 as influenced by incubation temperature brooding temperature, sex, incubation temperature by brooding temperature interaction, brooding temperature by sex interaction, and incubation
temperature by brooding temperature by sex interaction………. 147 Table A-6. Body weight and gross weights of tissues and organs from broiler
chickens at 21 d of age in Experiment 6 as influenced by incubation temperature, brooding temperature, and incubation temperature by brooding temperature interaction………...………... 148 Table A-7. Feed conversion ratio (FCR) of broiler chickens as affected by
incubation temperature, brooding temperature, sex, incubation temperature by brooding temperature interaction, brooding temperature by sex interaction, and incubation temperature by brooding temperature by sex interaction in
xi Page Table A-7 (continued). Feed conversion ratio (FCR) of broiler chickens as
affected by incubation temperature, brooding temperature, sex, incubation temperature by brooding temperature interaction, brooding temperature by sex interaction, and incubation temperature by brooding temperature by sex interaction in Experiment 4……… 150 Table A-7 (continued). Feed conversion ratio (FCR) of broiler chickens as
affected by incubation temperature, brooding temperature, sex, incubation temperature by brooding temperature interaction, brooding temperature by sex interaction, and incubation temperature by brooding temperature by sex interaction in Experiment 4……… 151 Table A-8. Feed conversion ratio (FCR) of broiler chickens as affected by
incubation temperature, brooding temperature, sex, incubation temperature by brooding temperature interaction, brooding temperature by sex interaction,
incubation temperature by sex interaction, and incubation temperature by brooding temperature by sex interaction in Experiment 5………... 152 Table A-8 (continue). Feed conversion ratio (FCR) of broiler chickens as affected
by incubation temperature, brooding temperature, sex, incubation temperature by brooding temperature interaction, brooding temperature by sex interaction,
incubation temperature by sex interaction, and incubation temperature by brooding temperature by sex interaction in Experiment 5………... 153 Table A-8 (continued). Feed conversion ratio (FCR) of broiler chickens as affected by incubation temperature, brooding temperature, sex, incubation temperature by brooding temperature interaction, brooding temperature by sex interaction,
incubation temperature by sex interaction, and incubation temperature by brooding temperature by sex interaction in Experiment 5………... 154 Table A-9. Feed conversion ratio (FCR) of broiler chickens as affected by
incubation temperature, brooding temperature, and incubation temperature by
brooding temperature interaction in Experiment 6………... 155 Table A-10. Feed conversion ratio (FCR) of broiler chickens as affected by
LIST OF FIGURES
Page Materials and Methods
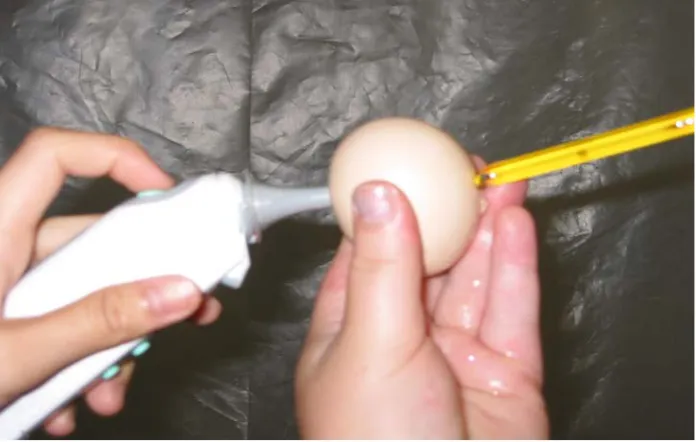
Figure M-1. Calibration of infrared with mercury thermometer. The mercury thermometer was inserted into an opening in the egg shell until the entire length of the metal tip was in the egg (approximately 3.8 cm) and then sealed in place. The infrared thermometer was placed into the equator of the same egg for the
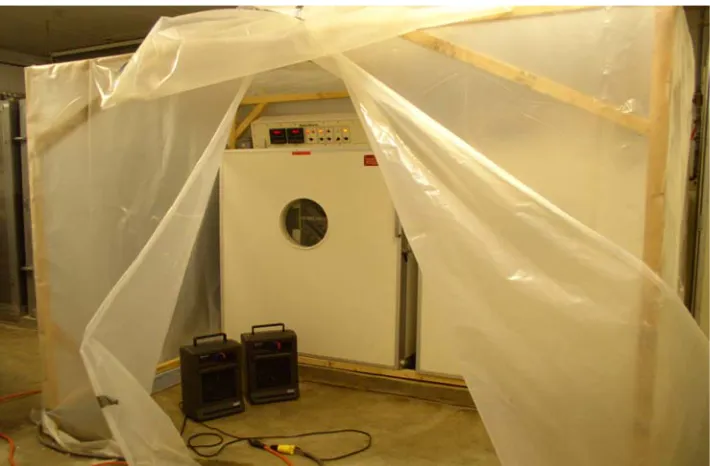
comparative temperature measurements…………... 38 Figure M-2. Plastic tent with electric heaters used to prevent heat loss from
incubators and eggs during egg temperature measurements………... 39
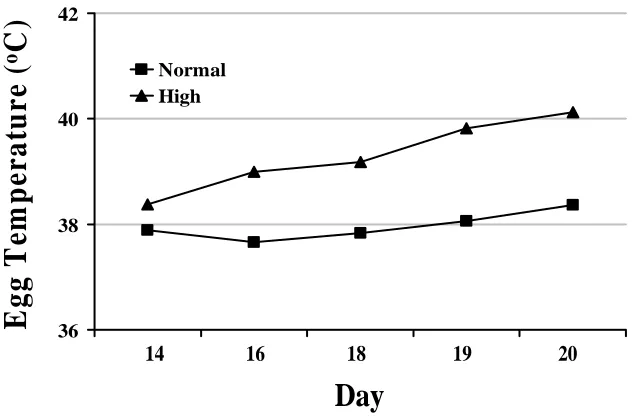
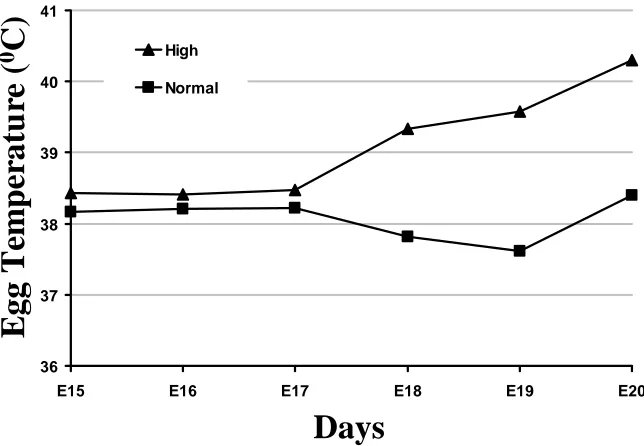
Figure M-3. Internal egg temperatures as a result of high or normal incubation temperature treatments in Experiment 2. The triangle symbols represent the high temperature eggs and the rectangle symbols represent the normal temperature
eggs………... 41
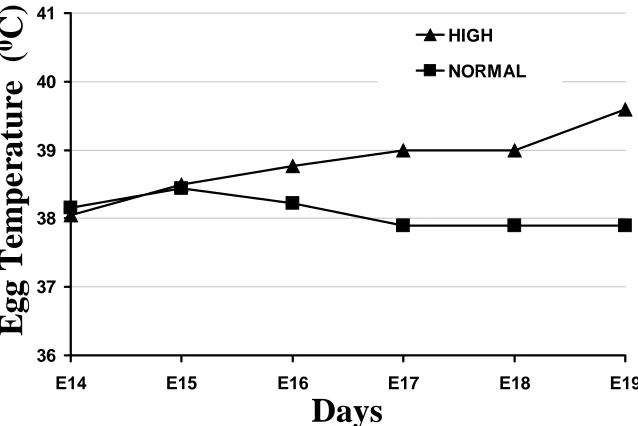
Figure M-4. Internal egg temperatures as a result of high or normal incubation temperature treatments in Experiment 3. The triangle symbols represent the high temperature eggs and the rectangle symbols represent the normal temperature
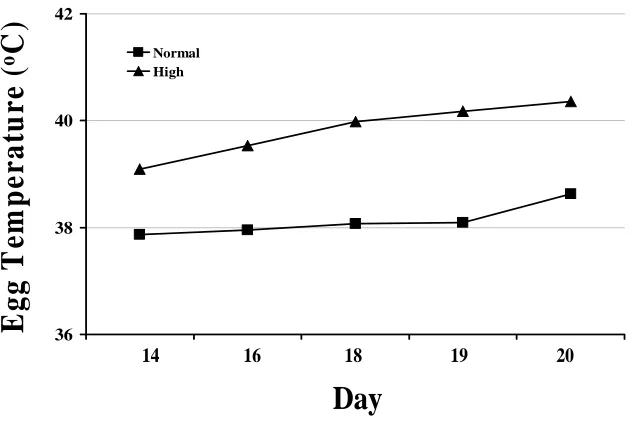
eggs………... 42 Figure M-5. Internal egg temperatures as a result of high or normal incubation
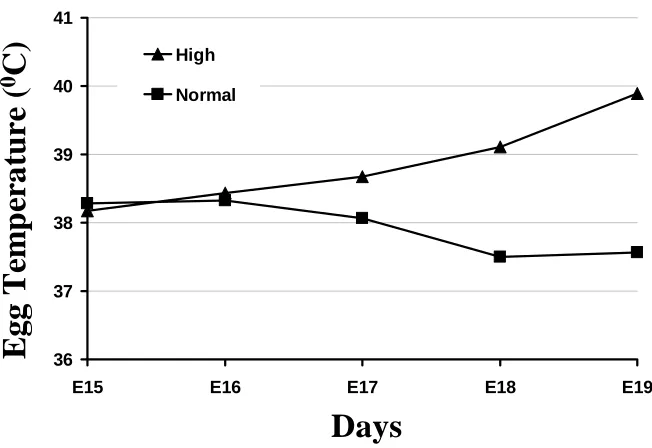
temperature treatments in Experiment 4. The triangle symbols represent the high temperature eggs and the rectangle symbols represent the normal temperature
eggs………... 45
Figure M-6. Internal egg temperatures as a result of high or normal incubation temperature treatments in Experiment 5. The triangle symbols represent the high temperature eggs and the rectangle symbols represent the normal temperature
eggs………... 46
Figure M-7. Daily high air, low air, and litter temperatures in the cool brooding rooms in Experiment 4. The triangle symbols represent the daily high air (Hi-Air) temperature, the rectangle symbols represent the daily low air (Lo-Air)
temperature, and the diamond symbols represent the litter temperature at 1300
xiii Page
Figure M-8. Daily high air, low air, and litter temperatures in the cool brooding rooms in Experiment 5. The triangle symbols represent the daily high air (Hi-Air) temperature, the rectangle symbols represent the daily low air (Lo-Air)
temperature, and the diamond symbols represent the litter temperature at 1300
hours each day………...………... 49 Figure M-9. Daily high air, low air, and litter temperatures in the hot brooding
rooms in Experiment 4. The triangle symbols represent the daily high air (Hi-Air) temperature, the rectangle symbols represent the daily low air (Lo-Air)
temperature, and the diamond symbols represent the litter temperature at 1300
hours each day………...………... 50 Figure M-10. Daily high air, low air, and litter temperatures in the hot brooding
rooms in Experiment 5. The triangle symbols represent the daily high air (Hi-Air) temperature, the rectangle symbols represent the daily low air (Lo-Air)
temperature, and the diamond symbols represent the litter temperature at 1300
hours each day………...………... 51
Figure M-11. Internal egg temperatures as a result of high or normal incubation temperature treatments in Experiment 6. The triangle symbols represent the high temperature eggs and the rectangle symbols represent the normal temperature
eggs………... 54 Figure M-12a. Daily high air, daily low air, and litter temperatures in the cool
brooding rooms in Experiment 6. The triangle symbols represent the daily high air (Hi-Air) temperature, the rectangle symbols represent the daily low air (Lo-Air) temperature, and the diamond symbols represent the litter temperature at 1300
hours each day…...………... 55 Figure M-12b. Daily high air, daily low air, and litter temperatures in the hot
brooding rooms in Experiment 6. The triangle symbols represent the daily high air (Hi-Air) temperature, the rectangle symbols represent the daily low air (Lo-Air) temperature, and the diamond symbols represent the litter temperature at 1300
hours each day...………... 55
Figure M-13. Internal egg temperatures as a result of high or normal incubation temperature treatments in Experiment 7. The triangle symbols represent the high temperature eggs and the rectangle symbols represent the normal temperature
Page Figure M-14. Pedigree basket used to hatch chicks in three egg size classes in
Experiment 7. The 36 labeled eggs from each tray were placed in pedigree baskets placed in the center of each hatching basket. The remaining portion of the hatching baskets was divided into six sections into which the 24 remaining non-labeled eggs within a given incubator tray were transferred……….……... 59 Results
Figure R-1a. Comparison of small, medium, and large internal eggs temperature of high incubator in Experiment 7. Triangle symbols represent the small size eggs, rectangle symbols represent the medium size eggs, and diamond symbols represent the large size eggs……….………... 68 Figure R-1b. Comparison of small, medium, and large internal eggs temperature of
xv
Discussion
Page
Figure D-1. Comparison of machine air temperature and internal egg temperature in Experiment 7. The rectangle symbols represent the internal egg temperature and the circle symbols represent the machine air temperature in the normal temperature
incubator………...………... 115 Figure D-2. Comparison of chicks incubated at high and normal incubation
temperatures. Chicks that were incubated and hatched at the lower internal egg temperature of ~37.80C (100.00F) exhibited the yellow color and chicks incubated at a higher temperature of >38.90C (102.00F) exhibited the white color in many
instances………... 119 Figure D-3. Room air and litter temperature in the hot brooding room of Experiment 4. On the first day of the brooding period, when the daily high (Hi) air temperature (triangle symbols) reached about 40.00C (104.00F) and the daily low (Lo) air temperature (rectangular symbols) decreased to about 36.50C (97.70F), the litter
temperature (diamond symbols) was only 34.50C (94.10F)………. 127 Figure D-4. General recommendation for litter temperature. Triangle symbols
represent the High litter temperature in Experiment 4, diamond symbols represent the Normal litter temperature in Experiment 4, and rectangle symbols represent the
projected temperature ………..……… 131 Figure D-5. Comparison of litter temperature from Experiments 4, 5, and 6 from 0 d (placement) to 12 d (Experiments 4 and 5) and 18 d (Experiment 6) during the growing period. Diamond symbols represent the litter temperature in Experiment 4, triangle symbols represent the litter temperature in Experiment 5, and rectangle
LIST OF ABBREVIATIONS
AdjFCR Adjusted feed conversion ratio, corrected for mortality ATP Adenosine triphosphate
BW Body weight C Celsius cm Centimeter d Day
E Embryonation F Fahrenheit
FCR Feed conversion ratio g Gram
h Hour
IPP Inositol pentaphosphate kg Kilogram
min Minute
xvii T3 Triiodothyronine
T4 Thyroxine wk Week
INTRODUCTION
Incubation has been generally accepted as one of the most important aspects of poultry
husbandry. Research has shown the optimum incubation temperature to be around 37.00C
(98.60F) to 38.00C (100.40F) for chicken eggs (Insko, 1949; Romanoff, 1960; Landauer,
1967; Lundy, 1969; Wilson, 1991) and 37.50C (99.50F) for turkey eggs (Romanoff, 1935;
French, 2000). Abnormal incubation temperatures have been shown to affect post-hatch
growth (Romanoff, 1935, 1936; Michels et al., 1974; Decuypere, 1979; Geers et al., 1982)
and proper organ development of avian embryos (Shafey, 2004). Eggs that were incubated by
feral fowl in natural conditions appeared to develop at a relatively constant temperature that
must be near optimum for proper embryo development (Romanoff, 1935). However, it has
always been difficult to maintain a completely constant machine air temperature during
artificial incubation due to the increase in egg temperature that results from increasing
metabolic rate of the large mass of growing embryos in the incubator(s). According to French
(1997), eggs will absorb heat from the surrounding air during the first half of incubation due
to embryo temperature being slightly lower than incubator temperature but embryos must
lose heat during the second half of the incubation as their metabolic rate and heat production
increase. This may also be related to the developing chicken embryo being a poikilotherm,
making it susceptible to fluctuations in body temperature (Tazawa et al., 1988, 1989;
Whittow and Tazawa, 1991). However, in spite of all, according to Lundy (1969),
incubation conditions that result in the best hatchability generally elicit the best chick quality,
Brooding has also been shown to be a critically important aspect of poultry husbandry.
According to Osbaldiston and Sainsbury (1963), brooding has been defined as the provision
of a warm place for the young chicken. Chick quality and behavior have been shown to be
influenced by brooding conditions. Brooding has been shown to be critical to determination
of how rapidly the chick would grow. Having a correct brooding temperature from the first
day of brooding could result in having fast growing chicks with a decreased mortality rate
(Osbaldiston and Sainsbury, 1963).
The objectives of the present experiments were to confirm that high incubation temperatures
adversely affect the development of key organs of the modern chick and decrease post-hatch
chick feed consumption and growth rate, while hot brooding temperature (litter temperature)
during the first weeks of life could decrease chick mortality and improve chick feed
LITERATURE REVIEW
Factors Affecting Embryonic Growth and Development. It has been well documented that
chick embryos will develop and hatch in approximately 21 d (Yalcin and Siegel, 2003) and
turkey embryos in 28 d (Christensen et al., 1993; French, 2000) when conditions are optimal.
Many factors have been shown to affect the metabolism and growth of embryos during the
incubation period; such as, turning, vital gas exchange, temperature control, and moisture
loss.
Temperature has been indicated to be the most important factor controlling embryo growth
and development (Meijerhof, 2000). Embryo body temperature has been shown to be
governed by incubation temperature as studies concerning thermogenesis in the chick
embryo have indicated that the embryo cannot properly regulate its body temperature until
the hatching process has been completed (Romijn and Lokhorst, 1955; Freeman, 1964, 1966,
1967, 1970, 1971; Wekstein and Zolman, 1967, 1968, 1969, 1970; Davidson, 1973).
Eggshell porosity must also be appropriate to accommodate the respiratory needs of the
embryo, allowing for adequate gas exchange but also prevention of desiccation
(Westmoreland, 2003). For example, the diffusion of vital gases through the eggshell pore
system has been shown to be vitally important (Freeman and Vince, 1974). The age of the
parent (breeder hen) has been reported to be another factor affecting the embryo such that
eggs from early production breeder flocks usually have thicker albumen and eggshells, which
can contribute to reduced moisture loss, vital gas exchange (Brake et al., 1997), and nutrient
availability (Benton and Brake, 1996). Romanoff (1960) noted that the connection between
the albumen sac and the amniotic cavity appeared between E11 and E13 of incubation during
and almost all of the albumen has been absorbed by E17 or E18 under normal incubating
conditions. Romanoff (1960) indicated that high incubation temperatures caused inhibition
of embryo growth due to under utilization of albumen due to the interference with albumen
transfer from the egg into the amniotic cavity, i.e. due to an induced nutritional (energy)
deficiency.
As the growth and development of the embryo progressed to the end of the incubation, the
adverse effects of elevated or suboptimal incubation temperatures have been found to
diminish over time (Romanoff, 1939). Additionally, once pulmonary respiration
commenced, there was no effect on the metabolic rate of the embryo with a change in
incubating temperature (Pembrey et al., 1895; Giaja, 1925).
Organ Growth and Development. There have been many studies on the specifics of embryological development since 1900 (Romanoff, 1960). Growth efficiency of the embryo
has been reported to be affected by incubation temperature (Penquite, 1938; Michels et.,
1974; Kuhn et al., 1982; Geers et al., 1983). Growth appears to be most efficient at the
optimum temperature for maximum hatchability (Romanoff, 1936). Studies have been
performed to determine the effects of incubation temperature on organ (Romanoff, 1960;
Rozemboim et al., 2004) and bone development (Moraes et al., 2002). Yalcin and Seigel
(2003) found that variation in temperatures between 36.90C (98.40F) and 39.60C (103.30F)
influenced the growth of the skeleton but a compensatory mechanism ensued to modulate
those changes by the time of hatching.
Olivo (1928) stated that the avian heart started its embryonic development at a very early
stage and continued up to 10 d post-hatch to provide the basic platform for circulatory system
the relatively high mitotic rates at E13 still played a crucial role in increasing the heart wall
thickness by E20 of embryological growth (Olivo, 1928). Further studies by Olivo (1931)
with three incubation temperatures (34.50C (94.10F), 36.50C (97.70F), and 39.50C (103.10F))
have shown temperature to significantly affect the number of mitotically active myocytes of
the heart. It was shown that the weight of the heart of embryos in eggs exposed to a high
incubation temperature differed significantly before E7 of incubation; however, the trend
changed after E9 to result in a linear weight gain progression at high incubation
temperatures, i.e. an increasing negative association between incubation temperature and in
cardiac cell division. This allowed the lower temperature embryos to exhibit a greater heart
weight.
The liver also develops by mitotic cell division in a manner similar to the heart. Romanoff et
al. (1938) showed that from E4 (0.3 mg) to E8 (17.4 mg) of incubation the liver grew 58-fold
from its initial mass and by E12 liver mass reached between 75-100 mg, by E20 between
580-640 mg and at hatching between 820 to 1500 mg. High incubation temperature also
caused a decline in cell division in the liver as it did in the heart.
Recently, a study concerning the effects of photostimulation on embryonic growth and
acceleration of organ development (Shafey, 2004) has become of interest.
Effects of Hyperthermic and Hypothermic Incubation Temperatures. Many studies
concerning the effects of temperature on hatchability have been reviewed (Barott, 1937;
Kosin, 1964; Landauer, 1967; Lundy, 1969). Researchers have shown that the major factors
affecting the developing embryo were incubation temperature, thermal conductance of the
egg and surrounding air, and metabolic heat production of the embryo (French, 1997). Many
commercial incubators; for example, the manner in which the air rises, the manner in which
the fan rotates, and the design of the machine (Owen, 1991). Furthermore, according to the
prediction equations of Sotherland et al (1987) and Meijerhof and van Beek (1993), air speed
was one of the major factors that influenced thermal conductivity. Egg thermal conductivity
has been reported to be mainly influenced by air speed (velocity) over the egg, which in turn
affects embryo temperature (French, 2000). The uniformity of airflow, and therefore
velocity, depends on how easily the air can pass between the trays and the eggs within an
incubator (French, 1997). The embryo temperature during incubation has been shown to be a
combination of heat production by the embryo resulting from growth and metabolism, the
airflow surrounding the eggs, and the ability of the air to transfer heat (French, 1997). It has
been suggested that larger eggs have greater difficulty losing metabolic heat produced by the
embryos because as egg mass increased, thermal conductance did not increase proportionally
(French, 1997).
There have been studies of higher-than-optimum temperatures affecting overall hatchability
with turkey eggs (Romanoff, 1935) at different development stages (French, 1994a) and for
longer periods of exposure to higher-than-optimum temperatures higher-than-optimum
temperatures in chicken eggs (Wilson, 1991). Incubation temperatures above the optimal
temperature have been reported to accelerate growth rates of avian embryos (Romanoff,
1960; Christensen et al., 1999) and have been reported to negatively impact hatchability, feed
conversion, BW, and general post-hatch chick and poult performance (Gladys et al., 2000).
Evidence has shown that high embryo temperatures during incubation can lead to reduced
chick growth rate during the subsequent brooding period due to heat-stressed chicks being
an abnormal appearance (Thompson et al., 1976). Studies with turkey eggs by Romanoff
(1935) and French (1994a, b) showed that an increase of 10C or more above the generally
accepted optimum (37.50C (99.50F)) reduced hatching success significantly. Overheating
turkey eggs caused an increase in embryo mortality during the third and fourth week of
incubation and at the pipping stage (French, 2000). Acute heat stress at 40.00C (104.00F) of
E16 embryos caused an increased mortality, especially at E19 of incubation (Romanoff and
Faber, 1933). However, Wilson et al. (1975) reported no significant decreases in hatchability
with exposures of up to 24 h at a similar stage of incubation. Chronic exposure of chicken
embryos to 39.00C (102.20F) or higher temperature caused increased embryo abnormalities
and higher chick mortality (Romanoff, 1936; Penquite, 1938; Henderson, 1939). Romanoff
et al. (1938) found that older embryos were more susceptible to a higher temperature than E0
to E5 chick embryos when exposed to 41.00C (105.80F) for 24 h. Moreng and Shaffner
(1951) found that embryos at E1 or over E7 of age were able to survive 43.30C (109.90F)
when exposed for up to 8 h, but E4 embryos would be killed after 10 min of a similar
exposure. Conversely, studies by Ande and Wilson (1981) found that E7 and E19 embryos
were the least resistant to high (43.30C (109.90F)) temperature and E3 embryos were the most
resistant to heat stress when exposed to this temperature for 1 to 12 h. Morgan and Tucker
(1967) showed that embryo mortality was lower at E7 and E8 compared to E9 and E10 of
incubation when embryos were exposed to 41.00C (105.80F) for 3 h.
Chicks that hatched following a severe heat stress were weaker (Thompson et al., 1976), less
alert, and had matted, coarse down that resulted in an abnormal and unthrifty appearance
(Thompson et al., 1976). Such chicks have been reported to have a high incidence of
exposed to a lower than optimal incubation temperature for more than 36 h also had improper
positioning of the embryo and reduced chick weight (Suarez et al., 1996).
High incubation temperatures (between 37.50C (99.50F) to 39.00C (102.20F)) accelerated
embryonic development and hatching time (Romanoff, 1936) but decreased the maximum
hatchability. A decrease in incubation temperature by 2 to 30C towards the end of incubation
resulted in an improved embryo growth rate and metabolism while decreasing embryonic
mortality and improving chick quality at hatching (Romanoff and Faber, 1933). Incubation
of eggs at below optimal temperatures resulted in a delayed hatching time, fewer pipped
eggs, and consequently a lower hatching rate (Insko, 1949).
As discussed above, the period of embryo susceptibility to high temperatures varied among
the studies and appeared to depend upon the stage of embryo development at the time of
exposure and the temperature used during that exposure, i.e. cumulative time and duration
effects. The effect of short exposures to high temperatures on embryos incubated at otherwise
optimal temperatures was shown to be dependent on length of the exposure, size and age of
the embryo, and deviation from the optimal temperature (Lundy, 1969). Studies by French
(1997) showed that embryos were more susceptible to high temperature during the second
half of incubation and he hypothesized that this was due to a metabolic heat production
adaptation by the embryo, but that high incubation temperatures during E6-E18 of incubation
could also interfere with the ability of the embryo to position itself correctly within the egg
(French, 2000). Studies by Romanoff et al. (1938) and Ande and Wilson (1981)
demonstrated that embryos were very sensitive to acute high temperature during early stages
sensitive to acutely high incubation temperatures. Variations might be influenced by genetic
differences in metabolism of the embryo and resultant broiler (Ande and Wilson, 1981).
Temperature and Thermoregulatory Effects On Metabolism and Oxygen Dynamics. The shift from poikilothermic to homeothermic metabolism (using elevated VO2 (volume of
Oxygen) to produce heat to generate body heat) in chicken embryos has been characterized as
an important physiological transition that occurs during the last twenty percent of incubation
(Black and Burggren, 2004a). This thermoregulatory transition concerning heat production
metabolism to support oxygen transport and to regulate body temperature (Black and
Burggren, 2004a) and support organ development and maturity (Romanoff, 1960) has been
viewed as obligatory and essential. Incubation temperature to modified the onset of the
ability of the chicken embryo to trigger endogenous heat production as part of developing
thermoregulatory mechanisms (Black and Bruggren, 2004a). Newly hatched chicks have
been reported to rely upon non-shivering endogenous heat production as a thermoregulatary
mechanism to control body temperature (Whittow and Tazawa, 1991; Roberts, 1996; Tazawa
et al., 2001).
Dzialowski et al. (2002) stressed the importance of blood oxygen transport efficiency and
suggested that total blood oxygen carrying capacity was an important acclimation response
that facilitated appropriate vital gas delivery to tissues and organs during embryo
development as maturity of both the cardiovascular and respiratory systems was crucial to
insure the delivery of oxygen to support metabolic processes, and permit optimum heat
production and body temperature regulation.
Oxygen transport rates in the chicken embryo have been reported to be limited by diffusive
development stages of incubation (Tazawa et al., 1992). As reported by Black and Bruggren
(2004a), the significantly larger embryo wet mass of 35.00C (95.00F) incubated embryos
contributed to having a low mass-specific VO2 and a large amount of variation in VO2 during
E19-E20 of incubation as compared to 38.00C (100.40F) incubated embryos. This might be
due to failure of the chorioallantoic membrane (CAM) in the 35.00C (95.00F) embryos to line
the entire inner surface of the egg shell causing a smaller surface area for gas exchange as
this might have a negative impact on the embryos with the largest metabolic demand, i.e.
E19-E20 embryos (Black and Bruggren, 2004a). Studies from Okuda and Tazawa (1988)
proved that by covering up to 50% of the shell of chicken eggs with epoxy, effectively
reducing the surface area of the CAM able to exchange gases with the environment, that
there was a significant reduction in gas conductance that resulted in a reduced VO2.
Incubation Temperature Effects On Blood Oxygen Carrying Capacity and Hemoglobin-Oxygen Affinity. Embryos that were incubated at 38.00C (100.40F) showed a significant increase in both blood oxygen carrying capacity and hemoglobin-oxygen affinity between
E17-E20 of incubation (Tazawa et al., 1971; Black and Burggren, 2004b) but this was not
observed in 35.00C (95.00F) embryos (Black and Burggren, 2004b). According to Black and
Burggren (2004b), hypothermic incubation reduced hematocrit (packed cell volume) from
31% in 38.00C (100.40F) incubation to 27.5% at 35.00C (95.00F) incubation during later
embryonic stages, suggesting a reduction in red blood cell production. On the contrary,
hypoxic incubation, which occurred at normal incubation temperatures, increased both
hematocrit and hemoglobin (Hb) of embryonic chicken blood (Dusseau and Hutchins, 1988;
Dzialowski et al.,2002), and such blood would presumably have a greater potential oxygen
Burggren, 2004b). The 35.00C (95.00F) embryos had hemoglobin with a higher oxygen
affinity that resulted in more completely saturated blood at the respiratory gas exchange
surface (Black and Burggren, 2004b). Black and Burggren (2004b) also suggested that
increasing the total oxygen carrying capacity of the blood may be an important acclimation
response ensuring adequate oxygen delivery to tissues prior to hatching.
Since an egg incubated at a normal temperature did not have an increased
hemoglobin-oxygen binding affinity, as was the case with the lower temperature, hemoglobin-oxygen conditions must
have become increasingly hypoxic in ovo as the restrictions of diffusive gas exchange across
the egg shell failed to meet the growing oxygen demands of the rapidly developing embryo
(Wagensteen et al., 1970; Rahn et al., 1974; Ar et al., 1980; Tazawa, 1980; Reeves, 1984).
Consequently, the partial pressure of oxygen in the air cell (PO2) declined about 5.3 kPa from
the early stages of incubation up to prior to pipping (Reeves, 1984; Burggren et al., 2000)
and venous PO2 also declined about 2.5kPa from E12 to E17 of incubation (Tazawa et al.,
1971). Following this pattern, the partial pressure of carbon dioxide in blood (PCO2)
increased during development, which resulted in a progressive decrease in blood pH
(Tazawa, 1973).
In contrast, an incubation temperature of 35.00C (95.00F) resulted in a lower oxygen carrying
capacity that corresponded to the significantly increased hemoglobin-oxygen affinity
required to maximize the loading of oxygen at the respiratory surface to compensate for
restriction of total oxygen carrying capacity (Black and Burggren, 2004b). Elevated
hemoglobin-oxygen binding affinity has been reported to provide an efficient load of oxygen
at the respiratory surface and adequate delivery of oxygen to metabolically active tissues
Another factor that affected oxygen affinity of embryonic chicken blood was the organic
phosphate concentration, as stated by Baumann and Meuer (1992). Chick embryos depend
upon adenosine tri-phosphate (ATP) as the primary organic modifier of hemoglobin-oxygen
affinity from the beginning to approximately E12 of incubation (Misson and Freeman, 1972;
Barlett and Borgese, 1976; Baumann and Meuer, 1992; Hochachka and Somero, 2002).
From E8 until E18 of incubation, the hemoglobin-oxygen affinity reached its maximum
pre-pipping plateau causing hypoxia to develop within the egg and, at this point, the aerobic
production of ATP was more difficult to achieve such that there was a decrease in blood ATP
concentration (Barlett and Borgese, 1976; Nikinmaa, 1990). These authors also stated that as
ATP concentration declined, the anaerobic production of 2,3-bisphosphoglycerate (2,3-BPG)
increased and this organic phosphate then acted as the primary allosteric modifier of
hemoglobin until after hatching, when inositol polyphosphate (IPP) became the adult
allosteric modifier (Barlett and Borgese, 1976; Nikinmaa, 1990). Thus, it can be concluded
that oxygen regulates the concentrations of organic phosphates and the timing of the
metabolic shift from ATP to 2,3-BPG while incubation temperature alone did not induce
obvious changes in the patterns of organic phosphate concentration in the late-stage chicken
embryo (Black and Burggren, 2004b).
Development of Ascites. Over the last twenty years, the broiler industry has reduced the time required to achieve a BW of 2 kg by 1.3 d per year (McKay, 1997). This rapid increase in
growth rate within a short period of time may contribute to metabolic problems such as
Sudden Death Syndrome (SDS), and ascites (Brake, 1997), which have been related to
relative oxygen deficits. There have been several clinical signs associated with the ascites
and portal venous congestion, hepatic damage, and transduction of fluid into the abdominal
cavity (Riddell, 1991; Yersin et al., 1992; Julian, 1993; Wideman et al., 1995a). These signs
were typical of events initiated by hypoxemia (abnormal reduction of oxygen level in the
blood) that could results in ascites and death (Julian, 1993, 1998; Wideman and Boittje,
1993; Maxwell et al., 1995). SDS and ascites have been characterized by failures of the heart
and lungs and enlargement of the liver, which may occur in certain broilers given ad libitum
access to feed when exposed to low ambient temperatures. There are three categories of
ascites according to the most recent reviews of the etiology of ascites: 1) pulmonary
hypertension, 2) miscellaneous cardiac pathologies, and 3) cellular damage caused by
reactive oxygen species (Currie, 1999). The rapid growth of broilers and cool environmental
temperatures have been shown to be two of the primary conditions that trigger ascites
(pulmonary hypertension syndrome) in commercial broiler production. Under these two
conditions, broilers require more oxygen and thereby force the heart to increase its cardiac
output (Vogel and Strukie, 1963; Whittow et al., 1966; Sturkie, 1986; Leeson, 1986; May,
1989; Wideman, 1999). Concurrently, the hematocrit, hemoglobin, and red blood cell count
were all increased dramatically in a compensatory manner (Hall and Machicao, 1968; Cueva
et al., 1974; Maxwell et al., 1986, 1987; Yersin et al., 1992). However, Kuhn et al (1984b);
Jones (1994) and Buys et al (1999 a,b) stated that ambient temperature and dietary
metabolizable energy level were two other important factors related to the rate of metabolic
activity and, hence, to the amount of oxygen required by the animal, and should be
considered in the etiology of ascites. High metabolic rate has also been associated with the
increased secretion of the hormone thyroxine (T4), which has been shown to be deiodinated
triiodothyronine becoming the main metabolic stimulating hormone (McNabb and King,
1993; Gabarrou et al., 1997). Triiodothyronine has also been reported to be an important
hormone associated with temperature regulation and growth promotion in chickens (McNabb
and King, 1993; Carew et al., 1998; Gonzales et al., 1999; Yahav, 2000). Thus,
triiodothyronine might also be involved in modification of growth rate in response to
environmental temperature.
According to Shigenaga et al (1994), a controlling factor in oxygen supply and demand was
mitochondria that account for 85 to 90% of cellular oxygen consumption. Also, recent data
have indicated that broilers with ascites suffer from increased oxidative stress (Enkvetchakul
et al., 1993) and defects in liver (Cawthon et al., 1999) and lung (Iqbal et al., 2001)
mitochondrial oxygen consumption. Chance et al. (1979) stated that the defect in the
electron transport chain may be involved in the development of the mitochondrial
dysfunction now associated with ascites since mitochondria were a major contributor to
oxidative stress and a primary oxygen consumer.
Metabolic and Physiologic Adjustments at Hatching. The plateau metabolism and pipping stages coincide with hormonal secretions causing maturation of vital tissues, the replacement
of diffusive respiration through the shell by pulmonary respiration (Rahn et al., 1974), and
the onset of homeothermy (McNabb, 1988) influencing both physiologic and metabolic
adjustments within the embryo as a whole. Therefore, avian species such as the turkey that
spend more time at these stages (Abbot and Craig, 1960) have exhibited increased embryonic
mortality due to genetic selection for egg production and accelerated growth (Christensen,
1993). It has been demonstrated that the yolk sac provides nutrients for embryos during the
the embryo may utilize selectively during successive developmental stages (Speake et al.,
1998) as a source of energy for growth and organ development. As birds grow, embryonic
tissue glycogen levels change concomitantly (Christensen, 1999) allowing for redirection of
energy substrates from organ growth to maturation of organ functions (Ricklefs, 1987).
Incubation temperature has already been shown to be the most important factor affecting
hatchability and any deviation from the optimal temperature can adversely affect hatchability
(Insko, 1949; Landauer, 1967). High incubation temperature (French, 2000; Christensen et
al., 1999; Hassan et al., 2004) or low incubation temperature (Black and Burggren, 2004a;
Feast et al., 1998; Yalcin and Siegel, 2003) had adverse effectson embryonic growth, as well
as metabolic and physiologic adjustments. Incubation temperature has been known to modify the metabolic rate of the developing embryo and affecting nutrient utilization and
oxygen consumption. It has been speculated that many of the metabolic problems incurred
during the broiler growing period might be initiated by exposure of the embryo to high
temperatures during the critical final stages of the incubation period (Brake, 1997).
Role of Hormones in Late Embryonic Development and Subsequent Brooding. Harvey et al (1979), upon examining the ontogeny of growth hormone release in chicken neonates,
observed sharp increases in several circulating hormones subsequent to hatching, which they
partially attributed to postnatal responsiveness to changes in nutritional and environmental
conditions. However, growth hormone levels were decreased on the first day after the initial
reduction of the brooding temperature (Harvey et al., 1979; Scott and Washburn, 1985), but
subsequently growth hormone levels of their 26.70C (80.60F) group were significantly
elevated above those of their 32.20C (90.00F) group (Scott and Washburn, 1985). This
The relatively high circulating levels of corticosterone that have been observed subsequent to
hatching by several authors (Kalliecharan and Hall, 1974; Siegel and Gould, 1976; Satterlee
et al., 1980; Scott et al., 1981) have suggested that adaptive mechanisms may be functional
in neonates. According to Palokangas and Hisssa (1971), plasma corticosterone was elevated
when chickens were exposed to cold (Buckland et al., 1974; El Halawani et la., 1973; Nestor
and Bacon, 1982). On the other hand, heat also causes a significant increase in corticosterone
concentration in plasma (Nathan et al., 1976; Edens and Siegel, 1976). Corticosterone is the
most common glucocorticoid in birds (Remage-Healey et al., 2001) and its role under stress
conditions is well known. Glucocorticoids released during stress mobilize lipids from adipose
tissue, which supports gluconeogenesis. In this manner, stored triglycerides are broken down
into nonesterified fatty acids, which then can be processed by the liver and other tissues for
energy supply through synthesis of ATP (Norris, 1985). Also, glucocorticoids inhibit
synthesis of triglycerides from nonesterified fatty acids (Bentley, 1998). Corticosterone is
essential for bird’s life and severe stress depletes its reserves therefore chickens are very
susceptible to the extreme temperatures during the brooding.
Freeman (1971) suggested that the thyroid gland was important to neonatal thermoregulation,
and that thermoregulation was under the control of thyroid hormones. According to Scott
and Washburn (1985), all growth and serum parameters were affected by reduction of
brooding temperature and that the responses primarily occurred during the initial 24 to 48 h
after placement in the brooding quarters. Therefore, neonatal chickens exposed to a cold
environment would have increased levels of thyroxine and triiodothyronine in order to
maintain body temperature within a normal range (Freeman, 1970; Davison, 1976; Bobek et
have shown that the survival of chicks exposed to cold was dependent upon the presence of
thyroxine. All of the serum proteins, albumin, and globulin concentrations were also higher
for neonates brooded at cooler temperature, such as 26.70C (80.10F) versus 32.20C (90.00F)
(Scott and Washburn, 1985). Several authors (Minne and Decuypere, 1984; Iqbal et al.,
1990; Yahav and McMurtry, 2001) showed that thermotolerance can be induced by
modulation of heat production through changes in circulating triiodothyronine. An
improvement in thermotolerance implied the ability to reduce plasma triiodothyronine
concentration, especially during a thermal challenge (Iqbal et al., 1990; Yahav, 2000).
Nutrient Availability At Hatching. The yolk sac has been long known to be able to supply nutrients to chicks for a few days after hatching. There were two routes identified whereby
yolk may be utilized in the post-hatch chick. One route was by direct transfer to the
circulation and the other route was by transport through the yolk stalk into the small
intestines (Noy and Sklan, 2002). Nitsan et al (1991) showed that the yolk sac content
contributes 50% and 40% of total energy and protein at 1 d post-hatch and 2% and 6% at 4 d
post-hatch, respectively. Many researchers have confirmed that the yolk sac contained
sufficient energy and protein content to maintain the chicks for 3 d after hatching (Sell et al.,
1991; Reis et al., 1998; Uni et al., 1998). Fat was considered to be absorbed from yolk sac
faster than glucose or methionine in the immediate post-hatch period. Also it has been shown
that early nutrition improved the yolk sac absorption (Noy and Sklan, 1995, 1999).
When shifting from embryonic dependence on yolk materials to utilization of exogenous
feed, chicks must undergo metabolic adaptations such as increased secretion of digestive
enzymes from pancreatic and brush border sources, and adaptation of uptake processes to
Kulka (1967) observed the presence of pancreatic enzymes in the intestine during late
embryonic development. The secretion of pancreatic enzymes per gram of feed intake
changed little with age after 4 d (Uni et al., 1996), and the digestibility of starch, protein, and
fat was 85, 78, and 87%, respectively (Noy and Sklan, 1995).
Factors That Affect Hatching Time and the Effect Of Delayed Removal of Chicks From
Hatchers. Research has demonstrated that the longer those chicks remain in the hatchers, the
greater the percentage BW loss (Hager and Beane, 1983; Reinhart and Hurnik, 1984). The
main factor affecting hatching time was reported to be incubation temperature (Insko, 1949;
Reinhart and Hurnik, 1984). High incubation temperatures of between 37.50C (99.50F) and
39.00C (102.20F) have been found to accelerate embryonic development and therefore cause
chicks to hatch early (Romanoff, 1936) but with decreased hatchability. This suggested that
the chicks that hatched in a high incubation temperature environment would remain in the
hatchers longer than those chicks that were hatched in a low incubation temperature
environment. Insko (1949) reported that eggs that were incubated at a below optimal
temperature would result in a delayed hatching time and a low hatchability. On the contrary,
studies from Buckland (1970) showed only a slight depression in hatchability of eggs that
were exposed to suboptimal incubation temperatures for a short period of time. Another
factor affecting hatching time was reported to be the size of the eggs (Landauer, 1961).
Larger eggs were found to hatch later than smaller eggs (Landauer, 1961) due to the higher
egg temperatures of the larger eggs. Reducing the incubation temperature from 37.50C
(99.50F) to 36.50C (97.70F) during the second half of incubation has been reported to
improve the hatchability of those larger eggs (French, 1994). Chicks that were hatched from
the length of time that the chicks remained in the hatcher after completion of the hatching
process (Wyatt et al., 1985). Wyatt et al., (1985) reported that the longer that chicks
remained in the hatchers the more that subsequent growth was decreased and mortality rate
increased. This was associated with dehydration. Reinhart and Hurnik (1984) stated that the
main factor causing dehydration after chicks hatched was the relative humidity of the
machine and the length of time from completing the hatching process to removal from the
hatcher (“pulling”). It was also important to note that the effects of temperature on
embryonic development and duration of the incubation period appeared to depend on the
temperature (low or high), age of the embryo, duration of exposure, and their interactions, as
well as the relative humidity and type of incubator (Wilson, 1991).
Brooding. Osbaldiston and Sainsbury (1963) described brooding as the provision of a warm
place for the young chicken. Brooding has long been known to be a critical management
stage that may determine how fast the broiler chicken would grow. According to Moraes et
al. (2002), development during the first week of life of a chick was important to their future
performance because physiological processes such as cell hyperplasia and hypertrophy,
maturation of the thermoregulatory and immunological systems, growth and differentiation
of the gastrointestinal tract will subsequently markedly influence BW and feed conversion
until market age. The thermoneutral temperature for broiler chicks during the first week of
life should range between 33.00C (91.40F) and 35.00C (95.00F), and temperatures higher than
this may induce hyperthermia and dehydration that will lead to a lower feed consumption and
delayed growth (Mickelberry et al., 1966). In contrast, lower temperatures would induce
Chickens develop their thermoregulatory ability quite rapidly after hatching (Wekstein and
Zolman, 1967), but before 5 d of age, there has been no relationship between
thermoregulatory ability and body mass, feed intake, or insulation identified to explain such
rapid homeothermic development. However, chick quality problems and behavior were
shown to be influenced by brooding conditions at placement. As demonstrated in a previous
section, high incubation temperatures have been clearly shown to accelerate embryonic
development and cause chicks to hatch earlier than normal (Romanoff, 1936) and potentially
remain in the hatchers for an extended period of time. The longer those chicks remained in
the hatchers, the greater the mortality, and the slower the growth rate that resulted (Wyatt et
al., 1985). According to Ernst et al., (1984) and Henken et al., (1987), chicks that had
survived exposure to high incubation temperatures consumed less feed and grew slower than
normal and had a greater chance of dying, when compared to those that were exposed to
lower incubation temperatures, after arrival at a farm and placement at normal thermal
conditions (Ernst et al., 1984; Henken et al., 1987). This was because chilled chicks (19.40C
(66.90F)) were observed to huddle together for warmth and did not eat nor drink normally
while warm chicks (29.40C (84.90F)) were more active and consumed feed normally (USDA,
1955). Therefore, chicks brooded at temperatures cooler than recommended during the first
wk of age resulted in depressed 1 to 7 d BW gain (Hutson et al., 1960; Harris et al., 1975;
Renwick and Washburn, 1982; Renwick et al., 1985; Scott and Washburn, 1985; Noy and
Sklan, 1999), decreased feed efficiency, and increased mortality (Hutson et al., 1960;
Renwick and Washburn, 1982). As shown by Moraes et al. (2002), the total feed
consumption for chicks brooded at 20.00C (68.00F) (82.7 g) was 33.5 g less than that of
During the first wk of brooding, the group of chickens that were brooded at 26.70C (80.10F)
lost 3.8% of their BW while those that were brooded at 32.20C (90.00F) gained 13.9%.
However, the BW gain of these two groups was similar at 2 d and 3 d although the 26.70C
brooding group did not gain BW quite as well as the 32.20C group (Scott and Washburn,
1985). One observation of chickens that did not move or drink after exposure to cold
brooding temperature during the first 3 d was an increased hematocrit (packed cell volume)
(Scott and Washburn, 1985), which would be indicative of dehydration, i.e. lack of water
consumption.
Scott and Washburn (1985) suggested that during the first 5 d of the brooding period, the
temperature should be around 32.00C (89.60F), even though the thermoregulatory mechanism
of the chickens developed very rapidly, in order to have competitive broiler production
results. The most important management factor was to have the chicks move and eat during
the first 2 d of the brooding period. However according to Van der Hel et al. (1991),
chickens that were exposed to high temperatures during the first 2 d of life suffered a BW
loss of about 12% and chickens that were exposed to 37.00C (98.60F) to 40.00C (104.00F)
exhibited a reduction in dry matter and protein of 18.5 and 7.1 g per chick during the first 2
wk of age, respectively. Fat and ash were also decreased by 8.7 and 2.6 g per chick over the
initial 2 wk period, respectively (Van der Hel et al., 1992). Van der Hel et al. (1991) stated
that BW loss of neonatal chicks during a 24-h period was dependent upon temperature as
BW loss increased from 3.5 g/d at 30.80C (87.40F) to 4.1 g/d at 35.10C (95.20F) and up to 5.7
g/d at 38.80C (101.80F). These weight losses could be from both the yolk sac and from the
An acute exposure to extreme ambient temperatures demands rapid and extensive responses
by the chicken, mainly within the circulatory system (Yahav and McMurtry, 2001). Yahav
and McMurtry (2001) suggested that thermal conditioning at 3 d of age with a ambient
temperaturebetween 36.00C (96.80F) and 37.50C (99.50F) produced optimal conditions for
improving performance and thermotolerance in broiler chickens. Yahav and McMurtry
(2001) also stated that thermal conditioning may be a useful tool for the simultaneous
improvement of both thermotolerance and performance due to the resulting growth
retardation that was followed by an immediate compensatory growth period, which resulted
in complete compensation for the loss of BW gain, and higher ultimate BW of the thermally
conditioned chickens at 42 d of age. Chickens that were exposed to heat stress at an early
post-hatch age, in fact, lead to chickens that were thermotolerant later in life (Arjona et al.,
1988; Yahav and Hurwitz, 1996) with an increased capacity to survive an exposure to high
ambient temperature (Altan et al., 2000). However, there have also been many studies that
have shown high ambient temperature to have a negative effect on broiler production
efficiency (Teeter et al., 1985; Sandercock et al., 2001). Throughout heat stress, behavioral,
physiological, hormonal and molecular changes occur that have long term effects (Etches et
al., 1995).
Effects of Brooding Temperature on Organ Development. Working with turkey poults and Leghorn chicks at normal brooding temperature, Sell et al. (1991) observed the relative
weight of the gizzard to remain relatively constant up to 8 d and the gastrointestinal tract to
increase in mass very rapidly after hatching, while Yang and Siegel (1997) showed that
relative heart and lung weights decline with chick age. Nitsan (1995) confirmed that the
ratio doubled during the first wk of life. The heart has been reported to be the most sensitive
and responsive to temperature (Deaton and Reece, 1968).
Relative organ weights have been reported to be affected by adverse brooding temperatures.
Liver, heart, and gizzard were all significantly smaller, on a relative basis, at 7 d of age when
chicks were brooded at 35.00C (95.00F) incubation temperature when compared to chicks that
were brooded at 20.00C (68.00F) but not different from chicks brooded at 25.00C (77.00F).
However, there were no differences in yolk weight (Moraes et al., 2002). During the first wk
post-hatching, chicks reared at a 37.20C (99.00F) temperature had a significantly higher liver
and heart-to-BW ratio than chicks reared at 32.20C (90.00F) temperature. This appeared to
indicate a major change in the circulatory system (Deaton and Reece, 1968). However, this
was different from tibia and femur growth, both of which were significantly larger when
chicks were brooded at 25.00C (77.00F) and 35.00C (95.00F) compared to 20.00C (68.00F)
(Moraes et al., 2002). That liver weight was significantly smaller possibly due to a decrease
in metabolic needs (Plavnik and Yahav, 1998). This effect was confirmed by Moraes et al
(2002) who reported that chicks that were reared at 20.00C (68.00F) exhibited significantly
higher relative liver weights at 7 d of age when compared to birds brooded at 25.00C
(77.00F).
It has been conclusively demonstrated that temperature was the most important factor controlling
embryo growth and development and his incubation temperatures may now be common (Meijerhof,
2000). Both, acutely high and low incubation temperatures affect embryogenesis, organ
development, mitotic rates, metabolic adaptations, and disrupt metabolic transitions that affect
hatchability, livability, disease resistance and post hatch performance (Romanoff, 1960). Chicks
exposed to high temperatures during the last stages of incubation may hatch with as much as 12%
According to Osbaldiston and Sainsbury (1963), brooding has been long known to be a critical
management stage that may determine how fast the broiler chicken grows and that lower temperatures
may induce hypothermia and lead to ascites (Moraes et al., 2002). Conversely, higher brooding temperatures appear to promote early development (Scott and Washburn, 1985). Thus, the logic of
this research was that a chick that had been compromised metabolically by high incubation
temperatures might benefit from elevated brooding temperature that would promote feed intake and