ABSTRACT
PELCH, MICHAEL ANTHONY. Exploring how New Teaching Materials Influence the Beliefs and Practices of Instructors and Students’ Attitudes about Geoscience.
(Under the direction of Dr. David McConnell).
STEM educational reform encourages a transition from instructor-centered passive
learning classrooms to student-centered, active learning environments. Instructors adopting
these changes incorporate research-validated teaching practices that improve student
learning. Professional development that trains faculty to implement instructional reforms
plays a key role in supporting this transition. Effective professional development features
authentic, rigorous experiences of sufficient duration. We investigated changes in the
teaching beliefs of college faculty resulting from their participation in InTeGrate project that
guided them in the development of reformed instructional materials for introductory college
science courses. A convergent parallel mixed methods design was employed using the
Teacher Belief Interview, the Beliefs About Reformed Science Teaching and Learning
survey and participants’ reflections on their experience to characterize pedagogical beliefs at
different stages of their professional development. Qualitative and quantitative data show a
congruent change toward reformed pedagogical beliefs for the majority of participants. The
majority of participants’ TBI scores improved toward more student-centered pedagogical
beliefs. Instructors who began with the most traditional pedagogical beliefs showed the
greatest gains. Interview data and participants’ reflections aligned with the characteristics of
effective professional development. Merged results suggest that the most significant changes
occurred in areas strongly influenced by situational classroom factors.
Introductory geoscience courses play a crucial role in recruiting new geoscience
impacted by their experiences in geoscience classes. Students’ attitudes toward science and
its relevance are complex and are dependent upon the context in which they encounter
science. Recent investigations into the attitudes of geoscience students have provided
evidence to support this observation. We sought to expand this data set to provide a broader
characterization of students’ attitudes. We examined students’ attitudes about the nature of
science and its relevance before and after taking an introductory geology course. To
characterize students’ attitudes, we employed two quantitative instruments: the revised
Scientific Attitude Inventory and the Changes in Attitudes about the Relevance of Science
survey. Results show a negative trend in students’ attitudes about the nature of science while
their attitudes about the relevance of science were more variable. Our data support the
findings of previous studies showing only minimal change in students’ attitudes about the
nature of science and its relevance after taking an introductory science course. The data also
highlighted several misconceptions about the nature of science that could have implications
toward future investigations of how geoscience courses impact student attitudes about
science.
There is consensus among industrialized nations that it is important for its citizens
and leaders to be scientifically literate. Therefore, it is important for the educational system
to provide students with pertinent scientific knowledge, an understanding of the scientific
processes, and the ability to evaluate scientific claims. Students’ attitudes toward science and
its relevance are important aspects of science literacy. We sought to determine if the repeated
and explicit exposure to socioscientific issues through the use of InTeGrate course materials
and the Changes in Attitude about the Relevance of Science survey in a quasi-experimental
design over four semesters of an introductory physical geology course. Results show that the
emphasis of socioscientific issues can influence both students’ attitudes about the nature of
science and their perceptions on the relevance of science. Changes were observed in data
from both STEM and non-STEM majors. These findings have implications about how we
select content for introductory science courses in general, and proves the utility of designing
© Copyright 2016 Michael Anthony Pelch
Exploring how New Teaching Materials Influence the Beliefs and Practices of Instructors and Students’ Attitudes about Geoscience.
by
Michael Anthony Pelch
A dissertation submitted to the Graduate Faculty of North Carolina State University
in partial fulfillment of the requirements for the degree of
Doctor of Philosophy
Marine, Earth, and Atmospheric Science
Raleigh, North Carolina 2016
APPROVED BY:
_______________________________ _______________________________
Dr. David McConnell Dr. Karen McNeal Committee Chair
_______________________________ _______________________________
DEDICATION
I would like to dedicate this body of research to my wife who inspired me to pursue a
iii
BIOGRAPHY
Michael Pelch spent his younger years in several places he would consider home.
Formally, he would refer to St. Louis, MO as his hometown. He graduated from Francis
Howell High School in 2000 and then went on to attend the University of Missouri and
participate in the NRTOC program as a midshipman. In 2004 Michael graduated from the
University of Missouri with Bachelor of Science degree in Geology and was also
commissioned as a Second Lieutenant in the United States Marine Corps. After college he
went on to serve as an infantry officer in the United States Marine Corps and participated in
two overseas combat deployments during Operation Iraqi Freedom. Michael left active
service as a Captain with and honorable discharge in 2009. Upon leaving active service, he
returned to the University of Missouri to begin his graduate career in Geology studying fluid
inclusions in Mississippi valley-type ore deposits. After two years of graduate work he
completed his Masters in Science in Geology in 2011. It was around this same time that
Michael’s talented wife Katie finished her doctorate in Biology and they moved to Raleigh,
NC so Katie could start her post-doctoral fellowship with the National Institute of Health.
After their move to Raleigh in 2012, Michael met David McConnell and he decided to pursue
a doctorate in the strange and unknown field of geoscience education at North Carolina State
ACKNOWLEDGMENTS
The first people that I think deserve a prominent acknowledgement are all the present
and past members of our research group: LeeAnna Chapman, Doug Czajka, Jason Jones,
Katherine Ryker, Laura Lukes, April Grissom and Hayley Smith. Without these immensely
dedicated, professional and intelligent individuals the last four years would not have made
such a positive and important impact my life. A special thanks to LeeAnna Chapman and
Doug Czajka who helped co-code interviews and grade hundreds of sustainability question
responses. No mention of the Geoscience Learning Process Research Group can go without
acknowledging my SOLID advisor, David McConnell. His mentorship and friendship over
the past four years are without a doubt the most positive learning experiences I have ever
had. I would also like to thank the Science Education Research Center (SERC) for providing
the financial and professional support for my dissertation and for allowing me the valuable
v
TABLE OF CONTENTS
LIST OF TABLES ... vii
LIST OF FIGURES ... viii
CHAPTER 1: Challenging instructors to change: A mixed methods investigation on the effects of materials development on the pedagogical beliefs of geoscience instructors .... 1
Introduction ... 2
Theoretical Framework ... 9
Methods... 11
Results ... 20
Discussion ... 37
Study Limitations ... 45
Conclusion ... 47
CHAPTER 2: Do our introductory geology courses help students think beyond a class about rocks? Realities of students’ attitudes toward the nature of science and its relevance after taking a physical geology course ... 49
Introduction ... 50
Conceptual Framework ... 51
Study Population ... 55
Course Characteristics ... 56
Instructional Reliability ... 57
Methods... 59
Data Analysis ... 60
Results ... 63
Discussion ... 75
Study Limitations ... 81
Conclusion ... 82
CHAPTER 3: On the road toward science literacy: Determining the impact of socioscientific issues on the students’ attitudes about the nature of science, relevance of science, and their descriptions of sustainability. ... 83
Introduction ... 84
Conceptual Framework ... 87
Study Participants ... 89
Methods... 93
Data Analysis ... 100
Results ... 102
Discussion ... 125
Study Limitations ... 131
Conclusion ... 132
REFERENCES ... 134
vii
LIST OF TABLES
CHAPTER 1
Table 1.1: Participant List ... 12
Table 1.2: Seven semi-structured interview questions from the Teacher Belief Interview ... 14
Table 1.3: BARSTL Person and Item Reliability Values ... 20
Table 1.4: Merged Results from the TBI and BARSTL survey ... 38
CHAPTER 2 Table 2.1: Study population ... 56
Table 2.2: Course content structure ... 57
Table 2.3: RTOP scores for spring and fall semesters ... 58
Table 2.4: Pearson correlation matrix ... 65
Table 2.5: Interpretations of the attitudes of high scoring, average, and low scoring participants for the CARS and SAI II surveys ... 73
CHAPTER 3 Table 3.1: Study participants ... 91
Table 3.2: Breakdown of RTOP observation scores ... 92
Table 3.3: Content modules for control and treatment semesters. Modules in gray during the treatment semester are InTeGrate modules ... 94
Table 3.4: Sustainability Question Rubric ... 97
Table 3.5: Pearson correlation matrix for all post-semester instruments from all four study semesters ... 106
Table 3.6: Percent of coded statements from Control and Treatment groups ... 124
LIST OF FIGURES
CHAPTER 1
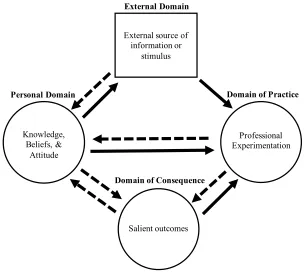
Figure 1.1: Graphical representation of the interconnected model for professional growth described in Clarke and Hollingsworth (2002). Solid arrows represent action
or influence and dashed arrows represent reflection ... 10
Figure 1.2: Graph displaying participants’ pre- and post-development TBI scores .. 21
Figure 1.3: Normalized gains for the pre- to post-development interviews ... 22
Figure 1.4: Histograms showing the distribution of codes on the pre- and post-development ... 23
Figure 1.5: Graph displaying participants’ pre- and post-development BARSTL survey measures ... 32
Figure 1.6: Normalized gains calculated for the pre- and post-development BARSTL surveys ... 33
Figure 1.7: Wright maps created using Winsteps software for the pre- and post-development BARSTL surveys. Item measures are displayed on the right side of each map and participants’ scores (person measures) are displayed on the left. Along the line dividing items and participants, the letter “M” represents the mean item or person measure, “S” represents one standard deviation away from the mean, and “T” represents two standard deviations away from the mean ... 35
Figure 1.8: Proposed model for instructional change based of off the interconnected model of professional growth developed by Clarke and Hollingsworth (2002) ... 45
CHAPTER 2 Figure 2.1: SAI II scores by semester ... 64
Figure 2.2: CARS survey scores by semester ... 65
Figure 2.3: CARS survey scores stratified by academic rank ... 66
Figure 2.4: SAI II scores stratified by academic rank ... 67
Figure 2.5: CARS survey scores stratified by gender ... 68
Figure 2.6: SAI II scores stratified by gender ... 69
Figure 2.7: CARS survey scores stratified by degree type ... 70
Figure 2.8: SAI II scores stratified by degree type ... 71
Figure 2.9: Class Performance stratified by gender: M=male, F=female. Exam total is the average of the four class exams ... 81
CHAPTER 3 Figure 3.1: CARS survey results for all four study semesters ... 104
Figure 3.2: Results from the SAI II for all four study semesters ... 105
Figure 3.3: Final grade and exam totals for all four study semesters. Exam total is the average score for all four of the course exams ... 107
ix Figure 3.5: CARS survey results stratified by academic rank for all four study
semesters ... 110 Figure 3.6: SAI II scores stratified by academic rank for all four study semesters. F=freshman, S=sophomore, J=junior, Sr=senior ... 111 Figure 3.7: Sustainability scores for all four study groups stratified by academic rank ... 112 Figure 3.8: Final grade and exam totals for all four study semesters ... 113 Figure 3.9: CARS survey results stratified by gender for all four study semesters . 115 Figure 3.10: SAI II scores for stratified by gender for all four study semesters.
M=male, F=female ... 116 Figure 3.11: Sustainability scores stratified by gender for all four study semesters. F=female. M=male ... 117 Figure 3.12: Class performance stratified by gender for all four study semesters. F=female. M=male ... 118 Figure 3.13: CARS survey scores stratified by degree type from all four study
CHAPTER 1: Challenging instructors to change: A mixed methods investigation on the effects of materials development on the pedagogical beliefs of geoscience instructors.
Abstract
STEM educational reform encourages a transition from instructor-centered passive
learning classrooms to student-centered, active learning environments. Instructors adopting
these changes incorporate research-validated teaching practices that improve student
learning. Professional development that trains faculty to implement instructional reforms
plays a key role in supporting this transition. The most effective professional development
experiences are those that not only help an instructor redesign a course, but that also result in
a permanent realignment of the teaching beliefs of participating instructors. Effective
professional development features authentic, rigorous experiences of sufficient duration. We
investigated changes in the teaching beliefs of college faculty resulting from their
participation in InTeGrate project that guided them in the development of reformed
instructional materials for introductory college science courses. A convergent parallel mixed
methods design was employed using the Teacher Belief Interview, the Beliefs About
Reformed Science Teaching and Learning survey and participants’ reflections on their
experience to characterize pedagogical beliefs at different stages of their professional
development.
Qualitative and quantitative data show a congruent change toward reformed
2 improved toward more student-centered pedagogical beliefs. Instructors who began with the
most traditional pedagogical beliefs showed the greatest gains. Interview data and
participants’ reflections aligned with the characteristics of effective professional
development. Merged results suggest that the most significant changes occurred in areas
strongly influenced by situational classroom factors.
The process of materials development employed in the InTeGrate project is
comprised of rigorous, authentic, and collaborative experiences continued over a sufficient
duration. Incorporating these characteristics in to a professional development program on a
variety of scales can help promote the long-term adoption of reformed teaching strategies.
Collaboration among geoscience professionals was one of the predominant drivers for
change. Consequently, this research provides insight for the development of future
professional development opportunities seeking to better prepare instructors to implement
reformed instructional strategies in their classrooms.
Introduction
A principal goal of STEM educational reform is to encourage a shift from
instructor-centered classrooms where students are largely passive to student-instructor-centered environments
where learning is an active process (Singer, Nielsen, & Schweingruber, 2012; Singer &
Smith, 2013). This transition has been supported by the development of research-validated
teaching strategies that have been shown to improve student learning (Freeman et al., 2014;
Handelsman et al., 2004; Kober, 2015; Singer & Smith, 2013) and reduce the achievement
Freeman, 2011). The effective implementation of research-validated instructional strategies
will be referred to as reformed instruction (see MacIsaac & Falconer, 2002). Despite the
evidence in favor of the adoption of reformed teaching methods, many instructors in K-12
and higher education institutions have been reluctant to adopt these new strategies (Barak &
Shakhman, 2008; Henderson & Dancy, 2007) and participation in professional development
may be insufficient to promote the transition of these alternative approaches to instruction
(e.g. Ebert-May et al., 2011). University faculty members report several barriers to
instructional reform including limited training, insufficient time, and lack of instructional and
peer support (Dancy & Henderson, 2010; Fairweather, 2010; Henderson & Dancy, 2007;
Sunal, Hodges, Sunal, & Whitaker, 2001; Wieman, Perkins, & Gilbert, 2010).
Classroom change requires that teachers reconsider how they conceptualize the
learning environment (Luft & Roehrig, 2007). Instructor professional development has
become the major focus of many systematic reform initiatives (Corcoran, 1995; Corcoran,
Shields, Zucker, 1998; Garet et al., 2001; Guskey, 2002). Much of the research on this
subject has occurred in K-12 or pre-service settings and examined instructors beliefs
regarding their roles in the classroom, how students learn best, and the most effective types
of student-instructor interactions (Barak & Shakhman, 2008; Fang, 1996; Fishbein & Ajzen,
1975; Hake, 1998; Jones & Carter, 2007; Kagan, 1992; Luft & Roehrig, 2007; Richardson,
1996). Beliefs affect action (Guskey, 1986; Hashweh, 1996; Kang & Wallace, 2005) and any
steps seeking to promote lasting classroom change must consider a teacher’s pedagogical
beliefs (Barak & Shakhman, 2008; Guskey, 1986; Luft & Roehrig, 2007). Successfully
4 professional development is to positively influence teaching in STEM classrooms (Keys &
Bryan, 2001).
Professional development is intended to be a primary driver for the adoption of
research-validated teaching strategies (Henderson, Beach, & Finkelstein, 2011; Wieman et
al., 2010). Instructor professional development is a complex process which requires cognitive
and emotional involvement of teachers both individually and collectively (Avalos, 2011).
Professional development has been defined as the formal or informal learning opportunities
designed to enhance teachers’ professional competence, including knowledge, beliefs,
motivations, and self-regulatory skills (Richter, Kunter, Klusmann, Lüdtke, & Baumert,
2011; Veenman, 1984). An instructor’s preference for either formal or informal professional
development is not static (Richter et al., 2011) and may vary throughout their careers
(Dall’Alba & Sandberg, 2006; Gregorc, 1973; Henderson, Dancy, & Niewiadomska-Bugaj,
2012; Huberman, 1989; Richter et al., 2011; Sikes, Measor, & Woods, 1985; Unruh &
Turner, 1970). The most common types of formal professional development opportunities
often feature curricula designed to be large-scale national, state-wide, district-wide or
intra-institutional programs (e.g. Choy, Chen, Bugarin, National Center for Educational Statistics.,
& Institute of Education Sciences (U.S.), 2006; Feiman-Nemser, 2001). Examples of formal
professional development are workshops, retreats, and courses where experts disseminate
information (Feiman-Nemser, 2001). Informal opportunities do not follow a specific
curricula and are often smaller-scale opportunities that happen within a teachers own school
setting (Desimone, 2009). These opportunities tend to be less common than formal
mentoring activities, and teacher networks (Desimone, 2009; Parise & Spillane, 2010).
Informal professional development is often embedded in the classroom or school context
allowing instructors to reflect on their experiences and share ideas among colleagues
(Putnam & Borko, 2000) and because of this is often a more authentic experience than formal
professional development opportunities.
Professional development opportunities have had an inconsistent impact on classroom
practice (Ebert-May et al., 2011; Feiman-Nemser, 2001; Garet et al., 2001; Henderson &
Dancy, 2007). Professional development has more effectively served as a medium for
disseminating information on reformed teaching strategies (Henderson et al., 2012).
Instructors may be more likely to use reformed teaching strategies if they have attended a
professional development opportunity (Henderson et al., 2012) but the degree of change
towards alternative instructional strategies is relatively modest. Ebert-May et al. (2011)
studied the effectiveness of two national professional development programs in biology.
They found that 89% of participants reported implementing reformed, active learning
strategies in their classrooms. However, videotaped observations of the participants revealed
that 75% of them still relied on traditional or instructor-centered methods (Ebert-May et al.,
2011). Professional development programs may not provide instructors with the tools
necessary to overcome situational barriers to adoption that are often unique to an instructor’s
teaching environment (Ebert-May et al., 2011; Garet et al., 2001; Henderson et al., 2012;
Henderson & Dancy, 2007). Situational factors can vary but commonly include class size and
room layout, perceived student resistance to change, expectations of content coverage, and
6 promote reformed instruction is culturally and logistically difficult due to the “norms” of
practice and organizational structures at most universities (Hora, 2012). Such reform is
further complicated in STEM fields since different disciplines have their own set of standards
and unique curricular needs (Hora, Oleson, & Ferrare, 2013; Singer et al., 2012).
Effective professional development is characterized by some combination of the
following factors: 1) It occurs on an extended timescale beyond a single workshop; 2) It
provides guidance and feedback on the design of reformed lessons; 3) It places emphasis on
collaboration; and, 4) It is comprised of challenging and authentic experiences (Hawley &
Valli, 1999; Loucks-Horsley, Hewson, & Stiles, 1998; Loucks-Horsley & Matsumoto, 1999;
Garet et al., 2001; Henderson & Dancy, 2007; Penuel, Fishman, Yamaguchi, & Gallagher,
2007). Changing beliefs in adulthood is rare and belief systems are often developed or
realigned over prolonged time (Nespor, 1987). Consequently, successful professional
development needs to be of a sufficient duration, allowing for multiple cycles of presentation
to provide participants with several opportunities to assimilate new knowledge and practices
(Brown, 2004), and to engage multiple cycles of feedback and reflection (Penuel et al.,
2007). An in-depth analysis of an instructor’s own teaching strategies may provide the
challenge to pre-existing teaching beliefs (Gess-Newsome, Southerland, Johnston, &
Woodbury, 2003) that can facilitate a “change in conversation” or gestalt shift that is critical
to modifying those beliefs (Pajares, 1992). Collaboration, especially among participants in
the same field, has a positive impact on the effectiveness of a professional development
program (D’Avanzo, 2013; Garet et al., 2001; Penuel et al., 2007). Collaboration during
experts, drive and determine their interaction (Hargreaves & Dawe, 1990). For example,
one-on-one collaboration between pre-service and in-service teachers has been shown to be an
effective model of professional development by actively engaging teachers in their own
research projects (Burbank & Kauchak, 2003). Some forms of professional development may
be too passive to challenge participants adequately to rigorously explore and reflect on new
concepts (Little, 1993; Penuel et al., 2007). Active participation during professional
development is also important for the opportunity to be effective (D’Avanzo, 2013;
Loucks-Horsley & Matsumoto, 1999; Penuel et al., 2007; Putnam & Borko, 2000). For example,
participants should be involved in the examination of effective teaching strategies and should
be encouraged to investigate why and how a particular strategy could be effective in their
classes. Finally, professional development that models the authentic application of teaching
strategies to lessons that are relevant to participants’ classes is more likely to support
instructional change (Burbank & Kauchak, 2003; D’Avanzo, 2013; Smylie, 1995).
We sought to examine changes in pedagogical beliefs of instructors participating in a
national curriculum development program that featured many of the elements of effective
professional development discussed above. This study focuses on the degree to which
participation in creating resources for the InTeGrate project
(http://serc.carleton.edu/integrate/) contributed to changes in the way instructors thought about and described their teaching. The InTeGrate (Interdisciplinary Teaching about the
Earth for a Sustainable Future) project is a multi-disciplinary effort to promote geoscience
literacy in the context of societal issues, and to increase the numbers of geoscience-related
8 focuses on college faculty involved in the development of a series of introductory geoscience
modules. Each module was designed around a topic by teams of three geoscience faculty
from a variety of institution types. The curriculum development aspect of the InTeGrate
project were designed around the theory of participatory design where participants are a
central component of the development process (Mao, Vredenburg, Smith, & Carey, 2005;
Schuler & Namioka, 1993). While certain aspects of the InTeGrate project mirror formal
professional development (e.g., workshops for participants), other aspects more closely
resemble those of informal professional development. For example, participants are required
to pilot developed materials in their own classrooms. Additionally, participants spent a
significant amount of time discussing pedagogy and instructional strategies with peers within
their development teams. InTeGrate materials development lasted approximately four
semesters (sufficient duration) which included the design of original materials, pilot testing
of those materials in classes and subsequent modifications based on participant’s reflections,
and feedback from other team members and trained observers. Authors worked as a
development (collaborative) team but also interacted with a larger project team that included
material reviewers, classroom observers, assessment experts, and leadership and evaluation
personnel. Activities designed by the teams were rooted in their own experiences and
applicable to students in the courses they taught (authentic). Finally, module authors were
provided multiple opportunities (e.g., workshops, webinars, technical reviews) to formally
and informally place their work in context of discipline-based education research (Singer et
al., 2012) and reflect on their experiences under the guidance of an extensive multi-part
Theoretical Framework
Instructors are attracted to professional development because they feel that it will
expand their knowledge and skills (Guskey, 2002). However, research on the long-term
impacts of professional development suggest that this model is often not sufficient to
promote long-term changes in the classroom (e.g., Ebert-May et al., 2011). In a modification
to the traditional model of teacher change, Guskey (2002) proposed that instructors would
modify their existing beliefs and attitudes if they experienced benefits from a new teaching
strategy, such as increased student engagement or improvements in learning outcomes.
Participants in the InTeGrate project had the opportunity to assess the effectiveness of new
instructional strategies as they pilot the materials they developed in their classes. This
practical experience could help secure the evolution of the instructors’ pedagogical beliefs if
it resulted in improvements in student engagement and learning.
Guskey’s linear model for instructional change was expanded by Clarke and
Hollingsworth (2002) who proposed a critical distinction between change sequences and
growth networks. Clark and Hollingsworth noted that change in one domain can lead to
change in another domain (change sequence), such as a teacher learning a new strategy at a
workshop (external domain) and then experimenting with it in their classroom (domain of
practice). However, they suggested that the concept of growth networks that involve
numerous connections of enactment and reflection between multiple domains (Figure 1.1)
would be a more effective model for representing permanent changes in instructional practice
and teaching beliefs. The goal of professional development programs may be to change
10 domains, it may limit professional growth and may not result in the long-term adoption of
effective change. The InTeGrate project sought to influence multiple domains within an interconnected model of professional growth.
Figure 1.1: Graphical representation of the interconnected model for professional growth described in Clarke and Hollingsworth (2002). Solid arrows represent action or influence and dashed arrows represent reflection.
This study assessed the effectiveness of the materials development process employed in
the InTeGrate project as a potential model for professional development capable of
influencing instructors’ pedagogical beliefs. We investigated the following questions:
Professional Experimentation Knowledge,
Beliefs, & Attitude
External source of information or
stimulus
Salient outcomes
Personal Domain Domain of Practice
1. How are the pedagogical beliefs of instructors altered through the scaffolded
development of new instructional materials?
2. How did the materials development process affect different aspects of an instructor’s
pedagogical beliefs?
3. To what extent did the materials development process affect commonly cited barriers
to the long-term adoption of research-validated teaching strategies?
Methods
We employed a convergent parallel mixed methods design for this study. Employing
a mixed methods design to characterize beliefs is important because previous research has
shown that multiple types of data are necessary to accurately describe beliefs (Pajares, 1992;
Richardson, 1996). Mixed methods research combines qualitative and quantitative methods
to reach a comprehensive understanding of the phenomenon under investigation, thus
providing greater confidence in the study conclusions (R. B. Johnson & Onwuegbuzie,
2004). A convergent parallel mixed methods study implements the quantitative and
qualitative instruments during the same phase of the research and integrates the results
(Creswell & Plano Clark, 2011). We administered quantitative and qualitative instruments in
a two-phase pre-post protocol to analyze how the development of course materials affected
participant’s pedagogical beliefs. Collecting both qualitative and quantitative data provides
an opportunity to determine the degree to which an instructor’s description of teaching
beliefs (qualitative) converges or diverges with their conceptualizations of those same beliefs
12 STEM educators selected the study subjects to participate in the InTeGrate project. All
participants were post-secondary instructors from a variety of higher education institutions
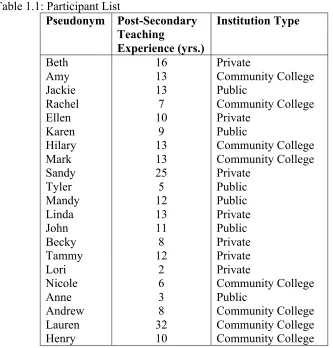
across the United States. Table 1.1 lists each participants’ pseudonym and institutional type.
Table 1.1: Participant List
Pseudonym Post-Secondary Teaching
Experience (yrs.)
Institution Type
Beth 16 Private
Amy 13 Community College
Jackie 13 Public
Rachel 7 Community College
Ellen 10 Private
Karen 9 Public
Hilary 13 Community College
Mark 13 Community College
Sandy 25 Private
Tyler 5 Public
Mandy 12 Public
Linda 13 Private
John 11 Public
Becky 8 Private
Tammy 12 Private
Lori 2 Private
Nicole 6 Community College
Anne 3 Public
Andrew 8 Community College
Lauren 32 Community College
Qualitative Instrument
Qualitative data were generated by application of the Teacher Belief Interview (TBI,
Luft & Roehrig, 2007), a semi-structured instrument consisting of seven questions (Table 2)
designed to assess how instructors characterize various aspects of science teaching and
learning. We used the protocol outlined by Luft and Roehrig (2007) to transcribe and code
the interview recordings. The coding protocol employs a thematic content analysis by
guiding the researcher to assign individual responses to one of five categories: traditional,
instructive, transitional, responsive, and reform-based instruction; therefore, any change, in
even a single category, is likely practically significant. The traditional and instructive
categories encompass participant’s statements that often describe science as a series of rules
and facts, and represent the most instructor-centered pedagogical beliefs. Responses that fall
in the transitional category view science as consistent, connected, and objective, and
represent pedagogies that typically include a mix of traditional and reformed strategies. The
responsive and reform-based categories include answers dominated by student-centered
pedagogical beliefs that characterize science as dynamic and integrated within a social and
cultural construct. For comparative purposes each of the five TBI codes can be assigned a
numeric value of one to five (1=traditional; 5=reform-based) to generate a total TBI score for
each participant. Scores can range from seven to thirty-five representing the end-members for
14 Table 1.2: Seven semi-structured interview questions from the Teacher Belief
Interview.
TBI Question
1 How do you maximize student learning in your classroom? 2 How do you describe your role as a teacher?
3 How do you know when your students understand?
4 How do you know what to teach and what not to teach?
5 How do you decide when to move on to a new topic in your class? 6 How do you know when learning is occurring in your classroom? 7 How do your students learn science best?
Pre-development interviews were conducted shortly after participants were selected
to work on the project, but before they had any formal interaction with their teams or with
project leadership. Post-development interviews occurred when participants completed the
development, piloting and final revision of their team’s materials. Consequently, the time
between participants pre- and post-development interview typically fell between one and two
years. Interviews of participants took place in person or over the phone, and consisted of two
phases: (1) a preliminary round of informal questioning, and (2) the semi-structured format
of the TBI. The semi-structured portion typically lasted between 20 and 45 minutes with an
average time of 30 minutes. The preliminary phase began with a short description of the
interview process. We asked interviewees to comment on their progress with the
development of their instructional materials. Most discussions then addressed the nature of
their current classes. We chose this initial questioning strategy to ease participants into the
interview and to put them in the frame of mind to think about their teaching. Subsequently,
occasions when an interviewee’s responses dictated a deviation from the pre-determined
sequence. The interviewer took the stance of a passive participant in the second phase of the
interview to limit any potential for biasing the interviewees’ comments and to preclude
leading the participants. Probing questions were asked after the instructor had introduced a
topic and most of these supplementary questions guided interviewees to elaborate on the
meaning of commonly used pedagogical terms such as “hands-on activities”, “engaged”, and
“facilitating” or to describe what a certain activity would look like in their class. These
clarifications were necessary to ensure that we could accurately code each TBI question. Pre-
and interviews were conducted in the same way with the exception that the
post-development interview also included the additional final question, “Do you think that
working on the InTeGrate project has affected your teaching in any way?”
Qualitative Reliability
Interviews in the current study were co-coded by two researchers that resulted in a
Cohen’s Kappa value of inter-rater agreement of 0.84 which qualifies as ‘good’ co-coder
agreement (Cicchetti & Sparrow, 1981). One coder was the primary investigator while the
other was completely independent of the research and the study’s participants. It was not
possible to assess changes in teaching practice for comparison with changes in teaching
beliefs due to the broad geographic distribution of participants and the lack of control
observations. However, others have reported that the TBI shows a strong significant
correlation with classroom observations of teaching practice (Ryker, McConnell, Bruckner,
& Manduca, 2013). Ryker et al. (2013) compared TBI scores and observations of geoscience
16 (RTOP). RTOP (Sawada et al., 2002) describes the degree of reformed teaching in a
classroom based on five subscales (Lesson Design and Implementation, Content:
Propositional Knowledge, Content: Procedural Knowledge, Student/Student relations, and
the Instructor/Student relationship) and has well documented validity (M. Piburn, Sawada, &
Turley, 2000; Sawada et al., 2002) and reliability (Amrein-Beardsley & Popp, 2012; Sawada
et al., 2002). TBI scores had a strong positive correlation (R2 = 0.60) with RTOP scores
(Ryker et al., 2013). This suggests that teaching beliefs measured by the TBI have
complementary classroom practices.
Quantitative Instrument
The Beliefs about Reformed Science Teaching and Learning (BARSTL) survey
(Sampson & Grooms, 2013) measures an instructor’s construct of reformed pedagogical
beliefs. The BARSTL survey consists of thirty-two statements evenly divided among four
sub-categories: 1) How people learn about science; 2) Lesson design and implementation; 3)
Characteristics of the teacher and learning environment; and, 4) Nature of the science
curriculum. Instructors respond to each statement with one of four options on a Likert
survey: strongly agree (SA), agree (A), disagree (D), or strongly disagree (SD). Sixteen of
the thirty-two items were traditionally-phrased statements and were reverse scored (i.e., the
more traditional the instructors teaching beliefs, the lower their score). Traditionally phrased
items represent a post-positivist perspective of knowledge emphasizing the transmission of
knowledge from instructor to student. The other sixteen statements were reform-phrased
items that represented a constructivist view that the individual creates knowledge and it can
aligned an instructor’s pedagogical beliefs were with reform ideologies (Sampson & Grooms,
2013). The BARSTL survey requires participants to respond to Likert items that generate
ordinal data. This form of data is commonly used in the social sciences to create overall
scores by assigning the ordered responses a numerical value (Boone et al., 2011) and these
scores are used for various parametric statistical tests. However, ordinal data often do not
meet the fundamental assumptions necessary to apply parametric statistical tests (Bond &
Fox, 2007). Ordinal data are not linear, equal interval, and often are not normally distributed
(Bond & Fox, 2007; Boone et al., 2011). Additionally, ordinal data are not additive and
simply changing the numeric values assigned to categories can severely affect the overall
scores and interpretation of respondents’ performances. We did not use raw scores from the
BARSTL surveys that could have been obtained from assigning numeric values to the
four-item Likert scale. Instead, we report BARSTL scores as scaled values, referred to from this
point as person measures that were calculated using Rasch analysis. Winsteps Rasch analysis
converted raw survey scores into person measures in an effort to better characterize results
from the BARSTL survey. Person measures are expressed in logits (log-odds units), which
are equal-interval units that can be applied to parametric statistical tests because they avoid
many of the issues of the non-linearity of rating scales as well as the non-linearity of raw
survey data (Boone, Staver, & Yale, 2014).
George Rasch (1960) developed Rasch analysis that represents a one-way
probabilistic approach based on Item Response Theory (IRT). The application of Rasch
measurement in the social sciences has been most notably discussed in the 1967 Invitational
18 al., 2011; Choppin, 1985; Libarkin & Anderson, 2005; Linacre, 1998, 2006, 2010; Siegel &
Ranney, 2003; R. M. Smith, 1991; Tong, 2012; Mark Wilson & Adams, 1995; Wright &
Stone, 1979; Wright, 1977, 1984). Rasch modeling is both norm-referenced (comparing
individuals to the group) and criterion-referenced (measured according to specific standards;
Siegel & Ranney, 2003). This is accomplished by considering the difficulty of the item on a
continuum, the participant’s response to that item (ability), and the probability that a
participant will choose a response (Boone et al., 2014). Winsteps software (Linacre &
Wright, 2000) was used to compute person measures for the BARSTL survey results for all
participants in this study, and to transform the original logit range to a more comparable, but
still linear, scale ranging from 0 to 100. Just as with the raw survey data, a higher person
measure indicates more reformed pedagogical beliefs while a low person measure indicates
beliefs that are more traditional.
Wright Maps (also known as person-tem maps) were constructed using logit values
for person measures and items (Wilson & Draney, 2000). Wright Maps are a method of
displaying complex rating scale and test data (Boone et al., 2014) and place items and person
measures on the same linear scale, much like a ruler. Wright maps can simultaneously
display both items and person measures because Winstep Rasch analysis transforms both
data types into logits (Boone et al., 2014; Linacre & Wright, 2000).
BARSTL Survey Reliability and Validity
In their validation of the BARSTL survey Sampson & Grooms (2013) showed that
the instrument was reliable (α=0.77, p=0.001). Item review panels, sub-scale correlations,
validity (Sampson & Grooms, 2013). In addition to calculating standard reliability values,
Winsteps software allows the researcher to determine both the person and item reliabilities
using the scaled logit values as opposed to the non-linear values commonly used in a
Cronbach alpha calculation. Any measurement of reliability is limited to considering how
items are related to one another (Cortina, 1993; Cronbach, 1951). Rasch analysis
simultaneously considers the reliability of items and an individual’s responses to those items
to generate a reliability values for persons (similar to the Cronbach alpha) and a value for
item reliability (similar to a Cronbach alpha but pertains to the inter-item relationship).
Winsteps Rasch analysis yielded acceptable reliabilities and separation indices using
participants’ responses to the BARSTL survey for persons and items (Table 3) indicating that
the instrument displays good internal reliability. Separation indices greater than one indicate
that the sample size is sufficient to locate items along the trait of interest (Linacre & Wright,
2000; Table 3); reformed pedagogical beliefs. Winsteps Rasch analysis also allows the
researcher to quantify pre- and post-survey bias by calculating differential item function
(DIF) values for all survey items. DIF is a measure of how consistently an item or survey
measures a group of respondents or if a particular group of respondents preferentially
performs better or worse on a particular item (Boone et al., 2011). None of the thirty-two
items in the BARSTL survey display significant DIF values (p<0.05). Reliability values,
separation indices, and DIF values calculated in Winsteps suggest that the BARSTL survey
has reasonable construct validity as a measurement instrument (Boone et al., 2011; Linacre &
20 Table 1.3: BARSTL Person and Item Reliability Values
Pre-Development Post-Development
Person Item Person Item
Separation Index 1.90 3.11 5.03 3.46
Reliability 0.78 0.91 0.86 0.92
Results Teacher Belief Interview Results
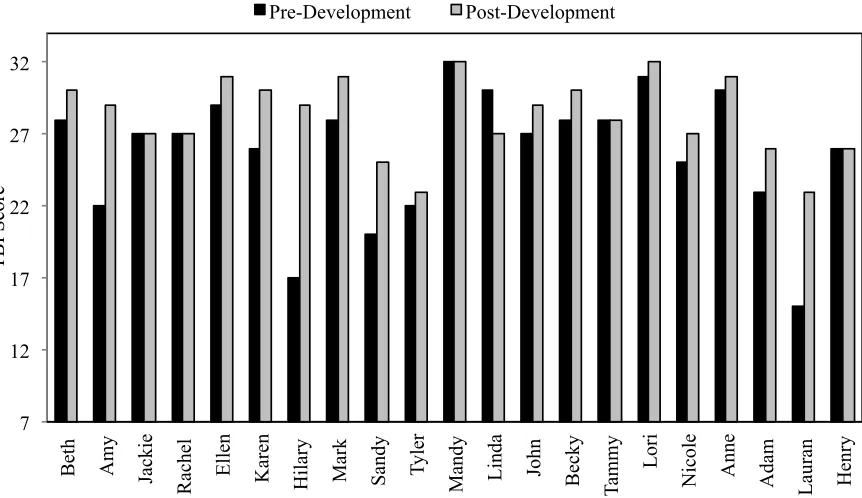
A majority (71%) of the participants show gains on their TBI scores from pre- to
post-development interviews (Figure 2). TBI scores are approximately normally distributed
from the both phases of the interviews based on visual analysis of Q-Q plots. A
pre-development kurtosis value of 0.548 (standard error of 0.972) and a skewness value -0.999
(standard error of 0.501); and a post-development kurtosis value of –0.545 (standard error of
0.972) and skewness value of -0.415 (standard error of 0.501) also support the assumption of
a normal distribution. No outlier values were detected using the outlier labeling rule and
g-factor described in Hoaglin & Iglewicz (1987). Pre-development TBI scores range from 17 to
32 with a mean score of 25.8. Post-development TBI scores range from 23 to 32 and have a
mean score of 28.2. There is a statistically significant (t(20)=3.43, p=0.003, d=0.70 ) change
toward more student-centered responses with a moderate to high effect size. Participants with
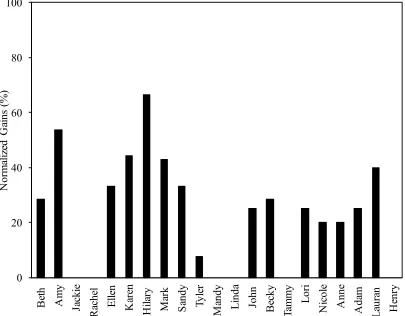
the lowest initial TBI score exhibited the greatest normalized gains in the post-development
TBI score (Figure 3). Fifteen of the 21 participants improved their TBI scores representing a
shift toward more student-centered pedagogical beliefs; five instructors showed no change in
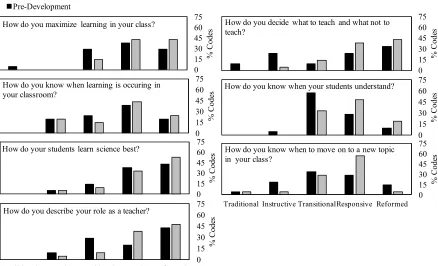
Responses to four TBI questions (How do you maximize learning in your class? How do you
describe your role as a teacher? How do you know when learning is occurring in your
classroom? How do your students learn science best?) do not show significant shifts between
the pre- and post-development interviews (Figure 4). Responses to the remaining three
questions (How do you know when to move on to a new topic in class? How do you decide
what to teach and what not to teach? How do you know when your students understand a
concept in class?) showed the greatest divergence among the participants and all demonstrate
a significant shift toward more student-centered codes for the post-development interviews
(Figure 4).
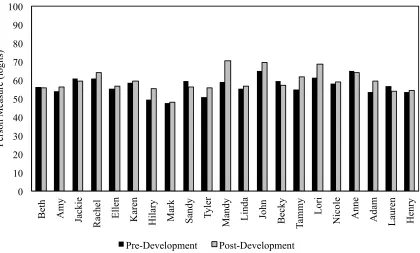
Figure 1.2: Graph displaying participants’ pre- and post-development TBI scores.
7 12 17 22 27 32 Be th A m y Ja cki e Ra che l E ll en K are n H il ary M ark S
andy Tyl
er
M
andy Linda John Becky
Ta m m y L ori N ic ol e A nne A da m L aura n H enry T BI S core
22 Figure 1.3: Normalized gains for the pre- to post-development interviews.
0 20 40 60 80 100 B et h Am y Ja cki e R ac he l
Ellen Kare
n H ila ry M ar k S
andy Tyler
M
andy Linda John
Figure 1.4: Histograms showing the distribution of codes on the pre- and post-development interviews for all seven TBI questions. Questions in the left column show little change between pre- and post-development surveys while questions listed in the right column show more significant change.
Description of variability in TBI responses
When asked how they maximized learning in their classrooms, responses ranged from
transitional where Sandy stated: “I try to make them feel very open and I hope to convey to
them that I welcome questioning and commenting at any time…” to more student-centered
responses where Anne noted: “I think setting up the environment where they can take
responsibility for their own learning and really process things on their own…” Sandy focused
0 15 30 45 60 75 % C ode s
How do you decide what to teach and what not to teach? 0 15 30 45 60 75 % C ode s
How do you know when your students understand?
0 15 30 45 60 75 Reformed Responsive Transitional Instructive Traditional % C ode s
How do you know when to move on to a new topic in your class?
0 15 30 45 60 75 % C ode s
How do you maximize learning in your class? Post-Development Pre-Development 0 15 30 45 60 75 % C ode s
How do you know when learning is occuring in your classroom? 0 15 30 45 60 75 % C ode s
How do your students learn science best?
0 15 30 45 60 75 Reformed Responsive Transitional Instructive Traditional % C ode s
24 on creating positive environment (transitional) while Anne focused on creating an
environment where students can take charge on their own learning (reformed).
When questioned about how they view their roles as teachers, some participants
described a transitional role, for example, Amy reported “I’ve got to make sure I tell them
that I struggled with certain things when I was a student…I share things like that with them
so they realize that they are at a normal place…” Nicole’s response provides a more
reformed, student-centered, conceptualization of the role of a teacher “I customize my classes
to what I think students will most relate to. As long as they met the student learning
outcomes I’ll still customize it so that I feel that they can relate to the material and carry it
kind of away and use it in their real life.”
The question “How do you know when learning is occurring in your classroom?”
seeks to clarify an instructors conceptualization of assessment (Luft & Roehrig, 2007). When
discussing how to assess learning Hilary specified that she emphasized “The write-ups for
the labs that they turn in” and with “bigger assessments [exams] at the end of three or four
chapters…” This is an instructor-centered response where she primarily focuses on formal
summative assessments. Conversely, Mandy stated “[In class] when students are starting to
ask the level of detail of questions showing that they are really noticing the nuances of the
data…” This description is more student-centered, focuses on the student’s and their
knowledge, and demonstrates that she is looking for students to initiate a significant
interaction with either her or possibly asking these questions with their peers.
Participants responses to “How do your students learn science best?” were mostly
that his students learn science best “by actually working problems” and “if they sort of get
the chance to apply what they have learned” to more student-centered responses from Jackie
asserted that her students learn best “when they are doing something that has no right or
wrong answer. When things that they do have multiple answers, you [students] can ask
multiple questions” and she elaborates further by stating that when “The answer is not the
end. An answer can be questioned…” is an experience when where students often best learn
science.
Responses to three questions (How do you know when to move on to a new topic in
class? How do you decide what to teach and what not to teach? How do you know when your
students understand a concept in class?) were the more likely to be coded as “traditional” in
the pre-development interviews. When asked about when to move on to a new topic the
responses ranged from an instructor-centered response from Hilary during her
pre-development interview that focused on schedule and time constraints “I really can’t spend
more than the…on whatever topic we are scheduled before there is just so much material that
needs to be covered.” Moving along the coding spectrum, we can examine a transitional
response from Tyler’s pre-development interview that included the students in the decision
about when to move on “I pause when they are producing some results…So there are sort of
intermediate steps along the way that I can see if they identify this rock sample correctly…”
Unlike Hilary’s response, Tyler based his decision to move on partly on the students. An
example of a reformed, student-centered reply can be read in Ellen’s post-development
interview response “In that case I might run the lecture over into the next time or have a
26 to redesign the lecture.” Ellen is not only considering whether or not students “get” the
information but also verbalized the option of revisiting concepts and redesigning future
lessons based on her current students’ experiences with the content.
The responses to the question “How do you decide what to teach and what not to
teach?” show a similar variability. For example, a traditional response from the
pre-development interviews comes from Hilary who stated “Well of course time is always a
constraint…and then if there is extra time then I have more that I can teach”. She also noted,
“I have topics that I want to make sure that I cover over the course of the semester.” This
indicated a traditional adherence to syllabus and time constraints. A transitional response,
such as John’s, from his pre-development interview where he declared “I think of what skills
and knowledge in geology contribute to understanding…that’s what focuses my teaching,
because majors make up 90% of my class.” John’s statement described a distinct shift away
from instructor-centered decisions and situational factors to thinking more about his students
when he chooses class topics. A reformed response comes from Anne’s post-development
interview when she described something she had done recently in one of her courses. She
said “I kind of modified the class the second time around to give them [students] a lot more
chances to practice peer teaching so that they felt more comfortable before teaching their
own classes.” In this response, Anne not only considered the needs of her students, (much
like John), she also used that student-generated feedback to modify future iterations of her
class.
Participant responses were again variable ranging from instructor-centered to
instructor-centered response was evident in Sandy’s pre-development description of this process “I
guess, you know, I give them [students] quizzes, pop quizzes, but it is not so much to gauge
what they understand as to keep them, you know, on track and constantly engaging in the
material.” Again, in a similar phrasing for instructor-centered responses to learning, she
focused on formal assessment delivered by the instructor. Reformed responses to this
questions are defined by an instructors ability to determine when students have shown the
application of knowledge outside of class or in a novel setting (Luft & Roehrig, 2007). An
example of this can been read in Mark’s post-development response “I know that they’ve
[students] understood a concept if they can relate something in the real world, based on that
concept…” Tammy’s post-development response also places an emphasis on the application
of knowledge outside of classroom constraints: “I guess when they tell me something that I
don’t know, or something that I haven’t thought about or they have an inspiration or
something that makes them want to go further than the original constraints of the
assignment.”
Responses from participants showing the highest gains.
Instructors with the greatest normalized gains between pre- and post-development
interviews display the most significant changes in their responses to interview questions.
Amy, Karen, Hilary, Mark, and Lauren all show a 40% or greater normalized gain between
their pre- and post-development TBI interviews (Figure 2). We can gain some insight into
individual instructors changing beliefs by examining Amy and Hilary’s responses to TBI
questions. These two instructors exhibited the broadest change between the pre- and
28 participants overall code for a response shifts among the three broad categories of
pedagogical beliefs (instructor-centered, transitional, and student-centered) defined in Luft &
Roehrig (2007). An example of a significant shift would be if an instructor initially
responded to a question in a manner that received a traditional code, while their
post-interview response was transitional. Amy showed significant shifts toward more
student-centered beliefs in her responses to several questions. Amy described her role as a teacher in
the pre-development interview stating “I’ve got to make sure I tell them that I struggled with
certain things when I was a student” and “I try to share things with them so they realize that
they are at a normal place.” Her words illustrate transitional pedagogical beliefs by focusing
on establishing a welcoming and positive classroom environment. Her response shifted from
transitional to student-centered in the post-development interview where she described her
role as “fostering questions, having them ask questions and be really curious about the
world” and she elaborates on this point stating, “I want them to be curious and I want to
foster that curiosity.” Amy had instructor-centered ideas about how to decide when to move
on in class during the pre-development interview. Initially she stated “I focus mostly on time
constraints” and “I assign a schedule, it’s not incredibly rigid, but it is structured.” This
instructor-centered focus became more student-centered in post-development because Amy
incorporated feedback from students with the possibility of revisiting topics. For example,
she stated “when they tell me they are still not understanding then I will build something into
the future classes” and “If they [students] need an extra day to review or synthesize
everything then I am okay with adding an extra day to do that.” This student-centered theme
pre-development interview she described the process of assessing learning very transitionally “I
try to arrange the course material so that things sort of repeat themselves” and she does not
continually assess students, “I don’t necessarily assess students along the way…” During the
post-development interview, Amy describes more student-centered practices stating “I listen
to how they are communicating with their group mates” and she elaborates on this theme
stating that she knew they were learning when “they were questioning each other and
working through it”.
Hilary also showed significant shifts towards more student-centered responses on
several questions (Figures 2, 3). During the initial interview, Hilary described how she
assessed student understanding, “There are always the assessments, and with assessments I
do try to mix it up a little bit…” This suggests a focus on measures given by the instructor.
She went on to say, “If they actually come to a…some kind of solution [correct] to this
problem…” and here she was not only focusing on assessments but on the correct solutions
to those assessments to gauge understanding. Together these two responses align with a
transitional pedagogical belief system. However, in the post-development interview Hilary’s
response shifted to a more student-centered view, stating “when they can come up with a
very…an original idea or thought” and “when they [students] are getting the information and
maybe making comments on how this is useful or important to them…” The question about
determining what to teach in class received the most traditional responses (Figure 4). During
her initial pre-development interview Hilary responded in an instructor-centered way where
she stated “time is always a constraint…I do have topics that I want to make sure I cover
30 towards student-centered where she stated that she chooses topics “that they can internalize
and see the importance of those things, whether you are a geologist, a teacher, or construction
worker things that are going to affect their everyday life.” This response showed a
student-centered focus on science literacy and she elaborated further when asked why she chooses
topics in this way “It’s not because they are students, but because they are humans.” When
asked during the pre-development interview how she assesses learning in the class Hilary
stated “I kind of have these bigger assessments at the end of three or four chapters.” Initially
she has an instructor-centered focus on summative assessments given after she covered topics
in class. This view changed during the post-development interview where she responded in a
more student-centered manner by stating that she assessed learning by “the discussions
really, again they [students] give me a very good idea of what’s going on during a week to
week basis.” She was focusing on interactions among students to determine if learning
occurred and she was continually doing this as opposed to focusing on summative
assessments given after the fact.
BARSTL Survey Results
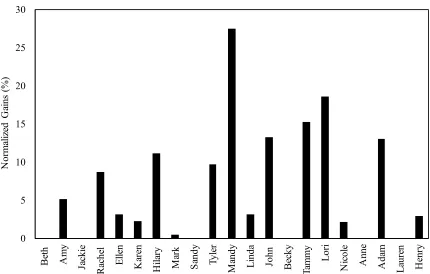
Figures 5 graphs person measures calculated by Winsteps Rasch analysis and Figure
6 shows each participant’s normalized gains. BARSTL scores, as represented by person
measures from the pre- and post-development phases, are normally distributed based on the
visual analysis of Q-Q plots. Pre-development kurtosis value of -0.325 (standard error of
0.972) with a skewness value of -0.157 (standard error of 0.501), and a post-development
kurtosis value of 0.262 (standard error of 0.972) with a skewness value of 0.562 (standard
detected using the outlier labeling rule and g-factor described in Hoaglin & Iglewicz (1987).
There was a statistically significant (t(20)=2.74, p=0.013, d=0.50) improvement toward
more reformed responses on the survey with a moderate effect size. Fifteen of the twenty-one
participants’ BARSTL survey scores increased on the post-development survey.
Pre-development person measures range from 47.17 to 64.21 with a mean of 56.70.
Post-development person measures range from 47.39 to 69.89 with a mean of 59.13. In contrast
with the TBI scores, participants with the lowest initial person measures do not show the
most significant gains (Figures 5, 6). Many of the participants do show improvement but
there is little correlation between the degree of improvement and their pre-development
32 Figure 1.5: Graph displaying participants’ pre- and post-development BARSTL survey measures. 0 10 20 30 40 50 60 70 80 90 100 Be th A m y Ja cki e Ra che l E ll en K are n H il ary M ark S
andy Tyl
er
M
andy Linda John Becky
Ta m m y L ori N ic ol e A nne A da m L aure n H enry P ers on M ea sure (l ogi ts )
Person Measures from the BARSTL Survey
Figure 1.6: Normalized gains for the pre- and post-development BARSTL surveys.
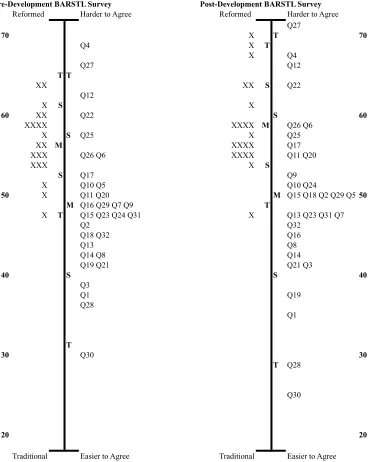
Wright Maps in Figure 1.7 display the person measures of each participant and the
item measures for the pre- and post-development surveys. The right side of each Wright map
displays item measures and item position. Higher item measures (located toward the top of
the map) represent the most difficult items and items at the bottom of the map represent the
least difficult items. Only the higher scoring participants agreed or strongly agreed with
difficult items while both high and low scoring participants agreed with less difficult items.
The BARSTL survey contains equal numbers of reform-phrased and traditionally-phrased
0 5 10 15 20 25 30 B et h Am y Ja cki e R ac he l
Ellen Kare
n H ila ry M ar k S andy Tyl er M
andy Linda John
B ec ky Ta m m y L or i N ic ol e A nne A da m L aur en H enr y N or m al iz ed G ai ns ( % )
34 items and the latter are scored in reverse. Therefore, participants who stated that they
disagreed or strongly disagreed with traditionally-phrased items would obtain a higher total
point value and be placed higher on the Wright map (see X values on left side of each Wright
map in Figure 1.6). The left side of the Wright Map places all of the participant’s person
measures (shown in logits) on the same linear scale as the items. More reformed instructors
will have a higher score and be located toward the top and instructors with more traditional
teaching beliefs will have lower scores and be located toward the bottom. Participants person
measures calculated from the post-development surveys show a significant shift toward more
reformed pedagogical beliefs (positioned higher on scale along left side of figure in
Figure 1.7: Wright maps created using Winsteps software for the pre- and
post-development BARSTL surveys. Item measures are displayed on the right side of each map and participants’ scores (person measures) are displayed on the left. Along the line dividing items and participants, the letter “M” represents the mean item or person measure, “S” represents one standard deviation away from the mean, and “T”
represents two standard deviations away from the mean.
Pre-Development BARSTL Survey Post-Development BARSTL Survey
Reformed Harder to Agree Reformed Harder to Agree
Q27
70 X T 70
Q4 X T
X Q4
Q27 Q12
T T
XX XX S Q22
Q12
X S X
60 XX Q22 S 60
XXXX XXXX M Q26 Q6
X S Q25 X Q25
XX M XXXX Q17
XXX Q26 Q6 XXXX Q11 Q20
XXX X S
S Q17 Q9
X Q10 Q5 Q10 Q24
50 X Q11 Q20 M Q15 Q18 Q2 Q29 Q550
M Q16 Q29 Q7 Q9 T
X T Q15 Q23 Q24 Q31 X Q13 Q23 Q31 Q7
Q2 Q32
Q18 Q32 Q16
Q13 Q8
Q14 Q8 Q14
Q19 Q21 Q21 Q3
40 S S 40
Q3
Q1 Q19
Q28
Q1
T
30 Q30 30
T Q28
Q30
20 20