EXPERIMENTAL INVESTIGATION AND ENGINEERING
INTERPRETATION ON SHEAR-CRACKING IN RC WALLS DUE TO
CYCLIC LOADING
Gianluca Ruocci1, Dina Chebl2, Silvano Erlicher3, and Philippe Bisch4
1 Engineer, Ph.D., EGIS Industries, Montreuil, France ([email protected]) 2 Research Master Fellow, EGIS Industries, Montreuil, France
3 Chief Engineer, Ph.D., EGIS Industries, Montreuil, France
4 Professor at ENPC (France), Expert, EGIS Industries, Montreuil, France
ABSTRACT. This paper aims at enhance the understanding of cracking phenomena in RC panels under
cyclic loading through experimental and numerical investigations. Different measuring techniques are employed to assess the structural behavior and quantify cracking in a shear-wall mock-up. A crack assessment procedure is developed to calculate crack widths and distances from the stresses given by a finite element model with a macroscopic nonlinear law for reinforced concrete. The philosophy in this approach is to directly link numerical simulations to standard engineering practice. Preliminary results are validated based on the experimental evidence.
INTRODUCTION
The limitation and control of cracking is a key-point in the design of Reinforced Concrete (RC) structures of nuclear power plants (NPP). Cracking is a major threat for the tightness and durability of industrial structures because it leads to loss of confinement and exposure of rebars to corrosion. Cracking control is normally required against the serviceability limit state. However, for nuclear facilities, tightness must be preserved also throughout extreme events, for instance earthquakes. This implies the need to estimate cracking during and after severe actions. The response of NPP buildings to seismic excitation is mainly governed by thick RC walls that are subject to high shear stress. Diagonal cracks are observed, whose spacing and width are hardly predictable by standard design codes. Indeed, their formulas are mainly developed for beam elements and the extension to bi-dimensional elements is not straightforward. Some theories have been developed to address the prediction of cracking in RC membranes (see e.g. works by Vecchio et al. (1986), Kaufmann et al. (1998) and Pimentel et al. (2010)). However, due to the complexity of the problem further investigations are still required, above all about crack width measurements and predictions.
In this study we focus on the cracking of RC shear-walls subject to cyclic loading from an experimental point of view. Moreover, an engineering interpretation is proposed, based on the method introduced by Pimentel et al. (2010). The aim is to get a better understanding of such a complex phenomenon from experimental evidence and a two-steps procedure based on finite elements (FE) simulations and a posteriori cracks assessment. A macroscopic approach that relies on a homogenized strain field is assumed to reduce the computational cost in the prospect of the analysis of real structures. Predictions for cracks spacing and widths are obtained by following the bond shear stress-slip relationship and interlocking shear transfer at cracks proposed by Pimentel et al. (2010). A preliminary estimation is compared with the results coming from an exhaustive experimental campaign.
THE EXPERIMENTAL CAMPAIGN
analyze cracks due to shear loading and prevent bending cracking mode. The experimental mock-up was equipped with several sensors to obtain an extensive database about the structural and cracking behaviors.
Shear-wall mock-up design and testing
The experimental mock-up is a reduced-scale model of shear walls commonly employed in NPP to resist horizontal loadings like those coming from seismic excitations. The mock-up measures 4200mm in length, 1050mm in height and it is 15mm thick. A scale factor of 1/3 is assumed, which leads to “real” dimensions of 12,6m x 3,15m x 0,45m that are representative of a structural member used in industrial buildings. By limiting the slenderness of the wall (height/length ratio is about ¼) the interaction between bending and shear cracking is prevented. The latter prevails and was intended to lead to a large cracks pattern in order to have a clear understanding of the phenomenon.
A C40 concrete mix was used together with steel bars of 10mm diameter spaced of 100mm in vertical and horizontal direction at both faces of the wall. Vertical bars with 25 and 32mm diameter are placed at the extremities of the wall in order to control the crack opening due to bending. The 1% design value for the reinforcement ratio is higher than the usual minimum ratio requirement, which assures the non-brittleness of the wall. This design choice is justified by the aim to extend the crack formation phase before the occurrence of complete failure. Two horizontal concrete beams with high reinforcement ratio are connected to theupper and bottom sides of the wall to allow a better redistribution of the shear force.
The mechanical properties of concrete and steel materials are determined by means of laboratory tests carried out on samples collected from the same provisions used for the test model. The properties of concrete are: Ec = 30 GPa (concrete Young modulus), νc = 0,144 (concrete Poisson ratio), ρc = 2300
Kg/m3 (concrete density), f
cm = 43,5 MPa (concrete compression strength), fct = 3,5 MPa (concrete tension
strength). Steel characteristics are: Es = 200 GPa (steel Young modulus), νs= 0.3 (steel Poisson ratio), ρs =
7850 Kg/m3 (steel density), f
yk = 555 MPa (steel yield limit).
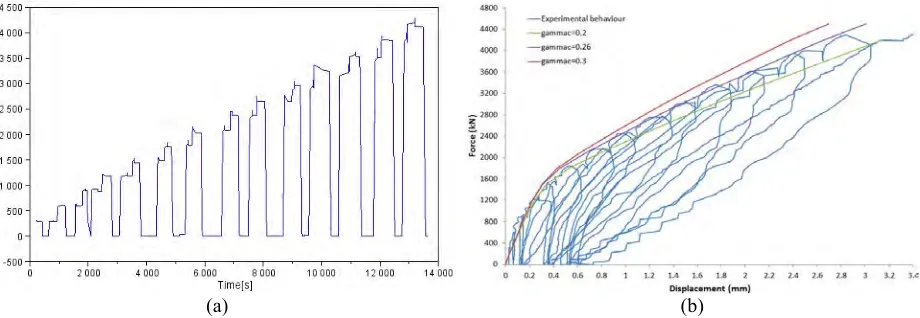
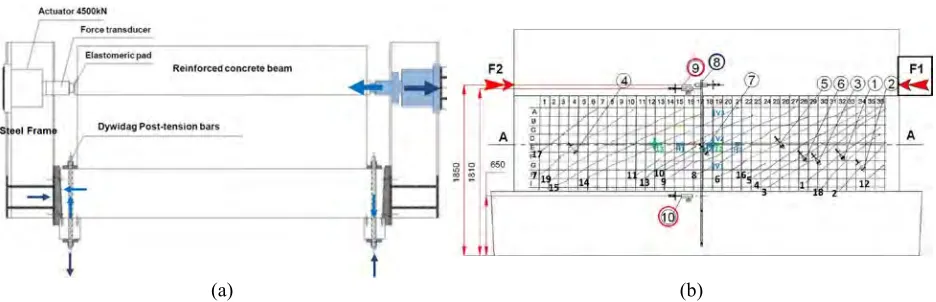
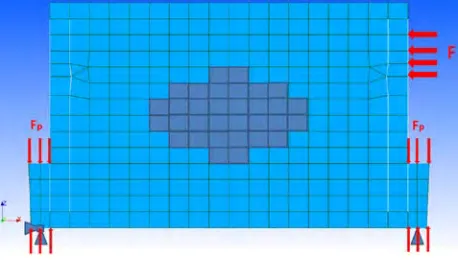
The testing program consists of a cycling loading applied horizontally at one side of the mock-up with force increments of 300kN at each cycle (Figure 1a). The horizontal force is supplied by means of a capacity hydraulic actuator whose axis is located 100mm from the top side of the wall. The force applied is balanced by the testing bench, a steel frame which forms with the concrete wall a self-equilibrated system. Figure 2a shows how the steel frame and the mock-up exchange the internal forces when the lateral force is applied by the hydraulic jack. At the left-bottom side, the horizontal beam distributes the stress transferred through the wall to the testing bench. A mortar joint is used to diffuse the horizontal reaction over the height of the beam. In the vertical direction the displacements of the test body are restrained by means of two couples of Dyvidag bars with 1000kN pre-stress load.
(a) (b)
(a) (b)
Figure 2. (a) Internal and externals loads exchange between the steel frame and the shear-wall mock-up; (b) instrumentation of the test body and visually detected crack pattern at the ultimate load.
Instrumentation of the test body
The mock-up is equipped with different types of sensors to control the test and monitor the structural and cracking behavior. The sensors deployed on the surface and inside the wall are displacement transducers, resistive strain gauges, “long-base” optical extensometers and Bragg fiber optic sensors. For the sake of brevity, this study focuses only on some sensors that proved capable to detect cracks occurrence and provide a direct or indirect measurement of the cracks opening. A more exhaustive characterization of the cracking pattern is achieved by applying a Digital Image Correlation (DIC) technique together with a post-processing algorithm for cracks detection and measuring. The sensors placement and the measurement principles of the DIC technique are here briefly presented together with some preliminary results.
The positions of sensors on the test body are represented in Figure 2b together with the cracks pattern observed at the end of the test. Two 60mm-long resistive strain gauges are glued on the surface of the central portion of the wall. Both gauges measure the surface strains of concrete along the horizontal and vertical directions. Two Fiber Bragg Gratings (FBG) strain gauges are welded to horizontal and vertical steel bars in the middle of the wall. Before welding the bars were scraped and cleaned. The gauges were then protected by an aluminum foil during concrete casting. Measures were acquired by means of a 4-channels optical sensor interrogator. All strain measurements were temperature-compensated. Several Linear Voltage Differential Transformer (LVDT) transducers have been used to measure the relative displacement between the upper and bottom side of the wall (the blue curve of Figure 1b) and the opening of some cracks from their detection throughout the test (Figure 4b). Displacement transducers were placed orthogonal to the crack’s direction.
DIC analysis is performed on the rear face of the wall, opposite to the side equipped with external sensors. Three digital cameras with 4272x2848 pixels resolution and 12 bits encoding are employed to cover the whole surface of the wall. Each camera captures a single portion with a slight overlap to ensure the continuity of the measured fields. The view field is about 2,4m long, which leads to 0,5-0,6mm pixel physical size (i.e., the size of the physical area within each pixel). The expected precision of DIC is about 1/10 of pixel, which corresponds to 50-60µm of measurements precision. In the DIC analysis the displacement field is obtained by correlating the grayscale levels of two images: the first one is taken as reference when the specimen is unloaded, the second one shows the deformed configuration after loading. Most of DIC algorithms find the displacement field by minimizing an objective function Φ(u) defined by:
( )
=[
(
+) ( )
−]
∈ΩΦ
∫∫
Ω g x u f x dx x
where and are 2D functions that take the values of grayscale levels at pixels of reference and “deformed” images, respectively; Ω is the 2D domain window considered for the correlation; x indicates the position of the generic pixel; u is the unknown displacement field. The minimization of Φ(u) is equivalent to maximize the cross-correlation between functions f and g. The unknown displacement field is obtained as the one that maximizes the correlation between the subsets of the two images. Sub-pixel interpolation and multi-resolution approach are commonly employed to enhance the measurement precision by iterating the displacement estimation from coarser to finer scales, see for instance Hild et al. (2002). A first application of this approach to the case of the CEOS mock-up has been investigated by Rouzaud (2011).
The main advantage of DIC is its ability to provide information concerning the whole cracks pattern on the surface of the specimen. The displacements fields resulting from DIC analysis can be derived to obtain strain fields that are then post-processed to measure cracks spacing and width according to the work by Ruocci et al. (2012). A crack is locally detected as a displacement discontinuity that leads to a peak in the strain fields. A “peak-picking” procedure is used to select crack points that linked together form a macro-crack. Cracks orientation and spacing are evaluated based on the regression line of the crack points set. Orientation is defined as the angle between the regression line and the horizontal axis. Crack spacing is averaged over a set of distances between two consecutive regression lines. The cracks width measurement is performed at each crack point as the difference of the displacement vectors evaluated at the two sides split by the crack. The measured displacement is then projected in the crack local coordinate system to obtain the crack opening orthogonal the crack direction and the crack slip along the direction parallel to the crack. Average measures for cracks orientation, spacing, width and slip are obtained for a set of cracks in the central portion of the wall. These values will be used for comparison with the results of the numerical study.
Experimental results
The sensors deployed on the shear-wall mock-up allowed assessing the variation of stress in concrete and reinforcement materials, detecting crack occurrence and measuring local crack opening. Figure 3a and 3b show how strains in respectively horizontal and vertical reinforcement bars vary with the applied cyclic load. As expected, horizontal bars are in compression, while vertical reinforcement is subject to tensile stress. In both cases crack formation is identified by a sudden rise of strain. In the plots, the arrows mark the change in the corresponding measurement signature that is related to the cracks occurrence. The vertical dashed lines show the instant of the visual detection of those cracks that cross or are closer to the strain gauges.
(a) (b)
A good correspondence between measurement results and visual detection is observed. In some cases (sensors H3 and V1 in horizontal and vertical direction, respectively) the indication provided by the strain gauges anticipates the visual crack detection. This could be ascribed to a different crack propagation between the interior and the external surfaces of the wall, or cracks opening too small to be seen naked eye. Stresses in the horizontal reinforcement bar, originally in compression, change progressively towards tensile values due to concrete cracking. Internal stress redistribution takes place and the portion of load initially transferred by concrete is replaced by a supplementary stress in the reinforcement. Stress in the vertical reinforcement increases significantly when cracking occurs, however successive load cycles have minor influence on stress variations. The maximum stress is less than half of the yield state.
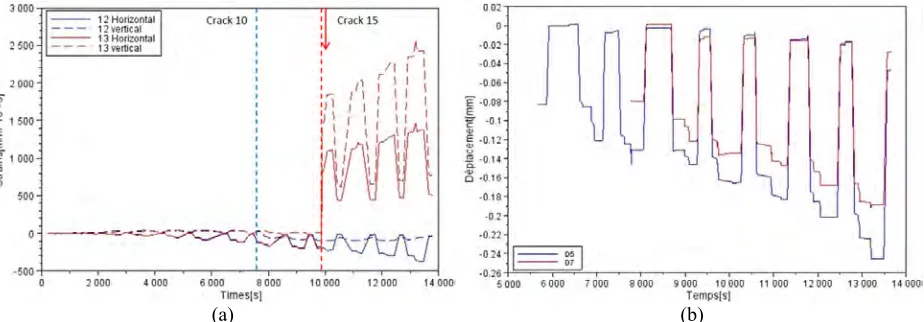
The effect of crack occurrence on concrete strains is documented in Figure 4a. Before cracking, concrete and steel reinforcement strains are compatible. The central portion of the wall is horizontally compressed (solid lines) and in tension along the vertical direction (dashed lines). When a crack appears two responses are observed depending on the relative position between the crack and the strain gauge. Strain gauge 12 is located at the left side of a crack, while the strain gauge 13 is crossed in the middle by another crack. In the first case the response of concrete to crack opening is observed only in the vertical direction, where strains drop instantaneously to negative values. A crack opens when concrete tensile strength is attained. No more stress is transferred by concrete through the crack, with the exception of the “tension stiffening”. Tensile stresses are completely taken by the rebars, while compression in the concrete strut increases.
(a) (b)
Figure 4. (a) Surface concrete deformation measured by gauge 12 (blue curves) and 13 (red curves) for the horizontal (solid lines) and vertical (dashed lines) direction; (b) crack opening measured by LVDTs.
measurement range (60mm). Therefore, portions of sound concrete within the gauge measurement range bias the crack width measure down.
A more reliable measure of crack opening is obtained from the LVDT extensometers that are placed across some cracks when they are visually detected on the surface of the shear-wall mock-up. Figure 4b shows the relative displacement between two fixed points at the opposite sides of two cracks for varying load levels. Since the extensometers are placed orthogonally to the cracks path, the absolute value of the measurements depicted in Figure 4b are representative of the crack width. The dependence of the cracks opening on the applied force is clearly observable. The final opening attains 247μm and 188μm for sensors D5 and D7, respectively. After unloading, the reclosing of cracks is not complete, which leads to residual opening. Irreversible cracks opening increases slightly with cycles up to 15-20% of the maximal crack width at the final load step. However, the crack width estimate provided by the LVDT extensometers could be biased by the sensor calibration performed at the time of its placement when the crack is visually detected and already opened.
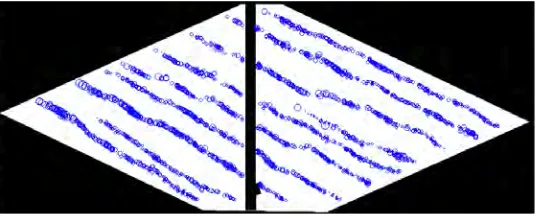
A global characterization of the crack scenario is provided by the DIC analysis. The crack pattern detected at the last load cycle for the central portion of the wall is depicted in Figure 5. The diameter of the circles is proportional to the opening evaluated at each crack point. The orientation of cracks portrayed in Figure 5 is inverted compared to that of visually detected cracks (see Figure 2b) as digital images were acquired on the opposite face of the wall. A good agreement between the two wall faces is observed in terms of number, spacing and orientation of cracks. The symmetry of the cracking mechanisms globally respects the symmetry in the loading and boundary conditions.
Figure 5. Crack pattern at the last load cycle (F=4200kN): circles’ diameter is proportional to crack width.
DIC allows to measure the crack features (i.e., overall crack orientation θr, spacing srm and width
wr) over a large area of the specimen. The values obtained by applying DIC analysis and strain fields
post-processing for the last 3 load cycles are listed in the first columns of Table 1. At this stage of the test, cracking is completely established and stabilized (i.e., no more cracks appear thereafter). This phase is not far from the Ultimate Limit State (ULS) that, according to EC2, represents the achievement of the complete structural failure. In the case of the shear-wall mock-up such state is attained at F = 4738kN. Residual crack opening is about 40% of the crack width measured at the last load cycle. The values in the right-side columns of Table 1 are obtained by post-processing the stress fields resulting from a numerical analysis. The approaches used to obtain these values will be discussed in the following section.
Table 1: Overall crack features evaluated by DIC and computed according to R and F-CMM.
Force
[kN] θr DIC R-CMM F-CMM
[°] [mm] srm [mm] wr [°] θr [mm] srm [mm] wr [°] θr [mm] srm [mm] wr
3600 28,5 98,7 0,099 34,2 113 0,234 28,5 116 0,245
3900 28,5 97,4 0,105 33,8 114 0,250 28,5 116 0,265
ENGINEERING INTERPRETATION OF EXPERIMENTAL RESULTS
The extensive instrumentation used to monitor the shear-wall provides a considerable amount of information about the structural and cracking behavior of the mock-up. However, a more comprehensive explication of complex cracking mechanisms can be obtained from numerical simulations. Finite Elements (FE) analysis is carried out and a nonlinear macroscopic constitutive law is adopted to model the behavior of reinforced concrete under shear loading. In a second stage, a procedure based on the Cracked Membrane Model (CMM) introduced by Kaufmann (1998) and extended by Pimentel et al. (2010) allows computing cracks distances and openings. Two approaches referring respectively to interlock-free rotating cracks and interlocked fixed cracks are analyzed. Some preliminary results are obtained for comparison with experimental results.
Finite Elements modeling of the shear- wall
The FE software Code_Aster (www.code-aster.org) is used to model the shear-wall mock-up by means of four nodes shell elements (Figure 6). A macroscopic constitutive lawcalled GLRC-DM is used to suitably reproduce the response of reinforced concrete to shear loading by tacking the tension stiffening effect into account. This nonlinear constitutive relation requires thin shell elements with uniform symmetrical reinforcement, which is the actual case of the mock-up. The model is completed by the two highly reinforced concrete beams, as well as the steel frame. The mortar layer between the transversal steel beams of the frame and the lower concrete beam of the test body is model by linear springs in order to reproduce the actual boundary conditions. The effect of post-tension in the Dywidag bars that anchor the wall to the frame is simulated by means of 1000kN vertical forces at nodes. The properties of concrete and reinforcement steel are the same derived from the mechanical tests carried out on some samples of the materials used to build the mock-up.
Figure 6. FE model of the shear-wall: boundary conditions represent the effect of the steel frame on the RC wall (see Figure 2a); the shaded elements are those considered in the CMM-based post-processing.
In the implemented constitutive law the post-elastic behavior is ruled by two damage parameters: γt for tensile stress and γc in compression. Their values may vary between 0 (complete failure) and 1
(sound material). In order to better reproduce the experimental result, the damage parameters are tuned by fitting the force-displacement relation obtained from the measurements (Figure 1b). A value of γc equal to
0,26 (purple curve in Figure 1b) provides the best fitting when γt is close to 0. The FE model of the
Post-processing for cracks analysis
The second step in the methodology used for cracks analysis is based on the Cracked Membrane Model (CMM) proposed by Kaufmann (1998). The goal of this theory is to evaluate cracks in concrete membrane elements with uniform reinforcement subjected to shear stresses. Two main assumptions are made: (i) at cracks no stress is transferred by concrete, thus also interlocking effect is neglected; (ii) the bond shear stress between concrete and steel is a constant, which leads to a linear variation of stresses between cracks. Pimentel et al. (2010) proposed a generalization of the CMM to the case of fixed and interlocked cracks. The hypothesis of stress-free cracks is released to take the shear transfer through rough cracks into account. Moreover, reorientation of cracks is prevented by slip occurring at the cracks. The methodology to estimate cracking proposed in this study is inspired to the general theory accounting for fixed and interlocked cracks and it will be hereby designated as F-CMM. The rotating cracks model (R-CMM) represents a particular case that can be treated as well.
In both approaches cracking is evaluated starting from total (or homogenized) stress field resulting from FE analysis. An iterative procedure is used to determine the strain field that allows equilibrating the external membrane loads. The equilibrium is formulated directly at the cracks by tacking steel reinforcement stresses, concrete compression in the struts and shear stress arising from aggregate interlock at cracks into account. Cracks tensile bridging and dilatancy stress, as well as shear dowel effects are neglected. The tension stiffening effects result from the bond shear stress-slip relationship according to the Tension Chord Model (TCM) applied to 1-D elements. A linear-elastic behavior is considered for both concrete and steel. Tensile strength for concrete is set to 0. Strains field through the thickness of the membrane is discretized by a multi-layer model which allows generalizing the calculation to the case of out-of-plane loading and bending. The strains compatibility between concrete and steel rebars is assumed. Stresses are obtained in each layer by applying the constitutive relationships in the global and principal coordinate system for steel and concrete, respectively. The main difference between R and F-CMM intervenes at this stage. In the first, strains are calculated in the principal system, which entails that shear distortions vanish together with cracks lips slip. As a consequence, shear transfer through aggregates interlock is prevented. Differently, for the case of fixed interlocked cracks, a strains transformation is carried out to set the local coordinate system oriented as the cracks angle θr that is
selected as first cracks open and then kept fixed throughout the loading history. The slip occurring between the cracks lips is obtained by multiplying the tangential distortion resulting from the strains transformation for the average cracks spacing. This allows calculating the crack shear stress according to the formulation provided by Pimentel et al. (2010). Once all stresses are known, internal loads in each layer are obtained and then sum up to express the equilibrium with the external loads. The procedure is iterated until the difference between internal and external loads attains a reasonable threshold value.
Maximum cracks distance following x and y directions are computed separately as a function of concrete tensile strength fct, rebar diameters Φx and Φy, steel to concrete areas ratio ρx and ρy and the bond
stress τb0, which is set constant and equal to twice the concrete tensile strength fct.
(
)
(
)
y y b y x x b x ρ ρ τ ρ ρ τ − Φ = − Φ = 1 2 f s ; 1 2 f s 0 ct rmy0 0 ct rmx0 (2)The maximum crack distance srm0 in the direction orthogonal to cracks is obtained by the formula
proposed by Vecchio and Collins (1986) and demonstrated by Kaufmann (1998):
1
rmy0 rmx0
rm0 coss sins
s − +
where cracks orientation θr is expressed as the angle between the normal to cracks and the
horizontal direction. Average spacing is related to maximum spacing according to srm = λsrm0, where λ
varies between 0.5 and 1. The value of λ = 2/3 proposed in the Model Code 2010 (MC10) is used here. Concerning cracks opening, the CMM gives a 2D extension of the EC2 method that, although derived for 1D structural elements, is normally applied to membranes. The average crack width wrm is
calculated as the product of the average cracks spacing srm and the average strain due to cracking ε1(r):
− + = ⋅ = c n cm t n r E , rm ) ( 1 rm
rm s s
w ε ε υε σ (4)
The strain ε1(r) accounts for the expansion in the direction orthogonal to the crack εn, the
compression in the concrete strut εt and the strain related to the average concrete tensile stress in the
direction orthogonal to the crack σcm,n. The average crack opening wrm is obtained by deriving the strain
terms of Equation 4 from the post-processing of the FE analysis results. Only the central portion of the shear-wall is considered (see dashed elements in Figure 6), where parallel diagonal cracks are mainly due to shear. The cracks opening obtained at the last 3 load steps of the shear test for both the R-CMM and F-CMM approach are listed in Table 1 for comparison with the DIC results. In the case of the R-F-CMM, the cracks orientation coincides with the angle of the principal tensile direction, which varies with the applied load. When fixed interlocked cracks are considered, the angle θr is set in the step where cracking occurs
and it is kept fixed thereafter. The measured value of θr is selected at this scope.
The cracks openings obtained for both methods are significantly overestimated compared to the experimental results. The discrepancy in terms of cracks orientation and spacing is less evident. The outcomes of the R-CMM confirm the results of a previous work by Rachidi et al. (2012), where the same approach to crack analysis was carried out in an analytical way. Neglecting the aggregate interlock in the shear transfer at cracks seems to affect adversely the results of the R-CMM. The hypothesis of bond stress τb0 = 2·fct equal for both reinforcement directions and throughout loading is a source of bias also for the
F-CMM. Moreover, a significant dependency of the F-CMM results on the value of θr is observed, which
led to set this parameter equal to the experimental value.
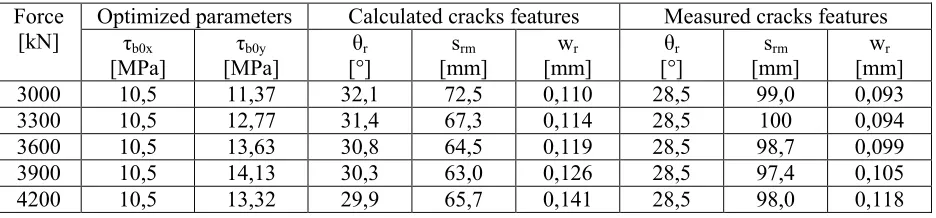
In the light of the mismatch between numerical and experimental results, an optimization procedure is carried out to identify the values of the most influent parameters that allow fitting the experimental evidence. The former hypotheses concerning the bond stress are released. Different values for τb0x and τb0y are selected by means of a nonlinear least-square optimization in order to fit the
experimental values of crack spacing and opening. Equation 5 gives the objective function that is minimized in the optimization framework:
min 2 exp rm exp rm CMM rm 2 exp rm exp rm CMM rm w w w s s s − +
− (5)
The θr value is set equal to the principal stress direction at each load step. The analysis is carried
out for the last 5 load steps of the shear test, when cracking in the central portion of the wall is practically stabilized. For each load level, the optimization gives the value of the bond shear stresses τb0x and τb0y that
allows fitting at best the experimental cracks spacing and opening. The optimized parameters and the resulting average cracks spacing srm and width wrm are given in Table 2. The calculated cracks openings
are closer to the measured values if compared to the case where τb0 = 2·fct equal for both reinforcement
Table 2: Optimized crack parameters to fit the experimental results.
Force
[kN] Optimized parameters τb0x Calculated cracks features Measured cracks features
[MPa] [MPa] τb0y [°] θr [mm] srm [mm] wr [°] θr [mm] srm [mm] wr
3000 10,5 11,37 32,1 72,5 0,110 28,5 99,0 0,093
3300 10,5 12,77 31,4 67,3 0,114 28,5 100 0,094
3600 10,5 13,63 30,8 64,5 0,119 28,5 98,7 0,099
3900 10,5 14,13 30,3 63,0 0,126 28,5 97,4 0,105
4200 10,5 13,32 29,9 65,7 0,141 28,5 98,0 0,118
CONCLUSION
The results of experimental analyses carried out on the CEOS.fr mock-up have been presented and discussed. Different measuring techniques are compared. Both concrete and steel strain gauges detect the crack occurrence accordingly to visual observations. The measured responses are consistent with the physical redistribution of stresses between concrete and reinforcement at cracking. LVDTs and DIC proved capable to respectively quantify local and average crack width. Then, two approaches based on the CMM have been used to calculate cracks features from the stress fields obtained by a FE model implementing a macroscopic constitutive law. Preliminary results show a mismatch between measured and calculated cracks openings which are partially reduced by increasing the shear transfer at cracks when passing from R to F-CMM. Future works will focus to an enhancement of the stress field calculation by testing alternative nonlinear laws. Some alternatives to R and F-CMM will be also investigated.
AKCNOWLEDGEMENTS. The investigation and results reported herein are supported by the French
National Program CEOS.fr sponsored by the French minister in charge of sustainable development (MEEDDM-DRI).
REFERENCES
Comité Européen de Normalisation. (2005). Eurocode 2. Calcul des structures en béton - Partie 1.1 : règles générales et règles pour les bâtiments.
FIB. (2012). Model Code 2010. Final Draft, Volume 1.
Hild, F., Raka, B., Baudequin, M., Roux, S. and Cantelaube, F. (2002). “Multiscale displacement field measurements of compressed mineral-wool samples by digital image correlation,” Applied Optics, 41:6815-6828.
Kaufmann, W. (1998). “Strength and Deformations of Structural Concrete Subjected to In-Plane Shear and Normal Forces,” PhD thesis, Swiss Federal Institute of Technology, Zurich, Switzerland. Pimentel, M., Brüwhiler, E. and Figueiras J. (2010). “Extended cracked membrane model for the analysis
of RC panels,” Engineering Structures, 32:1964-1975.
Rachidi, M., Bisch, P. and Erlicher, S. (2012). “Cracks distance and opening in reinforced concrete membranes: codes predictions vs. experimental measurements,” Proc., Numerical Modeling Strategies for Sustainable Concrete Structures, SSCS2012, Aix-en-Provence, France.
Rouzaud, C. (2011). “Traitement de la mesure par analyse d’image et étude statistique de la fissuration de voiles en béton armé,” Master Report, ENS Cachan and IOSIS Industries, Paris (in French).
Ruocci, G., Rospars, C., Bisch, P., Erlicher, S. and Moreau, G. (2012). “Cracks distance and width in reinforced concrete membranes: experimental results from cyclic loading histories,” Proc., 15th World Conference on Earthquake Engineering, 15WCEE, Lisbon, Portugal.