ABSTRACT
Stewart, Ralsa M. Emerging Educational and Agricultural Trends and their Impact on the Secondary Agricultural Education Program under the direction of Dr. Gary Moore.
The primary purpose of this study was to identify the emerging trends in education and agriculture and their impact on the secondary agricultural education program. The study was conducted to serve the needs of state and national agricultural education program leaders as they develop future plans and activities for the program.
For this study, the researcher did a national solicitation for nominations to identify the experts in education and agriculture. This nomination process was conducted with national agricultural education leaders, state agricultural education leaders, university agricultural educators and agriculture teachers. The call for nominations was sent to 1,160 individuals via email. One hundred and forty-two experts were identified from the nomination process. Seventy-two of experts were in education and 70 experts were in agriculture. This group was narrowed to two panels of 50 experts in education and 50 experts in agriculture for round one. In round two responses were sought from the 32 educational experts and 25 agricultural experts that had responded in round one. In round three, 17 educational experts and 15 agricultural experts responded.
Teaching and Instructional Strategies, Standards, Legislation and Policy, Professional Development, Teacher Attitude, and State Leadership. Agriculture Issues included: Environmental Influences on Agriculture, Technology and Innovation in Agriculture, Food Supply and Safety in Agriculture, Trade Issues in Agriculture, Youth in
Agriculture, and Urban Sprawl/Impact on Agriculture.
It was concluded that many of the educational issues have not changed
Emerging Educational and Agricultural Trends and their Impact on the Secondary Agricultural Education Program
by
Ralsa Marshall Stewart, Jr.
A proposal submitted to the Graduate Faculty of North Carolina State University in partial fulfillment of the requirements for the Doctor of Education in Occupational
Education
Department of Agricultural and Extension Education
Raleigh 2003
APPROVED BY:
In memory of my father
Ralsa Marshall Stewart, Sr.
BIOGRAPHY
On July 2, 1963, Ralsa Marshall Stewart, Jr. was born to Reverend and Mrs. Marshall Stewart in Elizabethtown, North Carolina. Throughout his youth, Ralsa lived in several rural and small town communities across eastern North Carolina. These
communities provided Ralsa with the opportunity to learn, grow and mature as he had the chance to deal with change and diverse people at an early age. In 1968, Ralsa’s brother Brian was born. Today, Ralsa has one son John Marshall Stewart who is ten years old.
Ralsa graduated from Midway High School in Sampson County in June, 1981. He attended East Carolina University for two years before transferring to North Carolina State University where he graduated with a bachelor of science degree in agricultural education in May, 1986. He returned to North Carolina State University on a part-time basis in the fall of 1987 and completed his master’s degree in 1993. He started his doctoral program in the fall of 1996 as a part-time student.
Ralsa began his career as an agriculture teacher in 1986 at Midway High School. In 1988, he was recruited by the National FFA Organization and served that organization through 1993 when he was serving as director of teacher services. From 1994 through 1995 he served as executive director of the National Association for Agricultural Educators. In 1996 he was named as State Agricultural Education Coordinator at North Carolina State University and continues to serve in that position.
ACKNOWLEDGMENTS
The completion of a dissertation is certainly a rewarding and fulfilling experience. Few accomplishments have brought the same satisfaction as the finalization of this
process. As this phase of educational pursuit comes to an end, gratitude is expressed to people who have provided the assistance and influence necessary for this
accomplishment. Those people can be categorized as family, educators, friends and fellow colleagues and professionals.
Special thanks are given to family. First, to John who has demonstrated great support and patience during his father’s degree program. Second, two parents who have been the inspiration for educational goals and pursuits. Third, to a brother Brian who has been a wonderful brother and friend for over thirty-four years.
Thanks go to Dr. Gary Moore for his encouragement as chair of the graduate committee for this degree. Thanks also go to Dr. Jim Flowers, Dr. David Jenkins and Dr. Jim Swiss for service on the graduate committee.
Finally, I thank God for providing great opportunities and giving wisdom in making wise choices. It is because of Him that this goal has been accomplished.
TABLE OF CONTENTS
LIST OF TABLES vii
CHAPTER 1 INTRODUCTION 1
1.1 Statement of the Problem 5
1.2 Research Questions 8
1.3 Definition of Terms 8
1.4 Assumptions of the Study 9
1.5 Chapter Summary 9
CHAPTER 2 REVIEW OF LITERATURE 11
2.1 Trends in Education 12
2.2 Trends in Agriculture 22
2.3 Chapter Summary 31
CHAPTER 3 METHODOLOGY 33
3.1 Research Design 33
3.2 Panel Selection 34
3.3 Instrumentation 35
3.4 Data Collection Procedures 36
CHAPTER 4 RESULTS 40
4.1 Findings Related to the Research Questions 40
CHAPTER 5 SUMMARY, CONCLUSIONS, IMPLICATIONS, AND RECOMMENDATIONS 54
5.1 Summary 54
5.2 Conclusions 56
5.3 Implications 57
5.4 Recommendations 65
REFERENCES 67
APPENDIX A 73
APPENDIX B 75
APPENDIX C 78
APPENDIX D 81
APPENDIX E 93
APPENDIX F 102
APPENDIX G 110
APPENDIX H 118
APPENDIX I 120
APPENDIX J 122
APPENDIX K 124
APPENDIX L 126
APPENDIX M 128
APPENDIX N 130
APPENDIX O 132
vii LIST OF TABLES
Table Page
1 Expert Panel Selection and Participation 35
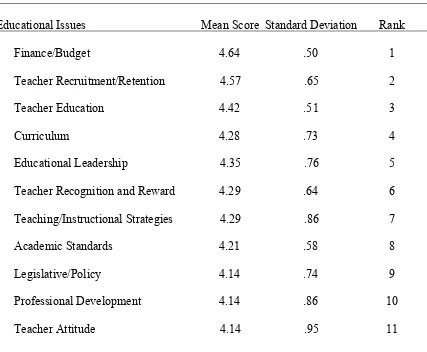
2 Round Two Mean Scores on Educational Issues 43
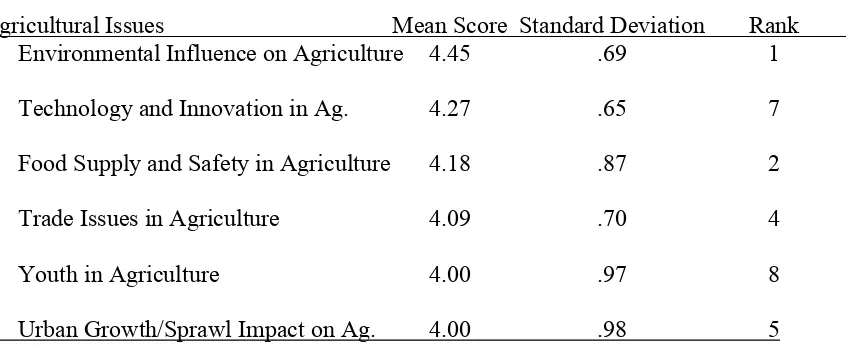
3 Round Two Mean Scores on Agricultural Issues 46
4 Round Three Mean Scores on Educational Issues 48 5 Round Three Mean Scores on Agricultural Issues 49
6 Priority List of Educational Issues 51
CHAPTER 1 INTRODUCTION
Each year, a national publication entitled, THE FUTURIST, produces a top ten forecasts for the year. In 2002, four of their forecasts addressed educational and
agricultural issues as follows (World Future Society, 2002, pp. 1-2):
1. Future farmers could make more money from air than the land by having one
turbine on a quarter of an acre of land. The estimate is that a return of $2,000
per year could be realized versus growing corn, which would bring in a return
of $100 per year.
2. Schools will solve behavior problems with better nutrition. One school
eliminated fights, expulsions and suicides by offering students healthy foods
and not allowing them to fill up on junk foods.
3. Goodbye textbooks, hello networked learning. Printed and bound textbooks
will disappear as more interactive coursework is developed and distributed
over the Internet.
4. Fish farming will overtake cattle ranching as a food source by 2010.
Aquaculture has been the fastest-growing sector of the world food economy
over the past decade, while beef production has stagnated.
These forecasts point out the changes that could be occurring in education and agriculture
in the future. Whether or not these forecasts are true, the important issue to consider is
that change is coming and inevitable.
Herring (1995) stated, “In a dynamic, ever-changing world, I believe that perhaps
the great challenge we face in agricultural education is that of anticipating and managing
change” (pp. 7-8). He predicted that agricultural education would face challenges in the
future in the following areas: agricultural education mission, clientele, delivery system,
modernization of supervised agricultural education programs, teacher education
programs, in-service education programs, reform of agricultural education instruction,
tech-prep, and updating curriculum.
On February 24, 2000 while chairing the 15th Annual Emerging Issues Forum,
The Honorable James B. Hunt, Jr., Governor of North Carolina stated, “In this brief
moment in time, just as we thrust ourselves into a new century, we must decide together
the shape of our common future. We must identify critical issues and make strategic
choices.” (Shaping Our Common Future, Emerging Issues Forum, 2000, p. 1) This
statement points out further the need for this type of study. Choices made today by
identifying critical issues and trends are essential for future planning for any field of
endeavor. Certainly the secondary agricultural education program is no different. The
secondary agricultural education program was first recognized as public school program
when it received federal funding for the first time in 1917 after being recognized by
federal law by passage of the Smith-Hughes Act by the United States Congress (Official
FFA Manual, National FFA Organization, 2001). Although, this educational program
has a long, rich heritage and tradition, it must not live on it’s past accomplishments. In
today’s turbulent educational and agricultural environment, agricultural education
program leaders must make appropriate strategic choices if they are to serve the public in
the days ahead.
According to Ray Kurzweil, 1999 Medal of Technology winner presented by the
World Technology Network, at today’s rate of progress, the next twenty years
2023) will be equivalent to the entire twentieth century in its rate of change. The
following fourteen years (2024- 2038) will be equal the entire twentieth century’s
change. The seven years following (2039-2046) will equal the entire twentieth century’s
changes. Change and progress will continue to occur at a rapid pace. This is reinforced
by Alvin Toffler who indicates that with rapid change students must be taught how to
learn, unlearn and relearn (Case, 2003, slides 1-3).
Change is not a new field of intrigue and study. In 1971, the United States
Department of Agriculture predicted that there would be more change in the next 30
years than there had been in the past 70 years. Thus they were predicting more change
between 1971 and 2000 than had occurred between 1900 and 1971. This prediction of
change was focused on how many people would farm, how many people would need to
be fed, and how food would be distributed around the world (United States Department
of Agriculture, 1971).
The world today is a very competitive environment. Erskine Bowles, former
White House Chief of Staff, stated “The only competitive edge society has is in the skills
and knowledge of the workforce” (Shaping Our Common Future, Emerging Issues
Forum, 2000 p. 12). A highly motivated, well-prepared workforce is vital to a strong
national economy. The significance of this statement is vitally important for many rural,
agricultural communities. This issue is having implications on the national, state and
local levels. For instance, in North Carolina’s rural, agricultural communities, where the
tax rate is more than in urban areas, Bowles (2000) indicates that $50,000 less per
classroom is being spent than is in our urban communities (Shaping Our Common Future,
Emerging Issues Forum, 2000, p. 12). This issue is further complicated when one looks
at the changes that are occurring in the nation’s rural, agricultural communities. For
example, Dr. Mike Walden (2000), North Carolina State University economist, indicated
that impending changes in North Carolina’s tobacco economy will result in a loss of “at
least” $2.2 billion a year and 14,500 jobs per year in that one state alone. These
statements may point to a need for an in-depth assessment of where the agricultural
industry and educational system is headed if the agricultural education program, which is
closely linked to both education and agriculture, is to effectively serve students in the
future.
Demographic shifts in the United States point out another aspect of change that is
occurring and that must be managed. The nation’s population is very fluid and diverse.
These factors are bringing about change in society, schools and communities. Over
forty-three million Americans move every year with half of the United States population
moving to a new address every five years. Seventy percent of Americans live in
metropolitan areas with 40% of that group living in suburban areas (Hodgkinson, 2003).
Today over 12%, one in eight people, in the United States is of Hispanic origin (United
States Department of Commerce, 2003,).
Demographics impact education and agriculture. Issues like school building
construction and urban sprawl are highlighted by these demographic shifts and have
relevance to this study. This expansion was predicted in the 1971 Yearbook on
Agriculture as follows: “By the turn of the century, we will need 400 more towns and
cities and will bring an explosion of urban-type growth in areas that now consist of farm
trading towns, placid villages, and fields and woodlots of farmers.” (p. xvii).
The agricultural education program experienced substantial growth in the
numbers of students enrolled and joining FFA in many states during the 1990’s (National
Council, p. 1-10; National FFA Organization, 2000, p. 1-20). FFA membership is
currently 35% female, an all-time high, while only 39% of FFA members live on a farm
(FFA New Horizons, 2000). These are significant changes for an industry, agriculture,
that has been traditionally male and an organization, FFA, that had its beginning with
farm students. Several factors have aided FFA growth, including but not limited to: (1)
state legislation to reorganize and increase in state leadership staff in “some” states
(North Carolina General Assembly, 1995); (2) significant growth in overall state public
school student enrollment (United States Department of Education, 2000a); and, (3)
major agricultural education curriculum revisions (National Council, 2000). While
significant steps forward are positive in nature, one cannot rest on the accomplishments
of the past. Program sustainability and growth can only continue if the program is
prepared to adjust to the needs of the agricultural industry and dynamics of the
educational system.
1.1 Statement of the Problem
The purpose of the study was to identify the educational and agricultural trends in
the United States to enable leaders of the agricultural education program to make
appropriate decisions regarding the future direction of the agricultural education program.
These decisions would include, but not be limited to, curriculum direction, marketing
efforts, professional development for agriculture teachers, and FFA programming.
First, there has been and continues to be significant changes occurring in the
educational community. The nation has made some major shifts toward more student
testing and accountability, teacher salary increases, and financial incentives for
performance and intervention into low performing schools. These factors have led to
more pressure being placed on schoolteachers and administrators. This is interesting in
light of the that fact that public schools were focused on basics at the beginning of the
1900’s and broadened their focus until the later part of the century when measurement
and evaluation of progress on basic academic areas became the focus again. The 20th century opened with John Dewey’s call for a “science of education.” The push was on
for greater curricular rigor, new forms of schooling, and systematized ways of measuring
school results. The end of the 20th century had the information age spurring a drive for rigorous educational standards, national testing and new forms of schooling (Reeves,
2000). Furthermore, the differences between the funding levels in rural and urban
schools have become a public concern. These funding issues and the increased pressure
on educators has been further complicated by the severe shortage of certified teachers for
the public schools.
Second, there are enormous changes occurring in nation’s agricultural industry.
These changes include the lowest commodity prices in the United States in over 40 years,
consolidations in agribusiness, and increasing pressures on the livestock, poultry, and
dairy industries from environmental advocacy groups. Furthermore, as reported by
former Secretary of Agriculture Dan Glickman, “rural America, where most of the
agricultural production in the nation exists, does not have the transportation, educational,
and communications infrastructure to easily make a shift from the traditional agricultural
economy” (Shaping Our Common Future, Emerging Issues Forum, 2000, p. 13).
Third, there is a need for state and national leaders to focus on emerging trends
and issues in education and agriculture. Warmbrod (1986) indicated that agricultural
education tends to pay greater attention to the significance and importance of those issues
that are researched. This gives greater relevance to the need for identifying those issues
and trends in the future. Buriak and Shinn (1993) reported that there was a need for
maintaining compatibility with the national priorities for the food and agricultural science
system and the educational system and for communicating agricultural education
priorities to agencies and organizations which have national responsibilities to plan and
budget future research.
Frick (1993) identified a list of agricultural education curriculum subject areas of
highest priority to the future of middle grades agricultural education as follows: food
safety/consumer relations; leadership/human relations; careers and future of agriculture;
agricultural science and experimentation; agricultural vocabulary; and agricultural
benefits to the world. This research generated a list of prioritized curriculum needs for
one segment of agricultural education instructors. However, it did not take a more global
view of issues facing the agricultural education program in the future.
In 1977, Stewart and Shinn reported that there were five areas of greatest
importance to agriculture teachers, state supervisors and teacher educators. Those areas
were curriculum development, funding, teacher education, teacher shortage and
evaluation.
The dynamics that are occurring in the educational and agricultural sectors of the
nation create challenges for the agricultural education program. Clearly, the agricultural
education program is the intersection between these two sectors. Knowing the
environment and being able to adjust to the changes occurring in agriculture and
education is critical to the future growth and, in fact, survival of the agricultural
education program.
1.2 Research Questions
Over the years, the educational and agricultural sectors have continued to collect
new data and produce reports regarding their special interests areas. One could find trend
data on educational and agricultural issues. However, these data and these reports have
rarely been considered with the agricultural education program in mind. This study pulls
these two areas together to see what the implications are for the agricultural education
program and to develop ideas for future consideration by leaders responsible for the
agricultural education program. The two research questions for this study are:
1. What are the emerging educational trends in the nation?
2. What are the emerging agricultural trends in the nation?
1.3 Definition of Terms
A number of terms are used in this study that are specific to the agricultural
industry, educational system, and agricultural education program. A listing of those
terms with an appropriate operational definition for this study is as follows:
Agriculture – the food, fiber, and natural resources system including agribusiness,
production, horticulture, aquaculture, forestry, research, etc.
Agricultural Education Program – the career and technical education program designed
for students interested in agriculture in grades seven through twelve.
Charter Schools – schools that are granted the opportunity to operate in a state with state
funding without the traditional regulations that are mandated to traditional public schools.
FFA – the student organization that is an integral part of the agricultural education
program.
Home Schooling – a choice made by parents or guardians to provide kindergarten
through high school education in the home setting.
1.4 Assumptions of the Study
The quality of the environmental scan and forecast information resulting from this
research relies primarily on the panel of experts and on their combined judgment
(Ludwig, 1997). An assumption is made for this research that the experts do have
knowledge of the environment and the ability to communicate effectively. The Delphi is
a “group process technique for eliciting, collating, and generally directing informed
(expert) judgment towards a consensus on a particular topic.” (Delp et al., 1997, p. 168).
1.5 Chapter Summary
The researcher sought to determine the emerging educational and agricultural
trends in the United States. The agricultural education program represents the
intersection between education and agriculture by assessing the trends in these areas the
researcher sought to surface the issues that state and national agricultural education
program leaders must be aware of as they chart the future course of the program.
Furthermore, the researcher attempted to develop specific recommendations for the
national and state leaders of the agricultural education program based on the national
trends occurring in agriculture and education.
This study was needed since there is a gap in the research that ask educational and
agricultural leaders to provide input on the future trends of their particular areas of
expertise and that could be applied to the future direction of the nation’s agricultural
education program. This begins to close that knowledge gap to assist leaders of the
agricultural education program in their future planning.
CHAPTER 2
REVIEW OF LITERATURE
According to Campbell (1983), the identification of issues relevant to the
operation of an enterprise is vital to the enterprise’s success. The first step in issue
management is issue identification (Chase, 1977). The need to anticipate is not new for
agricultural education. Studies such as the one conducted by Stewart and Shinn (1977)
and articles in agricultural education professional publications such as Herring’s in The
Agricultural Education Magazine (1995) point to the need for this type of issue research.
Connors (1998) found that there was agreement among agricultural education
professionals regarding the need for more local funding and strong emphasis on teacher
recruitment and retention. Connors reported concern from agricultural education
professionals in the areas of student recruitment and retention, federal and state funding,
and the development of partnerships and collaborative relationships with business and
industry. According to the Connors study, there was need for updating the technology
used in agricultural education programs.
A difference in the perceived issues of the agricultural education program was
found in what state leaders and agriculture teachers thought versus teacher educators.
State leaders and agriculture teachers agreed that school funding for FFA activities
should be increased and the quality of teacher education programs had declined. Teacher
educators only slightly agreed with the state leaders and agriculture teachers on the
funding issue and strongly disagreed with a decline in the quality of teacher education
programs (Connors, 1998).
In 1985, the National Academy of Science established the Committee on
Agricultural Education in the Secondary Schools at the request of the United States
Secretaries of Agriculture and Education. This committee was to assess the contributions
of instruction in agriculture to the maintenance and improvement of United States
agricultural productivity and economic competitiveness. The principle conclusions and
recommendations from this report were: (1) The focus of agricultural education must
change to encompass more than the traditional vocational agriculture program; (2)
Beginning in kindergarten and continuing through twelfth grade, all students should
receive some systematic instruction about agriculture. (National Academy of Sciences,
1988, p. 2). Daniel Aldrich (1988) stated, “Agricultural education is at a crossroads.”
This crossroad is brought about by the variety of challenges facing education and
agriculture. (National Academy of Sciences, 1988, p. vii).
2.1 Trends in Education
If one word could summarize education in the United States throughout the 20th century, it would be more. Today, more students are attending school for more of their
lives than at any time in the nation’s history. At the beginning of the 20th century, a
majority of Americans ages seven to 13 attended school. But only one in 10 students
attended school beyond age 14 and fewer than seven percent of 17 year-olds graduated
from high school (Olsen, 2000).
In 1900 there were 76.1 million people in the United States and 15.5 million
children in public schools. By this time, 33 states and the District of Columbia had
enacted compulsory education laws. By 1950, there were 152.3 million people in the
United States and 25.1 million children in the public schools with 59% of 17 year-olds
graduating from high school. In 1970, there were over 205.1 million people in the United
States and 45.6 million students in the public schools and 76.9% of 17 year-olds
graduated from high school. By 1990, there were 249.4 million people in the United
States and 40.5 million students in the public schools and 72.4% of 17 year-olds
graduated from high school (Olsen, 2000).
America’s schools have continued to operate as a mirror of society. Whatever
American’s hoped for from society, they assigned to schools to deliver. The public
schools were created to educate citizens of a new nation. A the beginning of the 20th century, schools were expected to assimilate great waves of immigrants as Americans
and transform farm workers into factory and technical workers needed in the industrial
age. Now in the 21st century, schools are frequently asked to provide what parents and other institutions have not. For every social challenge there is a corresponding
expectation that public schools will respond. Examples include: violence, teen
pregnancy, and religious tolerance (North Central Regional Educational Laboratory,
2002a).
The role of the public schools as a mirror of society was recognizable in several
different areas. In the early part of the 20th century, the practice of educating disabled students in regular schools and classrooms was rare. This began to change in 1958 with
the passage of the Education of Mentally Retarded Children Act, which authorized
federal funding to train teachers for teaching mentally retarded children. Subsequent
federal laws in 1965, 1973, 1975, and 1990 provided funding for educational services and
barred discrimination of disabled individuals (Sack, 2000).
Another area that schools have helped to mirror societal issues was with the issues
of desegregation and racial bias. In 1954, the historic Brown vs. Board of Education
decision declared that segregated schools were unconstitutional. Communities were
forced to dismantle systems that required blacks to attend separate schools. This has
been a complicated issue, but assisted the nation in addressing the issue of racial
inequality (Hendrie, 2000).
Vocational education provides another example of how education has mirrored
society. Snedden and Dewey debated the educational value and model that should be
used in vocational and general education in the early 1900’s. In 1917, the Smith-Hughes
Act provided federal funds so that vocational education could be administered and taught
on a mass scale separately from general education, either in its own wing of the a regular
high school or in its own building. Over the years the image of vocational education has
suffered, as it has been perceived as not being as rigorous as academic education. In
1963, the Vocational Education Act was passed and it focused heavily on at-risk students
leading further to the perception that vocational education was not an appropriate course
of study for students that wanted to attend college. In light of this perception, in 1990 the
Carl D. Perkins Vocational and Applied Technology Act and in 1994 the School-to-Work
Opportunities Act attempted to align vocational education more closely with academic
education and to expose academic students to experiences in the workplace. These
reforms have come about as society’s interest and views on vocational education have
changed (Zehr, 2000).
Enrollment in America’s elementary and secondary schools was about 53.5
million in 2000. Public school enrollment in elementary school was 33.9 million while
high school enrollment was 13.7 million (Projections of Education Statistics, USDE,
2000). Of these 13.7 million students in public schools, approximately 14% dropped out
of high school. Overall, the dropout rate has remained relatively unchanged since 1987
(United States Department of Education, 2002). Today, 29.4% of Hispanic youths
dropout of school. This is twice the rate for black Americans and four times higher than
non-Hispanic whites (Washington Post, 2003).
In 2001, there were 1.7 million home school students in kindergarten through 12th grade. This accounts for about three percent of all K-12 students in the United States. In
1999, there were 1,184 charter schools educating over 250,000 students in grades
kindergarten through twelve. Of the total overall school-aged population in the United
States, six million approximately six million attended private schools (Home School
Legal Defense Association, 2002b).
Between 1990 and 1999, per pupil school expenditures increased almost 10%. In
the 1996-97 school year the total amount spent on public elementary and secondary
education was $313 billion. Of these total revenues, 6.6% came from the federal
government, 48% from the state and 45.4% from the local governmental level (Home
School Legal Defense Association, 2002a).
The importance of the education funding issue is further highlighted by the
inequity of funding that occurs between school systems at the state level. For instance, in
North Carolina the urban Chapel Hill-Carrboro School System invested $3,684.00 of
local funds per student, while rural Hoke County School System invest approximately
$600.00 (Armstrong, 2003).
Teacher salaries are another issue being discussed today in education. Average
teacher salaries have increased from $27,496 in 1960 to $39,385 in 1998, a 43% increase.
The average teacher’s work year lasts 180 days, three quarters of the 240-day year
worked by typical Americans with full-time jobs. Interestingly enough, compensated at
the same rate for a forty-eight week year, the average public school teacher would have
earned $52,513 in 1998 (Home School Legal Defense Association, 2002a).
Compounding this issue is the treatment of educators. Educators are knowledge
workers with very little choice. Educators are to deal with century-old paradigms for
financing education, which demands accountability without extending spending authority
(North Central Regional Educational Laboratory, 2002b). Former North Carolina
Governor Jim Hunt, Chairman of the National Commission on Teaching & America’s
Future stated in an interview with the American Family Association, “Working
conditions are driving teachers from the classrooms. They do not have time for
professional development. Many of them are treated like hired help – they have to keep
the lunchroom and maybe some of them have to be in charge of the bathrooms. They do
not have phones, offices or clerical help – we are not treating these teachers like
professionals.” By the end of the fifth year, over half of teachers have left the profession
(Brown, 2003, p. 1).
The teacher issues have been further complicated by international student test
score comparisons. In a 1999 follow-up to the 1995 Third International Mathematics and
Science Study, the ranking of United States eighth graders fell to 19th in mathematics and
18th in science out of 38 nations. Between 1990 and 2000 the average SAT scores increased 19 points; however, between 1960 and 2000 the SAT scores decreased by 56
points. In 1998, 38% of fourth graders, 26% of eighth graders and 23% of twelfth
graders scored below basic levels in reading (Note: They lacked even partial mastery of
the knowledge and skills appropriate for their grade level). Since 1993, more than 10
million Americans have reached the 12th grade without having learned to read at a basic level. More than 20 million have reached their senior year unable to do basic math and
almost 25 million have reached the 12th grade without knowing the essentials of United States history (Home School Legal Defense Association, 2002a).
Concerns regarding student test performance have implications for the future job
market as well. The United States Department of Education (2003) predicts that over the
next decade over 70% of the jobs will require a postsecondary education (less than a
Baccalaureate Degree) and 20% of the jobs will require a Bachelor’s Degree. However,
fewer than one of every three students that go to college earn a degree within 10 years
after graduation. Nearly half of the postsecondary students require remedial course work
during their first year of college, costing approximately one billion dollars. Over 20% of
four-year college students and over 40% of two-year college students drop out of school
in their first year (Home School Legal Defense Association, 2002a).
A 2000 public opinion poll entitled, “Reality Check” found that 33% of college
and university professors and 39% of employers believe that a high school diploma
should mean that a student has learned the basics. However, in a separate study, 66% of
parents, 74% of teachers and 77% of students believe that a high school diploma equals
mastery of the basics (Home School Legal Defense Association, 2002a). The importance
of these perceptions and expectations are further drawn out by the investment that
American companies make each year in training and remediation for their employees. In
2000, 2.5% of annual payroll is spent on training expenditures. This total investment is
in the millions of dollars annually. (Association for Training and Development, 2003)
The uncertainties surrounding public schools, have led to the creation and growth
of several educational reform movements. Those movements include charter schools,
vouchers, home schooling and testing/accountability. The first charter school legislation
was passed in 1991 in Minnesota. Since that time, 32 other states and the District of
Columbia have passed similar legislation (Hirsch, 1998). The charter sponsor may be a
school district, college or university, state education agency, teachers, parents or other
community members (Collins, 1998). While proponents of the charter concept argue for
the competition that it brings to education and the focus on creativity and innovation, the
opponents argue that charter schools drain public funds away from existing public
schools and run the risk of becoming elitist facilities (Vittiello, 1999).
School vouchers present another current trend in education. A 1999 Public
Agenda survey of members of the general public found that 66% of parents and 60% of
parents with children knew very little or nothing about school vouchers and how they
work. After parents were provided with definition of vouchers, their support increased
dramatically with 70% of parents indicated that they would definitely use or seriously
consider using vouchers (Zehr, 1999).
Another alternative to the public school system that has developed momentum
over the past decade is home schooling. Home schooling in the United States has been
growing at a rate of nearly 15% per year for the past 10 years. In 2001, there were 1.7
million home school students (Home School Legal Defense Association, 2002a). For
many the home school movement is a return to the historical individual rights of the
nation so that they may form more meaningful bonds with family and community. Key
reasons for home schooling are the transmission of distinct set of values to children,
family relationships, positive peer interaction, quality academics and safety. Home
school students scored in the 79th percentile in reading, the 73rd percentile in language and the 73rd percentile in math. This compares to the national average of the 50th
percentile. (National Home Education Research Institute, 2002a). A cost benefit analysis
reveals that an average of $546 is spent per home school student per year versus $5,325
per public school student (Home School Legal Defense Association, 2002a).
Accountability is another major influence that is on the forefront of the education
environment today. This influence was initially started at the federal level through the
1983 release of “A Nation At Risk” which outlined many of the shortcomings of
America’s schools. In the mid to late 1980’s, many states adopted educational reformed
aimed at addressing the concerns outlined in this report. In 1990, President George Bush
called a National Education Summit of the nation’s Governors to address this issue.
Broad goals addressing literacy, math competency, safe schools, certified teachers, etc.
were outlined. This served as another push for greater accountability and thereby results
from the nation’s schools (National Education Goals Panel, 2001). This effort was
further emphasized by the fact that today over 191 million adults in America are at the
lowest literacy level, meaning that they are able to perform only the simplest writing and
reading tasks (National Institute for Literacy, 2000).
This effort was boosted further in 2002 with the passage of the “No Child Left
Behind” (NCLB) legislation of the President George W. Bush administration. This
legislation calls for strong testing and accountability at every grade level in the areas of
reading, writing and math. This legislation was created as a response to national
educational concerns related to the federal investment in education and results that were
occurring. In 1965 the Elementary and Secondary Education Act first passed Congress.
Since that time over $321 billion has been spent by the federal government. However,
now 40 years later only 32% of fourth graders can read at grade level. Meanwhile,
according to the NCLB web site, twelfth grade science scores have declined and 60% of
twelfth graders cannot read proficiently. Another factor that is addressed through the
legislation is the high number of minority students that are falling even further behind the
national averages. This legislation also aims to address the issue of teacher quality.
Today, only 41% of eighth grader math teachers majored in math. Twenty percent of all
public education students in grades seven through 12 were taught English by a teacher
who did not major or minor in English or a communications-related field. Over four
million students in physics, chemistry and history are taught by teachers lacking
preparation in their teaching subject area (United States Department of Education, 2003).
The NCLB legislation is based on four principles as follows: (1) Accountability –
guaranteeing results; (2) Flexibility – local control for local challenges; (3)
Research-Based Reforms – proven methods with proven results; (4) Parental Options – choices for
parents, hope for kids (United States Department of Education, 2003).
In recent years a push for standardization in public education has been driven by
the public’s desire to see that every student receives at least a basic education. The
public has also exhibited a low tolerance for experimenting with outcomes when
students’ live are at stake (North Central Regional Educational Laboratory, 2002c).
The North Central Regional Educational Laboratory (North Central Regional
Educational Laboratory, 2002d) conducted an emerging educational issues scan in 2002.
This environmental scan surfaced three broad issues as follows: (1) Quality, Technology,
and Equality – education’s ability to deliver high quality education through the use of the
latest technology that is equitable; (2) Impacts of Choice on Education – the student and
parents opportunity to choose the educational path that they will take by providing them
with flexibility and the financial resources to make their choice a reality; (3) Relation of
Education to Social Change – education can have a significant role in addressing ills of
society and society can have a great influence on the educational system (North Central
Regional Educational Laboratory, 2002a). This national trend scan is further supported
by Hugh McColl, CEO, Bank of America, who said, “We must spend more money in
educating our population, both the very young and adult, if we want to have economic
prosperity; it’s the winning formula: Start early and don’t stop.” (Shaping Our Common
Future, Emerging Issues Forum, 2000, p. 9).
The national debate regarding schools was summarized well by Comer when he
stated, “Given the purpose of education – to prepare students to become successful
workers, family members, and citizens in a democratic society – even many good
traditional schools, as measured by high test scores, are not doing their job adequately.
But test scores alone are too narrow. A good education should help students to solve
problems encountered at work and in personal relationships, to take on responsibility of
caring for themselves and their families, to get along will in a variety of life settings, and
to be motivated, contributing member of a democratic society.” (North Central Regional
Educational Laboratory, 2002c, p. 2)
2.2 Trends in Agriculture
From my vantage point, agriculture stands poised for the 21st century and we
remain committed to ensuring the future of this vital industry. (Jim Graham, Former
North Carolina Commissioner of Agriculture and Consumer Services, 2000)
In 1930, one farmer supplied enough food and fiber for 9.8 people in the United
States and abroad (United States Department of Agriculture, 2003). By the 1960’s, that
number had grown to 25.8 people in the United States and abroad. By the last 1990’s,
one farmer supplied enough food and fiber for 129 people in the United States and abroad
(Agriculture Council of America, 2003).
In 1930, it took 15 to 20 labor hours to produce 100 bushels of corn. By the
1950’s the number of labor hours had gone down to six to 12 hours. The number of labor
hours required to produce a bushel of corn by 2000 had gone down to 2 ¾ hours (United
States Department of Agriculture, 2003).
In 1900 the average farm size was 147 acres (Agriculture Council of America,
2003). In the 1950, the average farm size was 216 acres. By 1990, farm size had
increased to 461 acres. In 1950, farmers made up 12.2% of the labor force. By 2000,
approximately 2% (approximately two million people) of the United States labor force
was farmers (United States Department of Agriculture, 2003).
Farm equipment has evolved from a team of horses in the early 1900’s. Today, a
four-wheel drive tractor has the power of 40 to 300 horses. However, this is not without
costs. A farmer pays between $97,000 to over $170,000 for a tractor (Agriculture
Council of America, 2003).
Over the past 100 years, agriculture has changed dramatically. According to
former North Carolina Commissioner of Agriculture Jim Graham (2000), Department of
Agriculture and Consumer Services, one of the most important advances has been
computer technology. He indicates that the impact is felt in every area of our lives
including agriculture. Farmers have gone from using primitive, mule-driven plows of
yesteryear to the sophisticated computer-enhanced analysis tailored to their fields, which
indicates the precise amount of fertilizers and nutrient additives needed to produce
optimal results. Scientific research is continuing to develop smarter seeds that are
drought and bug resistant and that allow for maximum yield. All of this allows a farmer
to plant less acreage while at the same time obtain higher yields, making food prices
more reasonable for consumers. In many cases, the advances made on the farm delivered
a better standard of living to the rest of the world. We must ensure that farmers be
included in the prosperity of the nation as opposed to being a forgotten group of people.
Finding ways to boost the commodity prices or trim grower costs will need to be of one
the biggest priorities of the future. (Graham, 2000, p. 1-2)
Significant change occurred in agriculture throughout the 20th century. Much of
that change was driven by the technological advances that occurred between World War I
and World War II (Rasmussen, 1975). The internal combustion engine was one of the
technological advances that help to reduce the need for horses and mules and increased
efficiency led by the invention of tractors and other related farm machinery such as
balers and corn pickers (Cochrane, 1979). In addition to leaps forward made by
agriculture due to the combustion engine, the development of hybrid seed corn
revolutionized production agriculture. Early corn breeding programs were started in the
Corn Belt in the 1920’s which eventually led to the interchange of breeding materials
between different parts of the country. Groups such as the Southern Corn Improvement
Conference helped to advance the corn breeding programs. Evidence of the reception
that hybrid seed corn had in the southern United States was demonstrated by the dramatic
increase in the use of hybrid seed corn between 1941 and 1946. In 1941, there was
1,029,000 acres of hybrid corn grown in the southern United States. Five years later, in
1946, 5,469,000 acres of hybrid corn were grown. This brought about a major advance in
the productivity of corn as was simultaneously being experimented with other crops
(Rasmussen, 1975).
There are powerful forces are propelling agriculture toward a new dimension in
the 21st century. Oltmans (2000), suggested that there are five major drivers of change in
the future for agriculture, including: (1) science and technology; (2) expanding global
markets; (3) shifting population; (4) social and political activism; (5) structural change.
First, in the area of science and technology, Oltmans projects that biotechnology
and information management are forever changing the models we use for doing business
and communicating. The science and technology area is producing a new model of doing
business and reducing the barriers, socially, culturally and geographically, that have
traditionally existed (Oltmans, 2000).
Second, expanding global markets are causing the agricultural economy in the
United States to become less isolated and more volatile and therefore subject the global
forces. We will become unemployed if we do not think globally (Oltmans, 2000).
Third, shifting population in rural areas is being driven by the locating of
agribusinesses to areas that have high quality access to education, transportation, health
services, water, etc. This dynamic is creating rural “satellite cities” of 10,000 in
population or more that results in rural islands of prosperity and agricultural growth while
leaving behind more isolated rural areas. In the future, some rural areas will go
un-served and this will be a downside of the changes in agriculture (Oltmans, 2000).
Fourth, social and political activism has great effect on the agricultural economy.
Rural populations are becoming increasingly dominated by people who do not know,
understand, or care about the agriculture’s concerns and needs, which will shake up
traditional agricultural politics and practices. Society’s concern has shifted more toward
social, environmental and political issues that impact agriculture. Working with these
players and incorporating them into the debate will be a tough challenge for agriculture in
the future (Oltmans, 2000).
Finally, structural change will continue to have impact on the agricultural
industry. The two primary modes of farming in the future will be small, part-time farms
and large industrialized farms. This change is focusing most production agriculture on
food products rather than food commodities. Food products are defined as value-added
or crops grown specifically for medicinal purposes. This is leading to more
interdependence in agriculture and less independence (Oltmans, 2000).
More than one in six jobs in the United States stem from agriculture. The impact
of this influences the recognition of some states as being agriculturally dependent. This
is primarily based on the comparison of a state’s total workforce and the relative
importance of selected groups of workers on a state’s food and fiber system. California,
for instance, has the largest number of workers who owe their jobs to agriculture, 2.7
million. However, California is not considered agriculturally dependent since that
statistic represents only 16.9% of the state’s workforce. Agriculture’s national share of
the agricultural workforce is 17.8%. In contrast, the Dakotas are agriculturally dependent
since over 25% of the total workforce in both states is involved in agriculture. However,
the Dakotas represent less than one percent of the nation’s total agricultural workforce.
These statistics have significant impact in the political arena. As federal and state
legislators set policy for their state and nation, a smaller number of agriculturally
dependent states result in agriculture having less influence (Edmondson, et. al., 1986).
During the 1981-1997 period, some shifts in the agricultural workforce were
revealed. For instance, in 1981, North Carolina ranked eighth in the nation in the number
of people involved in agriculture. In 1997, North Carolina still ranked eight, but had
grown by 15% from 789,500 workers to 907,000 workers. This type of shift has an
impact on not only the agricultural sector, but also on the economical and educational
system (Edmondson, et. al., 1986).
In 1986, the United States food and fiber system employment sector represented
17.8% of the total workforce. The growth in this sector was occurring primarily in the
consumer end of the delivery chain. These jobs tended to be in transportation, wholesale
and retail trade and food service. The impact of the influence that the agricultural
workforce has on the economy of states is significant. It can be said that in those
agriculturally dependent states, as agriculture goes, so goes the state’s economy
(Edmondson, et. al., 1986).
A high percentage of the agricultural workforce is not on the farm. Since 1935,
the total number of farmers has declined from 6.5 million to less than two million.
Factors that have led to this change have included uncertainty in the agricultural
economy, farm programs that helped large farmers and hurt small farmers based on the
production level they could reach and the rush to adopt to modern technology (Cochrane,
2002). Interestingly enough, the 1971 Yearbook of Agriculture predicted that by 2000
there would be less than two million farmers (United States Department of Agriculture,
1971).
The creation of an oligopoly in agriculture has produced a situation in which there
are fewer buyers and suppliers. This oligopolistic structure has resulted in an
environment where a few large firms control non-farm produced inputs (herbicides, farm
machinery, etc.), few buyer exists for the farmers’ products and at the retail level a few
grocery chains are responsible for 40% of the all retail food sales (United States
Department of Agriculture, 2002).
Globalization is also having a dramatic impact on the agricultural economy.
Globalization is driving agriculture toward large production corporate agricultural
operations. This has been great for the consumer as the retail cost for the consumer’s
market basket at the grocery store remained constant from 1984 to 1999 (Christison,
2002). Since 1984, the real price of a market basket of food has increased by three
percent while the farm value of that food has fallen by 38%. To further point this out, the
real farm to retail spread for a gallon of milk has increased by 14.3% while the prices
received by dairy farmers have dropped dramatically, nearly 50%. A bushel of corn sold
for less than four dollars per bushel while a bushel of corn flakes sold for $133.00 in
1998. In 1998, cereal companies were 186 to 740 times more profitable than farms. In
1999, farmers received twenty-one cents on one dollar brought in at the retail level. Ten
years earlier, farmers were receiving thirty-two cents on one dollar for every retail sale
(United States Department of Agriculture, 2002).
Another factor that is having a dramatic impact on agriculture is concentration.
Fifty-eight percent of the beef industry in the United States is controlled by two
companies, IBP and Cargill. Four companies, DuPont/Pioneer, Monsanto, Syngenta and
Dow, control 69% of the North American seed corn market and 47% of the soybean seed
market. In 1998, Monsanto controlled 87% of the United States cottonseed market and
sold 88% of the genetically engineered seeds in the United States. The move to corporate
hog farms has led to a 70% decrease in the number of independent swine producers in the
past 15 years (United States Department of Agriculture, 2002).
The United States agricultural industry is going through significant structural
changes in product characteristic, worldwide production and consumption, technology,
size of operation and geographic location. These changes are occurring for three primary
reasons: (1) capturing efficiencies and controlling costs; (2) reducing risks;
(3) responding to consumer demands. From 1990 to 1999, 725 acquisitions, mergers,
strategic alliances and/or partnerships took place in agriculture (American Farm Bureau
Federation, 1999).
The current trends in agriculture are having a negative impact on farm income.
The long-term look for individuals involved in agricultural production is bleak when one
looks at the equity returns. The annual return to farmers is 2.38% compared to retail food
returns of 18% compared to food manufacturers at 17.2% and banks at 10.8%.
Agricultural trade policy has had a significant impact since the 1996 Farm Bill which was
suppose to move American agriculture to a free-market scenario. Between 1996 and
1998, United States corn prices fell by 56% and wheat prices fell by 46% (United States
Department of Agriculture, 2002a).
The efficiency of farmers in the United States benefits consumer in this country.
United States consumers spend approximately 10% of their income on food compared
with 11% in the United Kingdom and 17% in Japan. This has been the result of
tremendous leaps forward in technology over the course of the 1900’s (ACA, 2003). In
1965, Americans spent 19% of their average take-home pay on food and in 1950 they
spent 26% on food. (United States Department of Agriculture, 1965, p. v)
The American diet has shifted over the past 25 years. In 1996, Americans
consumed an average of 77 pounds more of commercially grown vegetables, 63 pounds
more grain products, 54 pounds more fruits, 32 pounds more poultry, 20.5 pounds less
red meat, 73 fewer eggs and seventeen gallons less whole milk than they did in 1970.
These shifts are the result of consumer preferences, dietary concerns, disposable income
increases, food assistance for the poor, and new value-added products (United States
Department of Agriculture, 2002).
Retail cuts of meat are 15% leaner today than 20 years ago. For example, a pork
tenderloin has only one more gram of fat than a skinless chicken breast. Twenty-seven
percent less beef fat is reaching the retail meat case than in 1985 (Agriculture Council of
America, 2003).
However, the American dietary situation is not reflective of the world. Globally,
over 800 million people are chronically malnourished (Council for Biotechnology
Information, 2003). Although the average food intake and standard of living have
improved substantially around the world, the undernourished has double in Africa.
Agricultural productivity has seen revolutionary progress, poverty alleviation, especially
in poor and rural areas, has been disappointing. It has become progressively clear that
hunger results not so much from insufficient food supplies, as from people’s lack of
access to those supplies (United States Department of Agriculture, 2002a).
Today’s biotechnology is having a dramatic impact on the future of the world.
Two key areas are making more food available to meet dietary needs and by making
better foods that are high in vitamins. The implications are for this can be seen in how
food manufacturers in the United States addressed rickets in the 1930’s by adding
vitamin D to bread to milk. This addition in the 1930’s virtually wiped out rickets.
Another example of the implications that biotechnology has surfaces in the area of
productivity. In 2001, the United States produced an additional four billion pounds of
food and fiber. This creates not only more food, but also more farm income (Council for
Biotechnology, 2003).
Advances in technology and in particular biotechnology help to save over one
billion tons of soil per year. These changes in farm management practices have made
significant leaps throughout the 20th century. This is a positive for farming and for the
environment (Council for Biotechnology, 2003).
World population is expected to top eight billion people by 2030. This will mean
that there are an additional two billion mouths to feed, most in developing nations. The
United Nations predicts that by 2050, approximately 4.2 billion people may not have
their daily basic needs met. This will require farmers to double their production on the
current farmland of the world over the next 25 years or an additional four billion acres
will be needed if farm production on current farmland does not increase (Council for
Biotechnology, 2003).
These dramatic projections regarding the future of world food production needs is
contrasted by consumer demands for food in the United States over the past decade.
United States consumers are demanding more high quality food products. Foods like
prime steak and fine wines are in high demand; a shift from the earlier part of the 20th century. Dining once was about filling one’s stomach. Today, it is an entertainment
experience. This has also been reflected in the development on new niches for farmers
and ranchers. Today many farmers and ranchers are receiving income from hunting
rights, working vacation opportunities and other outdoor land experiences that they can
offer to consumers. This trend is expected to grow in popularity among the 98% of the
population that is not attached to the land (Catlett, 2003).
2.3 Chapter Summary
Education and agriculture are in a turbulent and challenging time. It is difficult,
based on the issues addressed in this chapter to think of a time when these two sectors
would be faced with any more controversy and instability. The issues that separate urban
and rural areas cut heavily along the lines of education and agriculture.
Education is facing major changes. Heavy emphasis on educational reform
initiatives like vouchers, charter schools, home schooling, school funding, accountability,
testing, and teacher quality are re-shaping the educational landscape. The disparities
between rural and urban schools are reaching crisis proportions and the pressure to recruit
and retain high quality teachers has reaching critical point. These factors are substantial
and integral to the future of the economy in rural and urban areas.
Agriculture is facing major changes. Not only will what farmers grow be
different, but also the global impact of how they grow and market their crops and
livestock will be significant. Clearly, astute business skills, global understanding and
flexibility will be keys to the future of those involved in the agricultural industry.
At the intersection between these two sectors, the agricultural education program
finds itself at a critical decision point as to the types of initiatives it should develop in
order to thrive in the future. The knowledge gained through this study could be
beneficial in that decision-making process.
CHAPTER 3 Methodology
The purpose of the study was to identify the emerging educational and
agricultural trends to enable state and national agricultural education leaders to make
appropriate decisions regarding the future of the agricultural education program. This
chapter describes the methodology to implement this study. The research design,
population, instrumentation, data collection procedures, and analyses are described and
documented.
3.1 Research Design
The type of research used in the study was survey research using the Delphi
technique (Sackman, 1975). The Delphi survey technique was developed in the 1950’s
by two research scientists working at the Rand Corporation, Olaf Helmer and Norman
Dalkey. They developed the procedure as a tool for forecasting future events using a
series of intensive questionnaires interspersed with controlled-opinion feedback
(McCampbell & Hemler, 1993). Participants were solicited experts in the issues related
to national defense in regards to the tensions between the United States and Russian
governments.
For this study two panels of national experts, one in education and one in
agriculture, were used. The study sought to determine the national trends in these two
sectors. This design enabled the researcher to develop consensus on a number of issues
without face-to-face confrontation (Helmer, 1966). Delphi operates on the principle that
several heads are better than one in making subjective conjectures about the future…and
that experts will make conjectures based upon rational judgment rather then merely
guessing.” (Weaver, 1971). An obvious, but true reminder, comes from Ludwig (1997)
who indicated that the forecasting done by a panel of experts is only as good as the
opinions that go into it.
3.2 Panel Selection
The population was comprised of two panels of experts. When an expert panel
has at least fifteen members and is truly representative of the expert community, the
Delphi method is reliable (Dalkey, Rourke, et. al., 1972). Dalkey, Rourke, Lewis and
Snyder (1972) indicated that a group size of 13 was needed for reliability with a
correlation coefficient of .9. Therefore, she recommended a group size of twelve to
fifteen. Sutphin suggested that the sample should be large enough to obtain the amount
of expertise necessary to effectively conduct the study. Beyond this number, the sample
size should be held to a minimum to reduce cost and an over abundance of data which
becomes cumbersome and yields not additional information for the study. He
recommended, “Fifty experts from each group were sufficient.” (Sutphin, 1981, p. 52)
The agricultural panel was comprised of a cross-section of the agricultural
community including commodity leaders, farmers, agribusiness representatives,
policy-makers, educators, students and extension personnel. The educational panel was
comprised of a cross-section of the educational community including teachers, school
administrators, school board members, policy-makers, educational organization leaders,
students, and parents.
The panel was identified through a national nomination process (Appendix H).
Over 1,160 state supervisors, university educators, teachers and national staff in
agricultural education were contacted via email and asked to nominate up to five experts
each in agriculture and in education (Appendix A). Two requests for nominees were
conducted with a total of 72 education experts and 70 agricultural experts being
nominated (Appendix I). These experts represented the diversity of education and
agriculture and the geography of the United States.
Narrowing these nominees to a manageable group of experts was the next
challenge. Each nominee had a brief biographical sketch. These nominees were
reviewed by the members of the researcher’s graduate committee. Based on the needs of
the study and nomination information, a group of 50 education leaders and 50 agricultural
leaders were selected. The educators were from 26 states and all major geographic
regions of the nation. The agriculturists were from 20 states and all major geographic
regions of the nation. The nominees were purposefully selected to insure that a wide
range of educational and agricultural backgrounds were represented on the expert panel.
Table 1
Expert Panel Selection and Participation
Criteria Agriculture Education
Number nominated 70 72
Number asked to participate 50 50
Number who responded to Round One 25 32
Number who responded to Round Two 20 22
Number who responded to Round Three 15 15
3.3 Instrumentation
In a Delphi study multiple questionnaires are used (Ludwig, 1997). The
development and the administration of the questionnaires were interconnected. Three