Copyright2000 by the Genetics Society of America
Detecting Bottlenecks and Selective Sweeps From DNA Sequence Polymorphism
Nicolas Galtier, Frantz Depaulis and Nicholas H. Barton
Institute of Cell, Animal and Population Biology, University of Edinburgh, Edinburgh EH9 3JT, United Kingdom Manuscript received July 24, 1999
Accepted for publication February 29, 2000
ABSTRACT
A coalescence-based maximum-likelihood method is presented that aims to (i) detect diversity-reducing events in the recent history of a population and (ii) distinguish between demographic (e.g., bottlenecks) and selective causes (selective sweep) of a recent reduction of genetic variability. The former goal is achieved by taking account of the distortion in the shape of gene genealogies generated by diversity-reducing events: gene trees tend to be more star-like than under the standard coalescent. The latter issue is addressed by comparing patterns between loci: demographic events apply to the whole genome whereas selective events affect distinct regions of the genome to a varying extent. The maximum-likelihood approach allows one to estimate the time and strength of diversity-reducing events and to choose among competing hypotheses. An application to sequence data from an African population of Drosophila melanogaster shows that the bottleneck hypothesis is unlikely and that one or several selective sweeps probably occurred in the recent history of this population.
L
OW genetic variability in natural populations is not different patterns in distinct species or distinct loci just by chance. Additionally, some variance between observ-a robserv-are feobserv-ature: numerous exobserv-amples hobserv-ave beenre-ported in animals (e.g.,O’BrienandEvermann1988), able patterns of polymorphism in distinct species is in-troduced by random sampling of individuals. Assessing plants (Liuet al. 1998), and protists (Richet al. 1998),
among others. Low present-day levels of variation may the statistical significance of an “apparent” discrepancy between data sets is therefore essential.
reflect a persistent state maintained by, say,
nonpanmic-tic mating systems (Charlesworth and Charles- Given that genetic variability has been reduced re-cently, the question of distinguishing between
demo-worth 1995) or recurrent background selection
(Charlesworth et al. 1995) at linked loci. In many graphic and selective causes is a major one: the two kinds
of events have different biological meanings. Detecting cases, however, a recent event in the history of the
popu-lation is invoked to explain reduced variability. bottlenecks is relevant to conservation biology since the global reduction of genetic variability they induce may Such diversity-reducing events essentially fall into two
categories: demographic factors and selective factors. endanger populations. Detecting selective sweeps, on the other hand, is an important goal for the study of Demographic factors include bottlenecks and
popula-tion founder events; both involve a temporary reducpopula-tion evolutionary mechanisms. In particular, a long-standing controversy persists about the relative importance of of population size resulting in an increased rate of
ge-positive selection vs. neutral or nearly neutral evolution netic drift. Rapid fixation of a new, favorable allele
at the genomic level (e.g.,Gillespie1991). through directional selection (a “selective sweep”) also
The theory of coalescence (Kingman1982;Hudson
generates a sudden drop of genetic variability at linked
1991) provides a promising framework to address these loci by hitchhiking (Maynard-SmithandHaigh1974).
questions. Variability-reducing events can be detected In this article, we address two questions: first, how recent
because they modify the shape of the genealogy of al-diversity-reducing events can be detected, and second,
leles. Basically, they tend to generate star-like (parts of) how demographic and selective causes can be
distin-genealogies, as a consequence of a sudden increase of guished.
coalescence rate (Figure 1). Demographic events apply The issue of detecting diversity-reducing events is not
to the whole genome whereas selective events affect trivial. Usually, a bottleneck (or a selective sweep) is
different regions of the genome to various extents invoked when the variability at some locus of some
spe-thanks to recombination (e.g.,Hudsonet al. 1987). This cies is much lower than that usually observed in related
gives the possibility of distinguishing the two hypotheses species (or at distinct loci). However, mutation and drift
by sampling several loci: a more or less common pattern processes have a high variance and may generate highly
is expected in the case of a bottleneck, while selective sweeps generate heterogeneity across loci.
Griffiths andTavare (1994a) devised an efficient
Corresponding author: N. Galtier, UPR 9060 “Ge´nome, Populations,
method to compute likelihoods under the coalescent
Interactions”-CC063, Universite´ Montpellier 2, Place E. Bataillon,
34095 Montpellier, France. E-mail: [email protected] model, which can be easily generalized to the case of
Pr(D0)⫽兺
D1
Pr(D0|D1) · Pr(D1)
⫽兺
D1兺D2
Pr(D0|D1) · Pr(D1|D2) · Pr(D2)
⫽兺
D1兺D2
. . .兺
Dm
Pr(D0|D1) · Pr(D1|D2) . . . Pr(Dm⫺1|Dm) · Pr(Dm), (3)
where m is the total number of events before reaching the common ancestor Dmof genes in the sample, and where Pr(Dm)
is one. Transition probabilities Pr(Di|Di⫹1) in (3) are given by
adjusting n in (2) to the size of Di. Pr(D0) is the likelihood of parameter. It is expressed as a sum over all possible sets
Figure1.—Effect of bottlenecks on genealogies. (A)
Stan-of ancestral states (D1, D2, . . . , Dm), that is, the topology of
dard genealogy under the neutral, constant-population size the genealogy and the order of events.
coalescent. (B1) A short, moderate bottleneck occurs at time For large data sets, one cannot compute (3) exactly: there
T (gray zone). Looking forward, all the individuals in the are too many sets of ancestral states. Griffiths and Tavare´’s sample descend from three of the lineages that entered the idea was to randomly sample a reasonable number of sets of bottleneck: today’s sample includes three “gene families.” ancestral states and to estimate the likelihood from this sam-Looking backward, three lineages survived the burst of coales- ple. Let A be a set of ancestral states (D
1, D2, . . . , Dm), and
cences generated by the bottleneck. (B2) Strong bottleneck. let H be the hypothesis of the coalescent model (including Only one lineage survived it. parameter value). Equation 3 can be rewritten
Pr(D0|H)⫽
兺
A
Pr(D0& A|H) variable population size (Griffiths and Tavare
1994b). In this article, we implement a model of sudden ⫽
兺
A
Pr(D0& A|H) · Pr(A|D0, X) Pr(A|D0, X) reduction of genetic variability into Griffiths and
Tavare´’s scheme and devise likelihood-ratio tests to
de-⫽EX
冢
Pr(D0& A|H) Pr(A|D0, X)
冣
, (4)
tect and discriminate between bottlenecks and selective sweeps. The new method is applied to polymorphism
where EX means expectation with respect to X. Here, X is
sequence data from an African population of Drosophila
any sampling distribution of ancestral states of the data D0.
melanogaster. Equation 4 provides a method for estimating the likelihood
in reasonable time: (i) sample one set A of ancestral states according to distribution X; (ii) calculate the expression in METHODS the expectation in (4) using the recursion (3) with that partic-ular A (numerator) and the probability of A under X (denomi-In this section, we first recall the main ideas ofGriffiths nator); and (iii) iterate (i) and (ii) several times and take the
and Tavare’s (1994a,b, 1995) approach, then show how it average.
can be used to model a bottleneck at one locus, and finally Obviously, an efficient sampling process X is one that sam-address the issue of hypothesis testing with multiple loci. ples probable ancestral states (according to H) with high
prob-Griffiths and Tavare´’s method:Consider a data set D0con- ability, i.e., one as close as possible to the unknown “H given sisting of DNA sequences (genes) sampled at one locus in n D
0” (the distribution of ancestral states under the coalescent individuals of a panmictic population of effective size 2N. conditional on D
0). For instance, a uniform sampling of sets Assume that neutral mutations occur at rate. Assume that of ancestral states is inefficient since most sets of ancestors no recombination occurs within the locus. A fundamental have a very low probability, but a few of them have a high
recursion is probability. Sampling uniformly, one would have to perform
many replicates of X to get an accurate estimate of the likeli-Pr(D0)⫽
兺
D1
Pr(D0|D1) · Pr(D1). (1)
hood. Griffiths and Tavare’s importance sampling scheme X is a Markov chain: (i) start from D0; (ii) for all possible D1, Here, D1is any state of the data one “step” before D0, i.e., any compute Pr(D
0|D1, H) according to (2); (iii) randomly sample sample at a previous time that may be transformed into D0by D
1with probability proportional to Pr(D0|D1, H), either a mutation or a separation of lineages. The transition
probabilities are (GriffithsandTavare1994a,b)
Pr(D1|D0, X)⫽
Pr(D0|D1, H)
兺
D1
Pr(D0|D1, H)
; (5)
Pr(D0|D1)⫽kc·
n⫺1 ⫹n⫺1
and (iv) iterate until Dm.
if the backward event is a coalescence This algorithm is presumably optimal if “Bayesian” probabil-ities Pr(Di⫹1|Di, X) equal the unknown Pr(Di⫹1|Di, H): in this
case, X becomes identical to H given D0. This requirement is Pr(D0|D1)⫽km·
⫹n⫺1 met if, for any given state Di, all the possible ancestral states Di⫹1are equally probable under H.
if the backward event is a mutation, (2)
The above equations hold whatever the assumed mutation model. In this article, we used the infinite-site model: it is whereis the population mutation rate 4N. Coefficients kc
assumed that no more than one mutation arises at any one and kmdepend on how many distinct forward events can lead
site in the genealogy. A consequence is that no more than from D1to D0and on the mutation model (see below). The
two distinct states should be observed at any site. Under this number of genes in D1is n if the event is a mutation and n⫺
segregat-ing sites in the data set), and coefficients in (2) are kc⫽nc/ to the problem of distinguishing selective sweeps from bottle-necks. We approximate the expected effect of a selective sweep (n⫺1) and km⫽nm/n, where ncis the number of genes in
D1leading to D0by splitting (in the case of a coalescent event), at one neutral locus linked to the locus under selection by that of a population bottleneck: T is the time of fixation of and nmis the number of genes in D1leading to D0by mutating
(in the case of a mutation event). the favorable mutation, and S depends on the ratio between the selection coefficient associated with this mutation and the
A bottleneck model:The above scheme can be used with
models more complex than the standard coalescent (e.g., recombination rate between the selected locus and the neutral locus. The discrepancy between the two hypotheses appears
Nielsen1998).GriffithsandTavare(1994b) showed how
it can be generalized to account for variable population size. when several loci are considered: under the bottleneck model, all loci share a common T and S, while distinct loci have In this case, the relative probabilities of coalescence and
muta-tion given in (2) depend on the time of the current state. distinct T ’s and S ’s under the selective sweep hypothesis. In both cases, a specific mutation rateis assigned to each locus. This means that one has to keep track of the times of successive
events when sampling ancestral states backward through the Three nested models are therefore to be compared. Suppose that p loci are examined:
genealogy.
The bottleneck model we used has three parameters:
popu-M1(no founder event), p parameters:1,2, . . . ,p
lation mutation rate, time T of occurrence of the bottleneck,
M2(bottleneck), p⫹2 parameters:1,2, . . . ,p, S, T
and “strength” S of the bottleneck; all are scaled relative to a
M3(selective sweep), 3p parameters:1, S1, T1,2, S2, timescale set by 2N, which is the current number of genes.
T2, . . . ,p, Sp, Tp.
Looking backward in time, it is assumed that the population
undergoes a drop of effective size at T (measured in units of The likelihood for a data set of several independent loci is 2N generations) during a short period of time and then re- the product of the likelihoods for individual loci. Likelihood-covers its initial size. If the duration of the bottleneck is short ratio tests can be performed to detect a diversity-reducing enough that one can neglect the occurrence of mutations event (M
2 vs. M1 and M3vs. M1) and to distinguish sweeps during that period, the effect of the bottleneck depends only from bottlenecks (M
3vs. M2): twice the logarithm of the ratio on the amount of coalescence it generates. Parameter S mea- of likelihoods of two competing models asymptotically follows sures this coalescence pressure: it is the time that would be a2distribution with k d.f., where k is the difference between required for an equal expected amount of coalescence if the the numbers of parameters of the two models.
population size had not changed. Under these assumptions, the bottleneck model can be implemented under Griffiths and Tavare’s scheme by keeping N constant, but changing
SIMULATIONS the time scale during the bottleneck. The new Markov chain
X⬘has three distinct phases: (i) starting from t ⫽0, recurse The reliability and efficiency of our method for de-until t reaches T allowing coalescences and mutations, as in
tecting bottlenecks were assessed using simulated data X; (ii) while T⬍ t⬍ T⫹S, recurse allowing coalescences
sets, although an exhaustive power analysis was impossi-only; and (iii) when t⬎T⫹S, switch on mutations again. In
ble because of the extensive running time. We first simu-case of a severe bottleneck (high S), phase (iii) may not be
reached for most realizations of X⬘: only one lineage survives lated 100 one-locus data sets under the null hypothesis the bottleneck (backward), as in genealogy B2 of Figure 1. of constant population size (eight genes, ⫽10). The This model reduces to the constant-size model by either setting null hypothesis was rejected in 6 cases out of 100, sug-S⫽0 or T⫽∞.
gesting that the test is reliable. Bottlenecked data sets
Maximizing the likelihood:The problem here is to find the
were simulated under two conditions: old, strong vs. values of, T, and S that maximize the likelihood for a given
data set.GriffithsandTavare(1994a) provide an efficient recent, weak bottlenecks (see Table 1). The number of method for generating likelihood surfaces with respect to. rejections of the null hypothesis (power) and the mean The basic idea is to calculate the likelihoods of many ’s and standard errors of estimates of parameters T and using a single sample of sets of ancestral states. This sample
S are shown (Table 1). The power of the test wasⵑ25%, is obtained by performing X with transition probabilities
com-and the parameter estimators were quite imprecise. The puted from one particular value ofcalled0. Theoretically,
power, however, was significantly higher than that of this procedure may be used for all the parameters of any
model. In practice, however, it does not work properly for T Tajima’s (1989) D-statistics, sometimes used to detect and S in the bottleneck model. The reason is that sets of bottlenecks. When four-locus data sets (simulated under ancestral states that have a high probability for some value
the same conditions) were analyzed, the power of the T0(S0) of the bottleneck time (strength) may have very low
test and the accuracies of parameter estimates signifi-probability for other T ’s (S ’s). Using a common sample for
cantly increased (Table 2), suggesting that standard all T ’s (S ’s) would therefore lead to variable accuracy in the
estimation of the likelihood across parameter values. There- multilocus DNA sequence data sets are large enough to fore, a single sample of sets of ancestral states was used to allow a reliable reconstruction of population history. generate a likelihood curve with respect togiven T and S, The above analyses address the M
2/M1 test, i.e., de-but different samples were used for different (T, S) pairs.
tecting bottlenecks. The power to detect selective sweeps We used a numerical technique to maximize the likelihood
is more difficult to assess since it depends much on how with respect to T and S. The problem with standard algorithms
in this particular case is that the function to be maximized is many loci depart from the null hypothesis. For example, “unstable”: because of the stochastic process, several evalua- when two-locus data sets including one “neutral” locus tions of the likelihood for a given (T, S) would return distinct plus one bottlenecked locus were analyzed, the rejection numbers. The heuristic we used is a modification of the
down-rate (M3/M1) was 24 out of 100. This power would of hill simplex (Presset al. 1992). Details can be found in the
course be increased by adding loci with their own T help file of the program, both available on request.
TABLE 1
Simulations: one-locus data sets
Actual parameters Estimations Rejection ratec
n Ta Sa * T* S* M
2/M1d De
Old, strong 8 10 0.5 1 13.80b 0.56 1.66 26/100 5/100
Bottleneck (6.64) (0.40) (0.99)
Recent, weak 8 10 0.1 0.5 11.35 0.27 0.72 23/100 14/100
Bottleneck (5.75) (0.16) (0.59)
aIn units of 2N generations.
bMean over 100 simulations, standard errors within parentheses.
cNumber of data sets for which the null was rejected (5% level) out of 100. dLikelihood-ratio test (this article).
eTajima’s D-test.
M1test is conservative: the maximum rejection rate un- termined. Orienting sites allows one to sample rooted rather than unrooted genealogies during the likelihood der the null hypothesis is 5%.
estimation (Griffiths and Tavare 1995), greatly de-creasing the running time. To orient sites, we first recon-DATA ANALYSIS
structed a neighbor-joining phylogenetic tree (Saitou
and Nei 1987; observed divergence) and located the The above method has been applied to DNA
se-quence data obtained from an African population of D. root thanks to an outgroup sequence (D. simulans). Sites were oriented according to this tree: the monophyletic melanogaster (Lamto, Ivory Coast). Three loci were used:
Fat Body Protein 2 (Fbp2, 2.15 kb, 10 individuals;Benassi character state was said to be derived. When both char-acter states defined a monophyletic group (i.e., when et al. 1999), Suppressor of Hairless [Su(H), 1 kb, 20
individ-uals; Depaulis et al. 1999], and Vacuolar H⫹ ATPase the mutation occurred in the branch connected to the root), the state shared by the outgroup was supposed 68-1 (Vha, 1 kb, 20 individuals;Depaulis1998). These
genes are located near a region polymorphic for a to be ancestral.
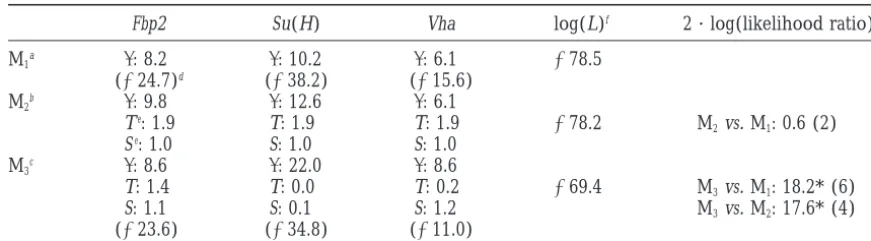
The maximum likelihood of the data under three chromosomal inversion on chromosome 2. This
proxim-ity increases the chances of detecting a selective sweep, competing models is given in Table 3, together with the parameter estimates. Likelihood-ratio tests favored the if any (seeDepauliset al. 1999). Loci were sequenced
in distinct but overlapping samples of a single popula- hypothesis of a selective sweep (M3) vs. either the no-founder-event model (M1) or the bottleneck model tion of D. melanogaster.
For each data set, sequences were truncated to fit the (M2). A demographic event seems unlikely to explain the observed pattern, as indicated by the M2 vs. M1 assumptions of infinite number of sites and no
recombi-nation: the largest segment of each locus showing no comparison. The optimal times of occurrence and strengths of variability-reducing events were quite differ-homoplasy was sought. Sites in such segments are
phylo-genetically compatible: one can find a genealogy for ent among loci (model M3): a very recent, weak sweep was detected for locus Su(H), a strong, recent one for which the mutants at any site are a monophyletic group.
Sites showing more than two distinct states were re- locus Vha, while no significant sweep was found at locus Fbp2. As a consequence, the optimal T value under moved. This data-paring strategy reduced the number
of variable sites from 64 to 19 (Fbp2), 44 to 40 [Su(H)], model M2 is high: no recent bottleneck scenario was found that fits the data better than the simple no-and 11 to 11 (Vha), respectively. Sites were oriented:
the ancestral/derived status of character states was de- founder-event model. By excluding demographic
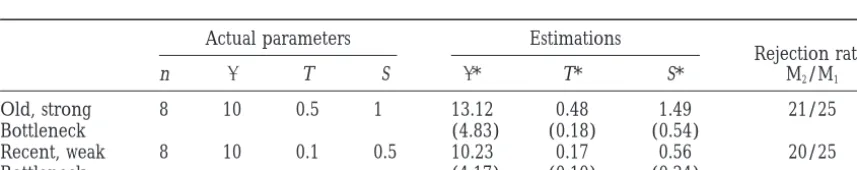
TABLE 2
Simulations: four-locus data sets
Actual parameters Estimations
Rejection rate:
n T S * T* S* M2/M1
Old, strong 8 10 0.5 1 13.12 0.48 1.49 21/25
Bottleneck (4.83) (0.18) (0.54)
Recent, weak 8 10 0.1 0.5 10.23 0.17 0.56 20/25
TABLE 3
Analysis of three nuclear loci in an African population ofD. melanogaster
Fbp2 Su(H) Vha log(L)f 2 · log(likelihood ratio)g
M1a : 8.2 : 10.2 : 6.1 ⫺78.5
(⫺24.7)d (⫺38.2) (⫺15.6)
M2b : 9.8 : 12.6 : 6.1
Te: 1.9 T: 1.9 T: 1.9 ⫺78.2 M
2vs. M1: 0.6 (2)
Se: 1.0 S: 1.0 S: 1.0
M3c : 8.6 : 22.0 : 8.6
T: 1.4 T: 0.0 T: 0.2 ⫺69.4 M3vs. M1: 18.2* (6)
S: 1.1 S: 0.1 S: 1.2 M3vs. M2: 17.6* (4)
(⫺23.6) (⫺34.8) (⫺11.0)
* Significant (5% level).
aNo diversity-reducing event model. bBottleneck model.
cSelective-sweep model.
dLogarithm of the maximum likelihood for individual loci. eMeasured in units of 2N generations.
fLogarithm of the maximum likelihood for all three loci.
gTo be compared to a2distribution (degrees of freedom within parentheses).
hypotheses, this result reinforces the hypothesis that associated with the favorable mutation has a particular status: it is older than the other lineages that emerged one or several selective sweeps may have occurred
re-cently in this region of chromosome 2 for this African thanks to recombination at various times during the sweep. Barton(1998) gives a detailed description of population of D. melanogaster (Depauliset al. 1999).
the properties of genealogies under a selective sweep. He shows that the discrepancy mentioned above results DISCUSSION in distinct expected distributions of the size of “gene families” (see Figure 1 legend) under the two hypothe-The new method presented in this article aims to
ses. These can readily be distinguished statistically from reconstruct the recent history of a population. It allows
a sample of 100 genes, with pairwise identity 0.1, pro-detection of diversity-reducing events at one or several
vided that the genealogy is known with certainty (com-loci and bottlenecks to be distinguished from selective
pare Figures 8 and 9 ofBarton1998). However, it is sweeps if more than one locus is available. The
informa-not known how far errors in estimating the genealogy tion dealt with to achieve the former goal is the
distor-from (say) infinite-sites mutation reduce the power of tion in gene genealogies generated by diversity-reducing
this method. We decided here to neglect this difference events. The latter issue—distinguishing demographic
and to approximate the effect of a sweep at one locus from selective causes—is addressed by measuring the
by that of a bottleneck. We suspect that for many data heterogeneity in time and strength of diversity-reducing
sets the major part of the information lies in the hetero-events across loci. The maximum-likelihood approach
geneity between loci, rather than in the pattern at indi-allows one to test hypotheses and to estimate the times
vidual loci. This intuition would be worth verifying for-and strengths of diversity-reducing events. It is more
mally. efficient than methods based on pairwise differences
The method we present does not make use of data (e.g., Rogers andHarpending 1992) or test statistics
from an outgroup, in contrast with, say, the Hudson,
(Tajima1989), which do not make use of all the
infor-Kreitman and Aguade´ (HKA) test (Hudsonet al. 1987). mation contained in the data. Note that this method
If it has some power in its current form—and our data applies only to panmictic populations. Population
struc-analysis suggests it actually has some—then this property ture is likely to introduce bias, especially if samples for
should be considered a strength. Using outgroup se-distinct loci belong to se-distinct demes.
quence data to estimate some neutral mutation rate Theoretically, it should be possible to distinguish
bot-involves making disputable assumptions. Any selective tlenecks from selective sweeps using a single locus. This
force having applied to some of the surveyed loci since is because what is happening during the course of the
the ingroup and the outgroup diverged may bias the event is different in both situations. Basically, a
bottle-estimation of mutation rates. Departure from the molec-neck applies identically to all the lineages that enter it.
ular clock has been observed in many genes and many In the case of a partial selective sweep (where
recombi-taxonomic groups (e.g.,Li1993). It may lead to signifi-nation occurred, so that more than one lineage escapes
are currently neutrally evolving. If the user believes he has a reliable outgroup, information about it can be incorporated into our method. First, characters can be oriented by deciding that the state observed in the out-group is the ancestral one. Second, the relative mutation rate of loci can be estimated from the ingroup/out-group divergence. This would add valuable information and reduce the number of parameters of each model by p ⫺ 1, where p is the number of loci. Incidentally,
this would significantly reduce the running time. Figure2.—Infinite-site (ISM) and infinite-allele (IAM) mu-tation models in the case of a recent bottleneck. (䊊) Actual Two assumptions of the present method deserve
dis-mutations that occurred during the genealogy, i.e., dis-mutations cussion: the infinite-site mutation model and the no
dealt with by the ISM. (䊉) “Mutations” dealt with by the IAM. recombination assumption. Both are clearly violated by
A method based on the IAM would “see” seven alleles, with some data sets. One has to worry about them before frequencies compatible with a constant population size and using the method—Griffiths and Tavare’s algorithm can a low mutation rate. In addition to allele frequencies, a method based on the ISM “sees” a high number of segregating sites, be applied only if the data are consistent with these
incompatible with a low mutation rate, and can detect the assumptions, i.e., if distinct sites support
phylogeneti-bottleneck. cally compatible bipartitions of the individuals.
The assumption of an infinite number of sites can be
avoided.Kuhneret al. (1995) compute the likelihood very recent bottlenecks cannot be detected from allele using a finite-site mutation model in the constant-popu- frequencies, consistent with the above argument and lation size case and use the Metropolis-Hastings algo- withMaruyamaandFuerst(1985).
rithm (Hastings1970) to find the value ofthat maxi- The assumption of no recombination within loci dur-mizes it. This, however, involves exploring a larger space ing the genealogy is a major one. Meeting it involves of sets of ancestral states, e.g., including genealogies reducing sequences to blocks whose sites share a unique where identical genes are not monophyletic. The Me- genealogy and therefore losing information. Further-tropolis-Hastings Monte Carlo Markov chain algorithm more, one can hardly be sure that the length of se-is an interesting alternative to Griffiths and Tavare’s quence used is actually nonrecombined, even when no method for computing likelihoods under the coalescent incompatibility between sites is found. Whether unde-(e.g., seeWilsonandBalding1998). In the case of the tected recombination events do or do not bias the bottleneck model, it may provide an efficient way to method is an open question that goes beyond the scope maximize the likelihood with respect to T and S. of this article. We doubt, however, that this issue has When its assumptions are more or less met, the infi- major practical consequences. This is because the bias, nite-site model (and DNA sequence data) is presumably if any, must be higher when data strongly depart from preferable to the infinite-allele model (and, say, micro- the model assumptions, i.e., when distinct fragments satellite data) for the purpose of detecting diversity- of the surveyed sequence have highly different actual reducing events. The latter model is one where each genealogies. But important departures are likely to be mutation creates a new allele, but where successive mu- detected by the four-gamete rule (see data analysis). tations in the same lineage “hide” each other. The infi- Undetected recombination events are more likely to nite-site model is better because, in addition to allele occur when distinct fragments have closely related gene-frequencies, the number of differences between alleles alogies, i.e., when the bias is low.
carries much information. Suppose that a moderate bot- For data sets showing a high number of recombina-tleneck occurred very recently in the history of a popula- tion events, the present method is inapplicable. Actu-tion, so that no mutations have arisen since T. The ally, such data sets hardly include any genealogical infor-expected pattern of allele frequencies is identical to mation. Rather, the data can be recoded by pooling that expected under constant population size and low, together sites of equal “size” (i.e., the number of individ-since the shape of the observable genealogy is a standard uals carrying the mutation), irrespective of which indi-one (Figure 2). Sequence data, however, would reveal viduals carry the mutation. Coalescence theory allows a large number of segregating sites (i.e., highly divergent predictions about the frequency distribution of these alleles), incompatible with the hypothesis of low, and classes of sites under various models of population his-therefore would have some power to detect the bottle- tory (WakeleyandHey1997). This approach may be neck. Microsatellite data, however, are often more vari- applied to the three models we develop in this article, able than sequence data and are more easily collected making it possible to detect diversity-reducing events from a high number of loci. Cornuet and Luikart from highly recombining sequence data.
(1996) devised tests for detecting bottlenecks from al- Many thanks to Jody Hey and Kevin Dawson for helpful discussions. lele-frequency data, using the sampling distribution of This work was supported by grant NERC R34365 and by a postdoctoral fellowship from the Federation of European Biochemical Societies.
Kingman, J. F. C.,1982 The coalescent. Stoch. Proc. Appl. 13: 235–
LITERATURE CITED
248.
Kuhner, M. K., J. Yamato andJ. Felsenstein, 1995 Estimating
Barton, N. H.,1998 The effect of hitch-hiking on neutral
genealo-gies. Genet. Res. 72: 123–133. effective population size and mutation rate from sequence data
using Metropolis-Hastings sampling. Genetics 140: 1421–1430.
Benassi, V., F. Depaulis, G. K. MeghlaouiandM. Veuille,1999
Partial sweeping of variation at the Fbp2 locus in a West-African Li, W. H.,1993 So, what about the molecular clock hypothesis? Curr. Opin. Genet. Dev. 3: 896–901.
population of Drosophila melanogaster. Mol. Biol. Evol. 16: 347–353.
Liu, F., L. ZhangandD. Charlesworth,1998 Genetic diversity
Charlesworth, D.,andB. Charlesworth,1995 Quantitative
ge-in Leavenworthia populations with different ge-inbreedge-ing levels. netics in plants: the effect of breeding systems on genetic
variabil-Proc. R. Soc. Lond. Ser. B. 265: 293–301. ity. Evolution 49: 911–920.
Maruyama, T.,andP. A. Fuerst,1985 Population bottlenecks and
Charlesworth, B., D. CharlesworthandM. T. Morgan, 1995
non-equilibrium models in population genetics. II. Number of The pattern of neutral molecular variation under the background
alleles in a small population that was formed by a recent bottle-selection model. Genetics 141: 1619–1632.
neck. Genetics 111: 675–689.
Cornuet, J. M.,andG. Luikart,1996 Description and power
analy-Maynard-Smith, J.,andJ. Haigh,1974 The hitch-hiking effect of sis of two tests for detecting recent population bottlenecks from
a favourable gene. Genet. Res. 23: 23–35. allele frequency data. Genetics 144: 2001–2014.
Nielsen, R.,1998 Maximum likelihood estimation of population
Depaulis, F.,1998 Auto-stop en liaison aux inversions
chromosom-divergence times and population phylogenies under the infinite iques chez Drosophila melanogaster. Ph.D. thesis, Universite´ Paris
sites model. Theor. Popul. Biol. 53: 143–151. 6, France.
O’Brien, S. J.,andJ. F. Evermann,1988 Interactive influence of
Depaulis, F., L. Brazierand M. Veuille, 1999 Selective sweep
infectious disease and genetic diversity in natural populations. at the Drosophila melanogaster Suppressor of Hairless locus and its
Trends Ecol. Evol. 3: 254–259. association with the In(2L)t inversion polymorphism. Genetics
Press, W. H., S. A. Teukolsky, W. T. VetterlingandB. P. Flannery,
152:1017–1024.
1992 Numerical Recipes in C, Ed. 2. Cambridge University Press,
Gillespie, J. H.,1991 The Causes of Molecular Evolution. Oxford
Uni-Cambridge, United Kingdom. versity Press, Oxford.
Rich, S. M., M. C. Licht, R. R. HudsonandF. J. Ayala,1998
Malar-Griffiths, R. C.,andS. Tavare,1994a Simulating probability
distri-ia’s Eve: evidence of a recent population bottleneck throughout butions in the coalescent. Theor. Popul. Biol. 46: 131–159.
the world populations of Plasmodium falciparum. Proc. Natl. Acad.
Griffiths, R. C.,andS. Tavare,1994b Sampling theory for neutral
Sci. USA 95: 4425–4430. alleles in a varying environment. Philos. Trans. R. Soc. Lond. B
Rogers, A. R.,andH. Harpending,1992 Population growth makes Biol. Sci. 344: 403–410.
waves in the distribution of pairwise genetic differences. Mol.
Griffiths, R. C.,andS. Tavare,1995 Unrooted genealogical tree Biol. Evol. 9: 552–569.
probabilities in the infinitely-many-sites model. Math. Biosci. 127: Saitou, N.,andM. Nei,1987 The neighbor-joining method: a new
77–98. method for reconstructing phylogenetic trees. Mol. Biol. Evol.
Hastings, W. K.,1970 Monte Carlo sampling methods using Markov 4:406–425.
chains and their applications. Biometrika 57: 97–109. Tajima, F.,1989 Statistical methods for testing the neutral mutation
Hudson, R. R.,1991 Gene genealogies and the coalescent process, hypothesis by DNA polymorphism. Genetics 123: 585–595. pp. 1–44 in Oxford Surveys in Evolutionary Biology, Vol. 7, edited Wakeley, J.,andJ. Hey,1997 Estimating ancestral population pa-by D. Futuyma andJ. Antonovics. Oxford University Press, rameters. Genetics 145: 847–855.
London. Wilson, I. J.,andD. J. Balding,1998 Genealogical inference from
Hudson, R. R., M. KreitmanandM. Aguade,1987 A test of neutral microsatellite data. Genetics 150: 499–510. molecular evolution based on nucleotide data. Genetics 116: