Reasoning about Complementary Intrusion Evidence
Yan Zhai, Peng Ning, Purush Iyer, Douglas S. Reeves
Cyber Defense Laboratory
Department of Computer Science
North Carolina State University
Raleigh, NC 29695-8207
yzhai, pning, purush, [email protected]
Abstract
This paper presents techniques to integrate and rea-son about complementary intrusion evidence such as intrusion alerts generated by intrusion detection sys-tems (IDSs) and reports by system monitoring or vul-nerability scanning tools. To facilitate the modeling of intrusion evidence, this paper classifies intrusion dence into either event-based evidence or state-based evi-dence. Event-based evidence refers to observations (or de-tections) of intrusive actions (e.g., IDS alerts), while state-based evidence refers to observations of the ef-fects of intrusions on system states. Based on the inter-dependency between event-based and state-based evi-dence, this paper develops techniques to automatically integrate complementary evidence into Bayesian net-works, and reason about uncertain or unknown intrusion evidence based on verified evidence. The experimen-tal results in this paper demonstrate the potential of the proposed techniques. In particular, additional observa-tions by system monitoring or vulnerability scanning tools can potentially reduce the false alert rate and in-crease the confidence in alerts corresponding to successful attacks.
1. Introduction
It is well-known that current intrusion detection systems (IDSs) produce large numbers of alerts, including both ac-tual and false alerts. The high volume and the low quality of intrusion alerts (i.e., missed attacks and false alerts) make it a very challenging task for human users or intrusion re-sponse systems to understand the alerts and take appropri-ate actions.
Several alert correlation techniques have been proposed to facilitate the analysis of intrusion alerts, including those based on the similarity between alert attributes [8, 12, 30,
33], previously known (or partially known) attack scenar-ios [13, 14], and prerequisites and consequences of known attacks [9, 24]. However, most of these correlation meth-ods focus on IDS alerts, overlooking other intrusion evi-dence provided by system monitoring tools (e.g., anti-virus software) and vulnerability scanning tools (e.g., Nessus [3], SATAN [16], Nmap [17]). Since none of the above methods can perfectly construct attack scenarios due to the imperfec-tion of the IDSs, it is desirable to include addiimperfec-tional, com-plementary intrusion evidence to further improve the per-formance of intrusion analysis.
Several researchers recently investigated ways to con-sider multiple information sources during intrusion analysis [23,26]. A formal model named M2D2 was proposed to rep-resent data relevant to alert correlation, including character-istics of monitored systems, properties of security tools, and observed events [23]. Though quite useful for alert correla-tion, M2D2 does not provide a specific mechanism to au-tomatically reason about information provided by multiple sources. Another mission-impact-based method [26] rea-sons about the relevance of alerts by fusing alerts with the targets’ topology and vulnerabilities, and ranks alerts based on their relationships with critical resources and users’ in-terests. Though the mission-impact based method can auto-mate the analysis of intrusion alerts, the construction of a mission-impact based model requires substantial human in-tervention, and the constructed model is highly dependent on the monitored systems. Thus, it is desirable to seek other effective mechanisms that can handle complementary intru-sion evidence automatically.
In this paper, we develop techniques to automatically in-tegrate and reason about complementary intrusion evidence, including IDS alerts, reports from system monitoring or vul-nerability scanning tools, and human observations.
detected attacks, are uncertain due to the imperfection of current IDSs. To reason about uncertain IDS alerts, our ap-proach automatically builds Bayesian networks that consist of variables representing IDS alerts and system states. With additional, complementary evidence about system states provided by system monitoring tools, vulnerability scan-ning tools, and human observations, we can then make fur-ther inference about uncertain IDS alerts. As a result, we can increase our confidence in alerts corresponding to suc-cessful attacks, and at the same time reduce the confidence in false alerts.
The main contribution of this paper is a reasoning frame-work for complementary intrusion evidence. To our best knowledge, this is the first attempt to automatically inte-grate and reason about complementary intrusion evidence such as IDS alerts and vulnerability scanning reports. In addition, we also perform a series of experiments to vali-date our approach and gain further insights into the prob-lem. The experimental results demonstrate the potential of the proposed approach as well as the effectiveness of our techniques.
The rest of this paper is organized as follows. The next section describes our techniques to integrate and reason about complementary intrusion evidence. Section 3 presents the results of our initial experiments. Section 4 discusses re-lated work. Section 5 concludes this paper and points out some future research directions. The appendix includes ad-ditional details about our experiments.
2. Reasoning Framework
In this section, we present our techniques to reason about complementary intrusion evidence, including IDS alerts and reports from system monitoring tools or vulnerability scan-ning tools. In the following, we first describe our represen-tation of intrusion evidence, and then present the frame-work to reason about complementary intrusion evidence us-ing Bayesian networks.
2.1. Modeling Intrusion Evidence
We classify intrusion evidence into two categories: event-based evidence and state-based evidence. Event-based evidence refers to observations (or detections) of attacks. For example, an IDS alert of a buffer over-flow attack against a web server is event-based evidence. State-based evidence refers to observations of the ef-fect of attacks on system states. For example, the existence of a rootkit1 on a machine is state-based evidence
indicat-1 A rootkit is a collection of tools (programs) that a hacker uses to mask intrusion and obtain administrator-level access to a computer or
computer network (http://searchsecurity.techtarget.
com).
ing that the machine has been compromised.
2.1.1. System Attributes and State-Based Evidence We follow [6, 29] to represent system states (e.g., vulnerabil-ities, attacker access privileges, and network connectivi-ties) as system attributes (or simply attributes), each of which is a boolean variable representing whether the sys-tem is in a certain state or not. For example, we may use RootkitInstalled = True to represent that a rootkit is installed on the system of concern. Notation-wise, we use a system attribute directly to represent that it is True, and use its negation to represent that it is False. For exam-ple, we may useRootPrivilegeto represent that an at-tacker has acquired root privilege on the system, and use its negation¬RootPrivilegeif not. There may be implica-tion relaimplica-tionships between attributes, which also come from expert knowledge. For example, RootPrivilege im-plies FileTransferPrivilege, which indicates that an attacker having the root privilege also has the privilege to transfer files from/to the system. Note that such a represen-tation can be extended to include variables to provide more flexibility. For example, we may use RootPrivilege (x)to represent the attacker has acquired root privilege on hostx. However, for simplicity, we do not do so in this pa-per.
State-based evidence consists of observations on sys-tem attributes related to possible attacks. They may be col-lected by vulnerability scanning tools (e.g., Nmap [17], XS-can [34]), system monitoring tools (e.g., anti-virus soft-ware), or through human observations. Such system state information may be changed during running time, and such changes may be detected by monitoring/scanning tools. We refer to the change of an attribute as an attribute alteration. Since these attribute alterations are potentially related to at-tacks, the time information of them is also important for in-trusion analysis. The timestamp of an attribute alteration is the time when the alteration is detected or inferred. Such a timestamp can be stored together with each attribute alter-ation.
an attribute is0.5. Intuitively, this represents the lack of in-formation about the state of the attribute.
2.1.2. Event-Based Evidence Typical sources of event-based evidence include event logs, IDS alerts, network traf-fic logs, system call logs, etc. Different kinds of logs pro-vide event-based epro-vidence on the system in different gran-ularities and toward different aspects of the system. In this paper, the only event-based evidence we consider is IDS alert, which is in a coarser granularity but more under-standable by human compared with other types of system logs. We will use IDS alerts and event-based evidence in-terchangeably in the rest of the paper. Our representation of IDS alerts is closely related to our model of attacks. Thus, we first introduce our representation of attacks before dis-cussing IDS alerts.
Similar to [6,29], we model an attack as an atomic trans-formation that establishes a set of system attributes called postcondition, given a logical condition called condition over system attributes. Intuitively, if the pre-condition of an attack is satisfied, the attack can then transform the system into the state specified by its post-condition. Given a certain privilege, an attacker may exploit some vulnerabilities of a system to launch an at-tack, which may introduce further vulnerabilities into the system, or give more privileges to the attacker. For example, an attack sshd buffer overflow may have sshd running∧sshd vulnerable as the precondition, and {root access, ¬sshd running} as the postcondition. In other words, ansshd buffer overflowattack requires that the vic-tim system runs a vulnerable sshd daemon, and as the result of this attack, the attacker gains root access privi-lege and thesshddaemon stops running.
IDS alerts represent potentially detected attacks. Thus, we can model IDS alerts in a similar way to attacks. How-ever, IDS alerts are not exactly the attacks launched toward the target due to the imperfection of current IDSs. On the one hand, an IDS may report a false alert when it mistakes a normal operation for an attack. On the other hand, an IDS may raise no alert about an actual attack if the IDS does not recognize it. One goal of this paper is to use the ad-ditional information provided by state-based intrusion evi-dence to enhance our confievi-dence in alerts representing suc-cessful attacks and at the same time reduce our confidence in false alerts. Moreover, we would like to make reason-able hypotheses about attacks possibly missed by the IDSs based on complementary evidence, and thus make the re-constructed attack scenario more consistent and closer to the reality.
To facilitate the reasoning about IDS alerts, we use the prior confidence of each attack to represent its quantitative property. The prior confidence of an attack type T, denoted Pr(T), is the prior belief we have about the probability for a
corresponding alert to represent an actual type T attack. The prior confidence of each type of attack can be gathered by analyzing historical data. It represents our prior knowledge about IDS alerts based on previous experience. One may observe that prior confidences are not constant for each at-tack type as they are dependant on not only the quality of the IDSs, but also the attack frequency and background ac-tivities in a specific system. However, in the later part of this paper, we will see that our reasoning approach is still use-ful despite the dynamic nature of the prior confidences, be-cause it reduces the uncertainty of intrusion evidence when additional verified evidence is considered. In some sense, Pr(T) is the belief that a type T alert is a real instance of at-tack, and our reasoning framework is to increase or decrease our belief in alerts based on complementary instusion evi-dence.
Similar to the confidence in a system attribute, we refer to the probability that an IDS alert corresponds to a success-ful attack as the confidence in the alert.
We summarize our prior knowledge about IDS alerts and attacks below:
• An IDS alert e of attack type T has the probability Pr(T) to be a real attack;
• A real attack E has probability 1 to be successful when its precondition is satisfied by the system attributes be-fore the attack happens;
• A real attack E has probability 0 to be successful if its precondition is not satisfied by the system attributes before the attack happens;
• The attributes in the postcondition of a successful at-tack E are True after the atat-tack happens.
2.2. Basic Reasoning framework
In normal situations, a system should stay in a legitimate state. Starting from a legitimate system state, an attacker may launch a sequence of attacks to get the system into some intermediate states, and finally into the attacker’s ob-jective state. It is easy to see that there exist causal relation-ships among attacks and system attributes. Our approach is to use these causal relationships to reason about comple-mentary IDS alerts and system attributes reported by scan-ning/monitoring tools. Specifically, we organize IDS alerts and system attributes into Bayesian networks [18] based on those causal relationships, and use these Bayesian networks to reason about complementary intrusion evidence.
cor-responding attacks into a directed graph, which we call an alert-attribute network.
Each node in such a graph is a binary variable represent-ing either an IDS alert or a system attribute. For brevity, we refer to a node representing an IDS alert (or a system attribute) directly as an IDS alert (or a system attribute). When a node represents a system attribute, it can denote ei-ther a piece of state-based evidence (e.g., scan report), or a hypothesized attribute alteration caused by an IDS alert. A node denotes a hypothesized attribute when the attribute is in the postcondition of the attack corresponding to an IDS alert. Each node is timestamped. The timestamp of an alert node is the time when the corresponding activities take place, while the timestamp of an attribute node is the time when the attribute alteration is observed or inferred.
All edges in the graph are directed. An edge from an alert node to an attribute node represents that the correspond-ing attack changes the system attribute into this new state. An edge from an attribute node to an alert node represents that the attribute is a part of the precondition of the corre-sponding attack. An edge from an attribute node to another attribute node represents that the first attribute implies the second attribute. There are no edges that connect two alert nodes together directly.
We construct such a graph starting with the initial sys-tem state, which is represented in the graph as a set of at-tribute nodes corresponding to the initial atat-tributes. As time goes by, new IDS alerts and system monitoring reports are raised. When a new IDS alert is reported, a corresponding alert node is added into the graph only if the alert’s condition is evaluated to be True given the attributes pre-sented in the graph by the time. Also, edges are added from the latest attribute nodes corresponding to the attributes in the alert’s precondition to the newly generated alert node (to represent the causal relationships). To serve the same pur-pose, edges from the alert node to its postcondition attribute nodes are also established when they are created. For each attribute node in the alert’s postcondition, if nodes related to the same attribute already exist in the graph, which could either be caused by some previous alerts or reported by sys-tem monitoring tools, an edge from the latest such node to the new node is added to represent the implication relation-ship. By doing so, each attribute node in the graph repre-sents the accumulative effects on the attribute of all the prior related alerts. Thus, when an attribute is part of the precon-dition of an alert, only the latest attribute node before this alert is connected to the alert node. Note that we represent this construction process like it is done in real-time to em-phasize the importance of the time sequence of intrusion ev-idence, however, all the construction and analysis processes can be done offline following the time sequence of the IDS alert log and scan reports.
One may notice that an attack may affect many attributes,
and some of the attributes does not contribute to other alerts’ corresponding attacks. We are not cutting the attributes out because we want to make the graph as close to the system state history as possible. We will see in later sections that the attribute information is very important in making hypothe-ses about possible missed attacks, while including such non-contribution attributes really does not increase the complex-ity of the Bayesian inference computation in the next step.
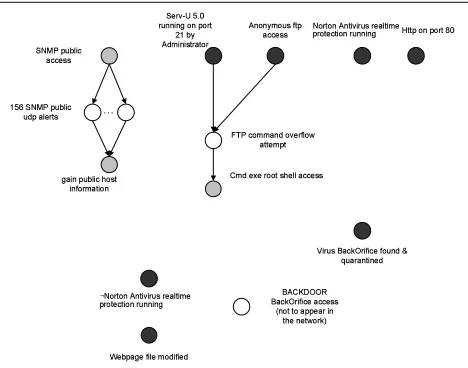
Figure 1. A Bayesian network built from intru-sion evidence
Figure 1 shows an example alert-attribute network, which is constructed as discussed above. The gray nodes represent initial or updated system attributes, and the white nodes represent IDS alerts. Initially, both at-tribute sshd running and vulnerable sshd are set to True. For simplicity, we do not show the ini-tial system attributes that are not involved in the pre-condition or postpre-condition of the corresponding at-tacks. Alert sshd buffer overflow indicates an attempt to compromise the system through the vulnera-ble sshd. The precondition ofsshd buffer overflow is sshd running∧vulnerable sshd, and the post-condition is {¬sshd running, root access}. Thus, this attempt can be successful since its precondition is satisfied in the system state. As a result, this attack in-troduces two attribute alterations: ¬sshd running and root access. In other words, the attacker stops the sshd daemon and gains root access to the system. As shown in Figure 1, the attacker then installs a mstream zombie pro-gram, changing the attributeDDoS daemon installed from False to True.
2.2.2. Conditional Probabilities A Bayesian network is a directed acyclic graph (DAG), where each directed edge represents a causal relationship between the two ends of the edge, and each node stores a conditional probability table describing the statistical relationships between the node and its parent nodes [18].
acyclic. Indeed, all the edges are from previously existing nodes to newly added nodes, and thus will not result in any cycle. From our discussion above, the causal relationships among the nodes in an alert-attribute network are obvious. Now we discuss how to determine each node’s conditional probability table so that the alert-attribute network becomes a Bayesian network.
When an IDS alert e is reported, the probability for the alert e to be a real attack is P r(e). The vari-able e being True represents that the corresponding at-tack is successful. We assume an atat-tack will succeed if its precondition is satisfied. Thus, the probability ofe be-ing True is the prior confidence of the correspondbe-ing IDS alert when its precondition is satisfied, or 0 other-wise. Since attack’s precondition is a logic formula of sys-tem attributes, the conditional probability of an alert node can be easily derived. The conditional probability ta-ble associated with node sshd buffer overflow in Figure 2 shows such an example, where we
as-sume Pr(sshd buffer overflow) = 0.6. Note that
the probability of an IDS alert variable being False un-der these preconditions can be easily computed from the above probabilities. Thus, we do not include them here.
!"#$$%$&'
!%#&("&
) !#((*(+ !#((*(+
sshd_
running sshd_ vulnerable
P(sshd_buffer_ overflow=TRUE) FALSE FALSE 0 FALSE TRUE 0 TRUE FALSE 0 TRUE TRUE 0.6
sshd_buffer
_overflow
P(root_access =TRUE) FALSE 0
TRUE 1
sshd_buffer
_overflow P(¬sshd_running =TRUE) FALSE 0
TRUE 1
Figure 2. Conditional probability tables in an alert-attribute network
Conditional probability tables associated with system at-tributes are even simpler to compute. Indeed, if an IDS alert
erepresents a successful attack, all the system attributes in its postcondition should turn to True. Otherwise, the system attributes that are False before the IDS alert should remain False. If two attribute nodes of the same attribute are con-nected together with an edge representing implication rela-tionship, and the earlier one is True, the latter one should also be True. Thus, the conditional probability of a system attributeabeing True would be1if at least one of its
par-ent variables (either alert nodes or attribute nodes) is True, and 0 if all its parent variables are False (unless it is re-ported by system scanning/monitoring tools). The tables as-sociated withroot accessand¬sshd runningshow examples of such conditional probabilities. Similar to the above example, we only show the probabilities for the tributes to be True, from which the probabilities for the at-tributes to be False can be easily computed.
2.2.3. Reasoning about Intrusion Evidence The Bayesian networks constructed in this way offer an ex-cellent opportunity to reason about the uncertain in-trusion evidence, particularly the IDS alerts. We call those attributes with a confidence value of 1 the veri-fied attributes. The report of such veriveri-fied attributes are observations of facts. When new verified attributes are re-ported by system monitoring/scanning tools, we can use these observations to re-compute the confidence val-ues in the related previous objects in the network with Bayesian inference. And for each node in the Bayesian net-work, its final probability value is the combined result of all the evidence and knowledge. Take the Bayesian net-work shown in Figure 2 as an example. We may be uncertain about an IDS alert reporting a buffer overflow at-tack againstsshd, since the IDS has reported the same type of alerts incorrectly in the past. However, if by scan-ning the system we find thatsshdis not running properly after the IDS reports this alert, we can then update the con-fidence in ¬sshd running to be 1. Thus, we are more certain about the alert, which caused the attribute alter-ation. Though human users would do the same reasoning, placing these evidence into Bayesian networks offers addi-tional benefits, since such a reasoning process can then be performed automatically and systematically. Also such rea-soning could become too difficult for human users when dealing with very complicated scenarios.
It is easy to see that the more verified state-based evi-dence we have, the better judgement we can make by rea-soning about the uncertain IDS alerts and system states. This suggests that we should monitor the system closer and possibly scan the system more frequently, as system mon-itoring tools and vulnerability scanning tools usually gen-erate evidence with high confidence value. However, such monitoring and scanning are often expensive and may hurt the other applications by consuming resources. Thus, it is important to determine the right balance for system moni-toring and scanning activities. Nevertheless, this problem is out of the scope of this paper. We leave it for future consid-eration.
cases, such attribute nodes can be merged without affect-ing the reasonaffect-ing about intrusion evidence in alert-attribute networks. This observation is reflected by Lemma 1, which is presented next. For the sake of presentation, if two at-tribute nodesA andB are connected with edge (A, B), we refer to the action of removing nodeAwith all its out-going edges and redirecting all its incoming edges to node Bas mergingAintoB.
Lemma 1 Consider two attribute nodes A and B corre-sponding to the same attribute and connected by an edge (A, B). If either there is no other outgoing edge from node AorAis instantiated (verified), mergingAintoBdoes not change the probability of any other node when reasoning about intrusion evidence.
proof: The proof is divided into two steps. The first step is to prove that merging the two nodes will not affect other nodes in the downward reasoning in the Bayesian network. The second step is to prove that such a merge will not af-fect the posterior probability values of other nodes in the up-ward reasoning (belief updating) in the Bayesian network.
As shown in Figure 3, we assum node A’s par-ent nodes are X1, X2, . . . , Xm, node B’s parent nodes are Y1, Y2, . . . , Yn and A, and (A,B) is the only outgo-ing edge fromA.
,
-. /
0 1 ,
/ 222
. 3 222
,
-. /
0 ,
/ 222
. 3 222
Figure 3. Merging two attribute nodes
SinceAandBare both attribute nodes,Ais True if any ofX1,X2,. . .,Xmis True, andBis True if any ofA,Y1,
Y2,. . .,Ynis True. Thus,Bis True if any ofA,X1,X2,. . .,
Xm,Y1,Y2,. . .,Ynis True. After mergingAintoB,B’s par-ent nodes areX1,X2,. . .,Xm,Y1,Y2,. . .,Yn, andBis True
if any of these nodes is True, which is exactly the same logic equation as before the merging. Thus, in the downward rea-soning process, the probability value of any node other than Ain the network remains the same as before mergingAinto B.
When computing the posterior probability value of a nodeMin the network after there is additional verified evi-denceE, the posterior probability can be computed as
P(M|E) = P(M, E)
P(E) .
In this equation, P(E) and P(M, E) are derived from margining out all the other variables in the joint
probabil-ity densprobabil-ity functionP rob(S), whereS is the set of all the nodes (X1, X2,· · ·,Y1,· · ·,M,· · ·) in the Bayesian net-work.
BecauseAandB’s probability values solely depend on
Xi and Yj, given a set of input (A, B,{Xi},{Yi},· · ·), the probability value P rob(A, B,{Xi},{Yj},· · ·) either equals to0asAandBcannot beTruegiven({Xi},{Yj}), or equals to P rob({Xi},{Yj},· · ·)as A andB are deter-mined to beTruegiven({Xi},{Yj}). Thus, the result of margining outA andB from P rob(S) before mergingA intoB X
B
X
A
P rob(A, B,{Xi},{Yj},· · ·)
equals to
X
B=T rue
P rob({Xi},{Yj},· · ·). (1)
Similarly, margining outB from the joint probability den-sity function of all nodes after the merge can also be repre-sented as
X
B=T rue
P rob0({X
i},{Yj},· · ·), (2)
whereP rob0({X
i},{Yj},· · ·)is the joint probability den-sity function of the rest of the nodes in the merged network. BecauseAandBare solely dependant on{Xi}and{Yj}, andB’s conditional probablity table over({Xi},{Yj})does not change after the merge, formula 1 equals to formula 2. Thus, the posterior probability of any other node in the net-work remains the same as before mergingAintoB. 2 With Lemma 1, we can recursively merge attribute nodes that satisfy the condition specified in Lemma 1 to reduce the complexity of the network structure without affecting the reasoning result.
2.3. Alert Aggregation and Abstraction
The reasoning framework can greatly reduce the num-ber of false alerts, and provides a method to combine mul-tiple observations in intrusion analysis. However, in real-ity, IDSs often generate a large number of alerts for the same attack during a short period of time. Such alerts may be due to repeated attack attempts, or false alerts triggered by similar and repeated normal operations. For example, Snort [28] generated 24 “SNMP public access udp” alerts in our experiment without raising any other alert dur-ing a period of 10 minutes. As a result, these alerts share the same parent nodes and child nodes in the Bayesian network. This introduces two problems. First, a child node of the 24 “SNMP public access UDP” alerts has a conditional probability table with224
fly. Second, when we use verified evidence discovered later to reason about these 24 alerts, the effect of the additional evidence will spread over these 24 alerts, since we do not know which of the 24 alerts indeed contributes to the mod-ification of system attributes or later attacks.
In practice, when there are multiple consecutive alerts of the same type of attack, we usually do not care which one is the actual successful attack, but whether at least one of them is successful and changes the system state. Thus, a natural approach to addressing the above problem is to aggregate such alerts together into one single node, which represents “at least one of the component alerts corresponds to a suc-cessful attack”. Specifically, we aggregate the alert nodes that have the same attack type, parent nodes, and children nodes into one aggregated alert node.
The conditional probability table of an aggregated alert node can still be computed similarly. However, we need to use aggregated prior confidence value P ra, which repre-sents the probability that at least one of its component alerts corresponds to an actual attack. Givenncomponent alerts for attack typeT that are merged into one aggregated alert, the aggregated prior confidenceP ra(T)can be computed as
P ra(T) = 1−(1−P r(T))n.
IDSs usually raise different alerts for similar attacks, or variations of the same attack. For example, Snort has more than 100 WEB-IIS related alerts, and many of them are ex-ploiting the same unicode vulnerability and have the same impact. In many cases we do not care about the subtle differ-ence between these alert variations, but only want to know if any of them is a successful attack. Thus, we may consider these alerts as the same type of alerts in a coarser granu-larity. To do so, we abstract alert variations into one com-mon alert and apply alert aggregation. Specifically, we re-place the attack type of each IDS alert with an abstract at-tack type, and follow the same procedure as for alert ag-gregation. Note that this abstraction requires human knowl-edge about the alerts and attack types.
Since different variations of the alerts being aggregated may have different prior confidence values, we need to ad-just the computation of the aggregated prior confidence slightly. The prior confidence is computed as below:
P ra(T) = 1− n
Y
i=1
(1−P r(T ypeai)),
wherea1, a2, ..., anare the alerts to be aggregated,T ypeai
is the attack type of alertai, andT is the aggregated attack type.
2.4. Hypothesizing about Missed Attacks
With alert aggregation and abstraction, our model can handle a larger number of alerts generated by IDSs.
How-ever, the model still cannot deal with missed attacks. When there is a missed attack, the effect of the attack on the sys-tem will not be reflected in the alert-attribute network, and some later alerts corresponding to successful attacks may be considered False. Thus, the alert-attribute network gen-erated by the model may not reflect the reality when there are missed attacks. In other words, the current model only works when there are no missed attacks. (Note that this is a common problem shared by almost all alert correlation methods.) Because none of the current IDSs can guaran-tee to detect all attacks, it is necessary to improve the rea-son framework to deal with missed attacks.
We observe that when successful attacks are missed by IDSs, it is still possible for the system monitoring tools to catch the impact of the attacks on the system states. In other words, we may observe “unexpected” attribute alterations caused by the missed attacks. Such cases essentially cause inconsistency in the alert-attribute networks, where an at-tribute alteration is reported by system monitoring tools but there are no alert nodes in the network leading to the alter-ation.
Considering the defectiveness of current IDS technol-ogy, we can expect that such inconsistencies are bond to happen in practice. Thus, we propose to hypothesize about missed attacks based on the above inconsistencies in alert-attribute networks. Inconsistencies are almost al-ways caused by missed attacks: An “unexpected” attribute alteration causing the inconsistencies can either be di-rectly caused by some successful attack missed by IDSs, or by a detected attack that does not appear in the network be-cause its precondition is not satisfied in the network with-out the missed successful attacks. The only exception is that it could be caused by false alerts if the monotonicity prop-erty of attacks does not hold for some particular types of attacks, that is, a successful attack disables other at-tacks’ preconditions. According to [29], this kind of attacks are very rare. We can always recognize such at-tacks and pay additional attention in the investigation when they are involved.
4556 7889::
;<=>?@@ 4 ;78A@ BCDC89 CE:67FF9G
;<=>?@ @4 ;78A@BCDC89 7889:: HE:67FF
;78A@BCDC89
Figure 4. An example of hypothesized attack
of a possibly missed attack “Install BackOrifice” linking the attribute nodes “Root access” and “BackOrifice installed”. The hypothesized node and edges are presented with dot-ted lines in the figure.
A hypothesis upon a possibly missed attack infers that
• the attack has happened,
• the attack has been missed by IDSs, and
• the attack is successful.
Thus, as the three properties are independant from each other, the probability of a hypothesized attack being a cor-rect hypothesis is Phypothesis = Phappened · Pmissed ·
Psuccessf ul, wherePhappenedis the probability for the at-tack to have happened,Pmissed is the probability for the IDS to miss the attack, and Psuccessf ul is the probabil-ity for the attack to succeed if it happens. From our pre-vious discussion, the successfulness of an attack is deter-mined by whether its precondition is satisfied by the sys-tem attributes. Thus, a hypothesis will have a probability of
Phappened·Pmissedif its precondition is satisfied by the sys-tem attributes. Then, the conditional probabilty table of a hypothesis node over the attributes in the attack’s precondi-tion is similar as a normal alert node’s probability table ex-cept that the non-zero value of the node in the conditional probability table isPhappened·Pmissedinstead of Pr.
Pmissed is the prior knowledge (or the belief) of hu-man experts about known attack types, which can be collected from historical data and experience. How-ever, Phappen solely depends on the attacker’s knowl-edge and personal preference, which is unpredictable. There is no way that we can have a fixed value of this prob-ability. Thus, we use the value Pmissed instead in the conditional probability table, which represents the proba-bility for the hypothesis to be True given the condition that it has actually happened and its precondition is sat-isfied. Accordingly, we refer to the probability computed
from the Bayesian network with this conditional prob-ability table the confidence in the hypothesized attack. Although this confidence value has a different mean-ing from that in those normal alert nodes, it still shows which hypothesis is more expectable given the available ev-idence.
We add the the hypothesized attacks with the corre-sponding conditional probability tables into the alert-attribute network. From the earlier discussion, we can see that such a hypothesis is made and placed into the alert-attribute network only if the attack is possible given the system state at the time. However, there may be later ev-idence showing that some attribute in the pre/post-condition of the hypothesized attack is not valid, and such evidence will affect the belief of the hypothesized attacks via be-lief update process in Bayesian inference. Thus, with the Bayesian network inference, we can always keep the hy-potheses consistent with our observations in the system. For example, we may find negative evidence against a hy-pothesis, and the Bayesian inference process may update the probability of the hypothesized attack to 0, imply-ing that the hypothesis cannot be a successful attack.
Validation is necessary for all hypotheses. From the above discussion about Bayesian inference about the hy-potheses, we can see that the validation process is already embedded in the Bayesian inference process. Our belief in hypotheses is always consistent to the latest evidence of the system. Further details with examples about making and validating hypotheses are discussed in section 3.
2.5. Scaling Up
The reader may have observed that as more IDS alerts are reported, the Bayesian network will grow larger and larger. Though by periodically scanning the system and gathering evidence about attacks, we may verify earlier alerts to be ei-ther successful or not, ei-there will still be a number of unver-ifiable alerts. This has a severe impact on intrusion anal-ysis. Indeed, both exact and approximate inferences in a Bayesian network upon partially observed evidence have been proved to be NP-hard [7, 11]. It is very expensive, and even infeasible, to make inferences upon new evidence if the Bayesian network is very large and complex.
One possible solution is to rebuild Bayesian networks when the previous ones grow too large. This can avoid in-tractable Bayesian networks. However, the effect of the ev-idence accumulated in the previous Bayesian networks will be lost, especially the system attributes that have been rea-soned about using other evidence but not yet verified. As a result, information collected in an earlier Bayesian network cannot be carried over to the new one.
win-dow to process and reduce the Bayesian networks. Specif-ically, we use a time window to decide what evidence to keep in the Bayesian network as well as what to remove. When new alerts or scanning results are reported, we slide the window so that the front of the window advances to the most recent evidence. Some old evidence may move out of the window, and be removed from the Bayesian network. IDS alerts can be simply removed from the network. How-ever, for system attributes, the last version before the end of the window will be used as the initial system state in the up-dated Bayesian network.
Note that the effect of the removed evidence is still kept in the Bayesian network. When a Bayesian network is first constructed, all the probabilities of the nodes are computed from the prior probabilities. As old nodes are removed, pre-viously internal nodes become the root nodes of the updated Bayesian network. These new root nodes use the previously updated probabilities as their prior probabilities for later in-ferences. As a result, the effect of earlier evidence is re-tained by the updated Bayesian network.
One may point out that sliding windows give attackers an opportunity to defeat our technique. That is, an attacker may slow down his/her attacks so that the related attacks are not effectively considered since they do not appear in the same Bayesian network. However, even if an attacker slows down the attacks, the effect of each successful attack step is still captured by its postcondition in a Bayesian network, if the attack is detected. Thus, we can still reason about an indi-vidual alert if its postcondition is verified. Moreover, if an attacker has to slow down his/her actions to avoid being de-tected, our technique has already deterred attacks.
The size of the sliding window is critical to the effec-tiveness of the Bayesian networks. If the window size is too small (e.g., shorter than the time interval between two con-secutive system scans), some IDS alerts may be discarded before we can use related evidence to reason about them. Certainly, such a Bayesian network cannot be too large due to the difficulty in computing with large Bayesian networks. Thus, we should balance the computational cost and the risk of losing information The computational cost of cor-relation and Bayesian inference is highly dependent on the amount of alerts and the amount of real attacks among those alerts. More frequent, deeper, wider system scans can de-crease the size of the Bayesian network, while the compu-tational cost of such scans also increases as its frequency, depth, and width increases. All those considerations make the problem even more complex. Those issues are already out of the scope of this paper, we will leave them to our fu-ture study.
3. Experimental Results
We have performed a series of experiments to evaluate the effectiveness of the proposed techniques. In our experi-ments, we connected three PCs through a hub in an isolated network. For convenience, we refer to them as attacker, vic-tim, and IDS. We launched attacks from the attacker against the victim, while monitoring the attacks on the IDS.
We use Snort version 1.9.1 [28] as the IDS sensor. We also use Nessus [3] and XScan [34] as the vulnerability scanning tools. We evaluate our techniques with five at-tack scenarios, which we refer to as Scenario 0 to Scenario 4. The goals of these attack scenarios vary from modify-ing the target’s web page to convertmodify-ing the target machine into a part of attacker’s own distributed network. Some at-tack scenarios target MS Windows systems, while the oth-ers target Linux systems. Accordingly, the victim runs either Windows or Linux, depending on the attack scenarios. We run TripWire [5] (for MS Windows) and Samhain [4] (for Linux) on the victim as the file system integrity monitoring tools. We also run Trojan horse scanning tools Tauscan [31] (for MS Windows) and chkrootkit 0.43 [1] (for Linux) on the victim as additional system scanning tools. We devel-oped a program to automatically generate alert-attribute net-works from the IDS alerts and the reports of these scanning tools, and then use JavaBayes [2] to make inference using these networks.
To simulate the realworld system administration, we configure the file system integrity monitoring tools (Trip-wire and Samhain) to monitor important files and directo-ries only, i.e., system configurations files, service configu-ration files, and the main webpage files.
To mimic an operational network, we also inject back-ground traffic into the network during our experiments. We randomly select one of the training datasets (the training dataset on Monday in the third week) in the 1999 DARPA intrusion detection evaluation datasets [22] as the back-ground traffic in the experiments, as it is attack free. This background traffic triggers 325 alerts in Snort, which are all false alerts. All the other alerts reported by Snort are real alerts.
In the rest of this section, we first present the analysis of Scenario 0 in detail, and then summarize the results of all five attack scenarios. Additional details of the other four at-tack scenarios are included in the Appendix.
3.1. Analysis of Scenario 0
anony-mous access. At the same time, the victim also runs Nor-ton antivirus with file system real-time protection. When the system attemps to access a file containing known virus or backdoor, the file system real-time protection will quar-antine the file.
The attack scenario includes five steps:
1. remote buffer overflow attack against the Serv-U,
2. attempt to install BackOrifice on the victim, which was quarantined by Norton antivirus,
3. kill the Norton antivirus process with system process tools through the remote administrative shell,
4. install the BackOrifice again (successful), and
5. changing the web page through BackOrifice.
The initial system attributes include
• Serv-U 5.0 on port 21,
• anonymous ftp access,
• Norton Antivirus with file system real-time protection, and
• http on port 80.
During the attack process, Snort reported the following 2 alerts:
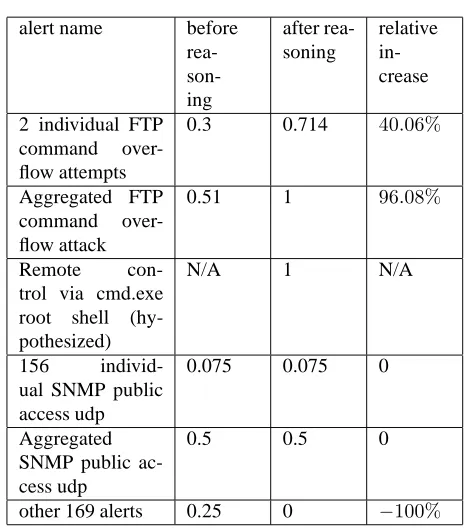
• OneFTP command overflow attemptalert
• OneBACKDOOR BackOrifice accessalert
Norton also logged that BackOrifice was found in the file system and quarantined successfully during the attack pe-riod. In the end, Tripwire logged and reported the modifica-tion to the web page file and the system logged that Norton antivirus was shut down.
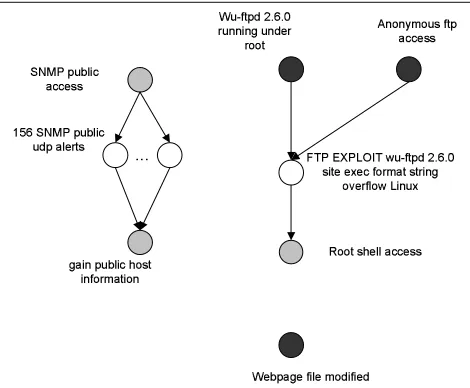
3.1.2. Reasoning about Intrusion Evidence Our alert-attribute network generation tool generated the network shown in Figure 5 based on the above information and the prior probabilities and attack type information, which are included in the appendix,.
To distinguish between different types of nodes in a Bayesian network, we use white nodes to denote IDS alerts, gray nodes to denote unverified system attributes, and black nodes to denote verified system attributes. The relative ver-tical position of nodes in the graph represents the relative time order among nodes.
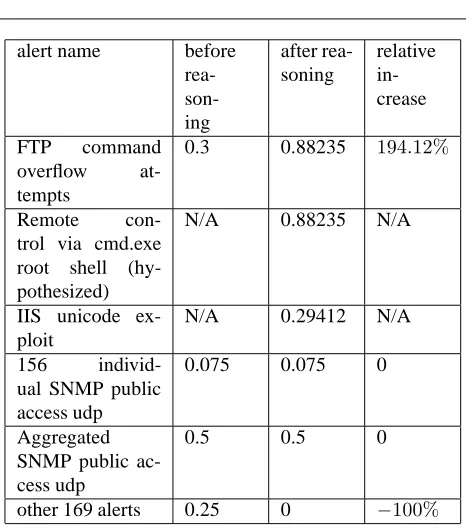
Note that Figure 5 includes 156 “SNMP public access udp” alerts, which results in 2156
entries in the conditional probability table of gain public information. Computing with such a conditional prob-ability table is out of JavaBayes’ handling capacity. How-ever, after alert aggregation, the 156 nodes are aggregated into a single node and thus can be handled easily by Jav-aBayes.
IJKLMNOPQ KRSSTSUVSWVKX
YZ[\ ]^_TST` XKaXVK
bcdeV__aS^VLJK f g Vh aXXJ_W X
i_^PJjJK VVX`kJggaeeJ`` ]SVS\_VR`f XW
aeeJ``
ZOlImndWR[gTe R^WagJK X`
UaTSWR[g TekV` X TSf VK_aXTVS ImndWR[gTe
aeeJ``
o ]ipqrrs oaetrKTfTeJaeeJ``
uSVXXVaWWJaKT S XkJSJXhVKtv
mVKXVS]SXTLT KR`K Jag XT_J WK VXJe XTVSKRSSTSU
wmVKXVS]SXTLT KR`K Jag XT_J WK VXJe XTVSKRSSTSU
xT KR`oaetrKTfT eJfVRS^y zRaKaSXTSJ^
{J[WaUJf Tg J_V^T fTJ^ |
}XXWVSWVKX~Q
Figure 5. Initial alert-attribute network
Now let us look at possible missed attacks. There are several obvious inconsistencies in Figure 5. There are no detected alerts causing the verified at-tributes “Norton Antivirus not running”, “Virus BackOrifice found & quarantined”, and “Webpage file modified”. Based on our knowledge about attacks, “Shut down Norton Antivirus via cmd.exe shell” and “Install BackOrifice” are the only possible hypotheses that can fill in the first two gaps. For the attribute “Webpage file modified”, it could be done through remote con-trol via either cmd.exe shell or BackOrifice access. The first option implies hypothesized remote control via cmd.exe, while the second one implies hypothesized instal-lation of BackOrifice after Norton was shut down. These hypotheses lead to a new alert-attribute network in Fig-ure 6.
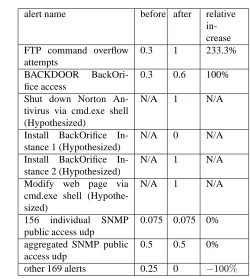
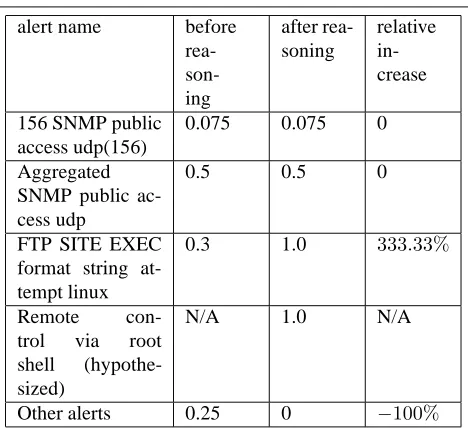
In Figure 6, the dotted nodes and edges denote hypothe-sized attacks and corresponding causal relationships. Con-ditional probability table of each node can be generated au-tomatically given the network structure and prior probabil-ity values. Then JavaBayes generates updated confidence values of each node in this Bayesian network. The confi-dence values of the related alerts before and after reason-ing are shown in Table 1. We can see significant increases in the confidence values of successful attacks; however, all the false alerts have either decreased or unchanged confi-dence.
hypothe-
¡
¢£¤¥ ¦§
¡
£¤¥ ¦§
£¨©¥¥ª £¤¥
¦
¡¦ ¡
«
¦
¢ £¤¥
¬£¤¥ ®
§ ¡
¯
Figure 6. Updated alert-attribute network
sized attack does not mean that the attack must have hap-pened. Instead, it implies that if that attack has happened, it must be successful. Thus, although the confidence val-ues for the two hypothesized nodes are both1, it does not mean that both attacks must have happened. However, com-paring the probability of the path from the initial verified attributes to the later verified attribute (by multiplying the probabilities of all the intermediate nodes along the path), we find that the one through “Modify web page via cmd.exe” has a greater probability than the other one. Al-though it is not what exactly happened in our experiment, it shows that both methods can achieve the goal of modifying web page without being detected, and modifying through established remote cmd.exe shell is simpler and easier com-pared to the other option, which requires several extra attack steps. Also, the probability of a hypothesized node being0
means either it is not missed by the IDS, or it is a failed at-tack attempt.
3.1.3. Using Confidence for Intrusion Detection With the reasoning framework for intrusion evidence, we are able to associate a quantitative measure (i.e., confidence) with each IDS alert. It is natural to think about using the alert confidence values to improve the performance of intrusion detection. In addition, we want to see how additional com-plementary evidence (e.g., verified system attributes) helps
alert name before after relative in-crease FTP command overflow
attempts
0.3 1 233.3%
BACKDOOR BackOri-fice access
0.3 0.6 100%
Shut down Norton An-tivirus via cmd.exe shell (Hypothesized)
N/A 1 N/A
Install BackOrifice In-stance 1 (Hypothesized)
N/A 0 N/A
Install BackOrifice In-stance 2 (Hypothesized)
N/A 1 N/A
Modify web page via cmd.exe shell (Hypothe-sized)
N/A 1 N/A
156 individual SNMP public access udp
0.075 0.075 0%
aggregated SNMP public access udp
0.5 0.5 0%
other 169 alerts 0.25 0 −100%
Table 1. Confidence values before and after the reasoning
in this process.
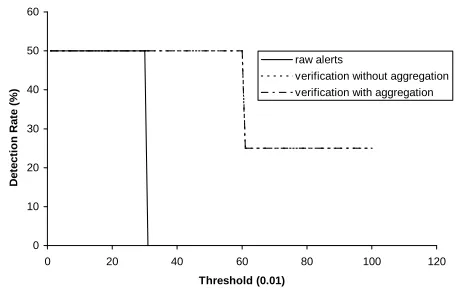
In our experiments, we used a confidence threshold to determine whether an IDS alert is a successful attack or not. Specifically, if the confidence in an alert is greater than or equal to the threshold, we accept the alert. Otherwise, we simply drop it. We change the threshold value between 0 and 1, and collect the detection rates and false alert rates. To compare the results in different situations, we repeated the above process in two cases: (1) without alert aggrega-tion and abstracaggrega-tion, (2) with alert aggregaaggrega-tion and abstrac-tion. The performance graphs for the five attack scenarios are very similar.
In our evaluation, we abuse the notions of detection rate and false alert rate to represent the detection rate of suc-cessful attacks and false alert and failed attack rate, respec-tively. Figure 7 and 8 show the detection rate curves and false alert rate curves w.r.t. different thresholds in all cases for one of our scenarios. Since the meaning of the confi-dence in a hypothesized attack is different from that in an IDS alert, we do not consider hypothesized attacks in this evaluation.
0 10 20 30 40 50 60
0 20 40 60 80 100 120
Threshold (0.01)
D
e
te
c
ti
o
n
R
a
te
(
%
)
raw alerts
verification without aggregation verification with aggregation
Figure 7. Detection rate vs threshold (Sce-nario 0)
0 20 40 60 80 100 120
0 20 40 60 80 100 120
Threshold (0.01)
F
a
ls
e
a
le
rt
r
a
te
(
%
)
raw alerts
verification without aggregation verification with aggregation
Figure 8. False alert rate vs threshold (Sce-nario 0)
alerts based on complementary evidence. Please note that because the largest confidence value of alerts before rea-soning is0.3, the curve of raw alerts only continues to0.3
on thexaxis in Figure 8. No alerts can be detected with a threshold larger than0.3before the reasoning. After the rea-soning, the detection range is also greatly increased, which provides more flexity for making security policies. If we further consider the fact that after the reasoning, we know for sure that three of the four hypothesized attacks must have happened, the framework’s ability to improve detec-tion performance is actually more than what is shown in the figure. The reason the result with aggregation has a higher false alert rate when the probability threshold is over0.3
is because that the 156 false “SNMP public access UDP” alerts are aggregated into one single alert and its prob-ability is greatly increased. Also, the detection rate shown in the figure does not consider the hypothesized attacks, where
2 out of the 4 hypothesized attacks are actual successful at-tacks missed by the IDS, and 1 of the other 2 hypothesized attacks is an actual failed attack attempt.
3.2. Summary of Experimental Results
In the following, we summarize the results obtained from all the five attack scenarios. We first discuss the impact of the proposed techniques on alerts, and then describe the re-sults about hypothesized attacks.
We use a simple metric named confidence ratio to exam-ine the usefulness of the proposed techniques in reasoning about IDS alerts. Specifically, a confidence ratio is the ra-tio between the average confidence of alerts corresponding to successful attacks and the average confidence of the other alerts (i.e., false alerts and alerts corresponding to failed at-tack attempts).
1.807 1.807 1.508 1.807 1.807 22.222
27.778
14
19.833
24.51
0 5 10 15 20 25 30
Scenario 0 Scenario 1 Scenario 2 Scenario 3 Scenario 4
C
o
n
fi
d
e
n
c
e
R
a
ti
o
Before reasoning After reasoning
Figure 9. Confidence ratio before and after the reasoning
Figure 9 shows the confidence ratios in all five attack sce-narios before and after using the proposed techniques. (We have discussed Scenario 0 in the previous subsection; de-tails of the other scenarios can be found in the appendix.) These results indicate that with the proposed techniques, the average confidence in alerts of successful attacks are greatly increased compared with the average confidence in the other alerts (false alerts and alerts for failed attack at-tempts). In fact, the average confidence in the other alerts either remain the same or decrease.
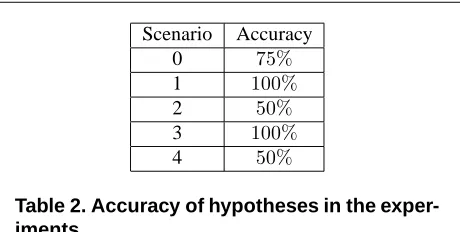
We totally made ten hypotheses during the reasoning in the analysis of the five attack scenarios. Table 2 shows the accuracy of these hypotheses in these attack scenarios, re-spectively.
Scenario Accuracy
0 75%
1 100%
2 50%
3 100%
4 50%
Table 2. Accuracy of hypotheses in the exper-iments
out of the other 4 hypotheses is an actual failed attack at-tempt. Among the seven real attacks, we have definite con-fidence that four of them must have happened from the alert-attribute network. The result shows that with sufficient local system evidence, our model is efficient and effective in dis-covering some missed attacks.
4. Related Work
The techniques closest to ours are M2D2 [23] and the mission-impact-based correlation method [26], which have been briefly discussed in the introduction. All these meth-ods, including the techniques proposed in this paper, at-tempt to correlate intrusion evidence from multiple sources. However, M2D2 is intended to provide a formal model to represent intrusion related information, while the mission-impact-based method requires substantial human involve-ment in the specification of correlation models. In con-trast, our method can automatically construct Bayesian net-works of IDS alerts and other complementary intrusion ev-idence based on the knowledge of individual attacks, and harness the rich results developed for reasoning about un-certain events.
Another approach was proposed in [25] to make hy-potheses about missed attacks based on the pre/post-conditions of known attacks. Our approach differs in that the hypotheses made in our model is based on not only the pre/post-conditions of known attacks but also the avail-able system states.
The techniques proposed in [9, 24, 32] are also based on modeling individual attacks, similar to ours. However, these approaches only focus on IDS alerts, but do not take advantage of other information sources. Our approach can potentially get more concrete analysis results due to the additional, complementary information considered in our model.
There are other alert correlation techniques. The tech-niques in [8, 12, 30, 33] correlate alerts on the basis of the similarities between the alert attributes. The Tivoli approach correlates alerts based on the observation that some alerts usually occur in sequence [14]. The alert clustering
tech-niques in [20, 21] use conceptual clustering and general-ization hierarchy to aggregate alerts into clusters. It is pro-posed in [27] to use time series analysis to discover potential causality between alerts without specifically modeling at-tacks. Alert correlation may also be performed by matching attack scenarios specified by attack languages. Examples of such languages include STATL [15], LAMBDA [10], and JIGSAW [32]. These methods use mechanisms differ-ent from ours to correlate alerts, and are potdiffer-entially com-plementary to our approach. It may be possible to improve some of these approaches to support complementary intru-sion evidence. However, we do not consider it in this pa-per.
Our approach is also related to the recent results on vul-nerability analysis (e.g., [6, 19, 29]). In particular, the meth-ods in [6, 29] also model system state as system attributes, and attacks atomic transformation that establish postcon-ditions given the attacks’ preconpostcon-ditions. However, our ap-proach is aimed at reasoning about intrusion evidence rather than finding out possible sequences of attacks.
5. Conclusion and Future Work
neces-sary for attackers to gain related information to launch some corresponding expolits. However, the effect of such infor-mation gathering activities is on the remote attackers’ side, which cannot be predicted and be used as preconditions of attacks. Information can be gathered in multiple ways other than network scans, e.g., chatting with a careless adminis-trator or wiretapping the telephone. Thus, such attacks will not appear in the alert-attribute Bayesian network so that the reasoning will not affect and be affected by such alerts. In-formation of such alerts is usually useful for human admin-istrators in analyzing the attacker’s intentions and strategies in realworld. For example, people may have a higher be-lief on alerts of follow-up attacks after monitored probes on some special ports. However, modeling this observation brings risk of being distracted by forged traffic from attack-ers.
This paper is only the starting point of our effort to inte-grate and reason about complementary intrusion evidence. In our future work, we will investigate additional techniques to improve the performance. In particular, we will study the use of dynamical Bayesian networks in processing streams of IDS alerts and other intrusion evidence, investigate ap-proaches to handling attacks missed by IDSs, and perform experiments with large sets of intrusion evidence.
References
[1] checkrootkit. http://www.checkrootkit.org.
Ac-cessed on Feb. 4, 2004.
[2] Javabayes. http://www-2.cs.cmu.edu/
∼javabayes/Home/. Accessed on Oct 10, 2003.
[3] Nessus. http://www.nessus.org. Accessed on Feb.
4, 2004.
[4] Samhain. http://la-samhna.de/samhain/.
Ac-cessed on April 4, 2004.
[5] Tripwire. http://www.tripwire.com. Accessed on
Feb. 4, 2004.
[6] P. Ammann, D. Wijesekera, and S. Kaushik. Scalable, graph-based network vulnerability analysis. In Proceedings of the 9th ACM Conference on Computer and Communications Se-curity, pages 217–224, November 2002.
[7] G. F. Cooper. The computational complexity of probabilis-tic inference using bayesian belief networks. Artificial Intel-ligence, 42:393–405, 1990.
[8] F. Cuppens. Managing alerts in a multi-intrusion detection environment. In Proceedings of the 17th Annual Computer Security Applications Conference, December 2001. [9] F. Cuppens and A. Miege. Alert correlation in a cooperative
intrusion detection framework. In Proceedings of the 2002 IEEE Symposium on Security and Privacy, May 2002. [10] F. Cuppens and R. Ortalo. LAMBDA: A language to model
a database for detection of attacks. In Proc. of Recent Ad-vances in Intrusion Detection (RAID 2000), pages 197–216, September 2000.
[11] P. Dagum and M. Luby. Approximating probabilistic infer-ence in bayesian belief networks is NP-hard. Artificial Intel-ligence, 60:141–153, 1993.
[12] O. Dain and R.K. Cunningham. Building scenarios from a heterogeneous alert stream. In Proceedings of the 2001 IEEE Workshop on Information Assurance and Security, pages 231–235, June 2001.
[13] O. Dain and R.K. Cunningham. Fusing a heterogeneous
alert stream into scenarios. In Proceedings of the 2001 ACM Workshop on Data Mining for Security Applications, pages 1–13, November 2001.
[14] H. Debar and A. Wespi. Aggregation and correlation of
intrusion-detection alerts. In Recent Advances in Intrusion Detection, LNCS 2212, pages 85 – 103, 2001.
[15] S.T. Eckmann, G. Vigna, and R.A. Kemmerer. STATL: An Attack Language for State-based Intrusion Detection. Jour-nal of Computer Security, 10(1/2):71–104, 2002.
[16] D. Farmer and W. Venema. SATAN: Security administrator
tool for analyzing networks. http://142.3.223.54/
∼short/SECURITY/satan.html.
[17] Fyodor. Nmap free security scanner. http://www.
insecure.org/nmap, 2003.
[18] F.V. Jensen. Bayesian Networks and Decision Graphs.
Statistics for Engineering and Information Science. Springer, 2001.
[19] S. Jha, O. Sheyner, and J.M. Wing. Two formal analyses of attack graphs. In Proceedings of the 15th Computer Security Foundation Workshop, June 2002.
[20] K. Julisch. Mining alarm clusters to improve alarm handling efficiency. In Proceedings of the 17th Annual Computer Se-curity Applications Conference (ACSAC), pages 12–21, De-cember 2001.
[21] K. Julisch and M. Dacier. Mining intrusion detection alarms for actionable knowledge. In The 8th ACM International Conference on Knowledge Discovery and Data Mining, July 2002.
[22] MIT Lincoln Lab. 1999 DARPA intrusion detection scenario
specific datasets. http://www.ll.mit.edu/IST/
ideval/data/1999/1999 data index.html, 1999.
[23] B. Morin, L. M´e, H. Debar, and M. Ducass´e. M2D2: A for-mal data model for IDS alert correlation. In Proceedings of the 5th International Symposium on Recent Advances in In-trusion Detection (RAID 2002), pages 115–137, 2002. [24] P. Ning, Y. Cui, and D. S Reeves. Constructing attack
sce-narios through correlation of intrusion alerts. In Proceedings of the 9th ACM Conference on Computer and Communica-tions Security, pages 245–254, Washington, D.C., November 2002.
[25] P. Ning, D. Xu, C. Healey, and R. St. Amant. Building at-tack scenarios through integration of complementary alert
correlation methods. In Proceedings of the 11th Annual
Network and Distributed System Security Symposium (NDSS ’04), pages 97–111, February 2004.
[27] X. Qin and W. Lee. Statistical causality analysis of infosec alert data. In Proceedings of The 6th International Sym-posium on Recent Advances in Intrusion Detection (RAID 2003), Pittsburgh, PA, September 2003.
[28] M. Roesch. Snort - lightweight intrusion detection for net-works. In Proceedings of the 1999 USENIX LISA confer-ence, 1999.
[29] O. Sheyner, J. Haines, S. Jha, R. Lippmann, and J.M. Wing. Automated generation and analysis of attack graphs. In Pro-ceedings of IEEE Symposium on Security and Privacy, May 2002.
[30] S. Staniford, J.A. Hoagland, and J.M. McAlerney. Practical automated detection of stealthy portscans. Journal of Com-puter Security, 10(1/2):105–136, 2002.
[31] Tauscan. http://www.agnitum.com/products/
tauscan/.
[32] S. Templeton and K. Levitt. A requires/provides model for computer attacks. In Proceedings of New Security Paradigms Workshop, pages 31 – 38. ACM Press, September 2000. [33] A. Valdes and K. Skinner. Probabilistic alert correlation. In
Proceedings of the 4th International Symposium on Recent Advances in Intrusion Detection (RAID 2001), pages 54–68, 2001.
[34] X-scan.http://www.xfocus.org.
Additional Attack Scenarios Used in Our
Ex-periments
Results about Scenario 0 has been discussed in the main text. Here we give further detaisl about the experimental re-sults for the remaining scenarios.
.1. Scenario 1
This scenario is fairly simple. We simulated a common scriptkid’s activity, which exploits a common vulnerabil-ity to get certain privilege, and modify the remote server’s web page. In this particular scenario, we exploited the for-mat string vulnerability of wu-ftpd 2.6.0 on a RedHat linux 6.2 server to get remote root access. The attack scenario in-cludes two steps:
1. A remote format string attack toward the wu-ftpd, and
2. replacing the remote server’s web page with a “Gotcha” web page via the remote root shell ac-cess gained after the previous attack.
Snort raised the following alert(s):
• 1 FTP EXPLOIT wu-ftpd 2.6.0 site exec format string overflow Linux
Note that no alerts were raised for the remote root shell access. The file system monitoring tool (Samhain) gener-ated alert for the web page modification since we config-ured the threshold on the times of modifications on those files to be1.
°±²³´µ¶·¸¹¸º »±¼¼½¼¾±¼¶¿ » »ÀÀ
´
ÁÂÃÄÅÃÆÇÈÂɱ²³´µ¶·¸¹¸º Ê
½´¿¿Ë¿Ì³ À»ÍÎ
´ Ê
´ »
½¼¾ ÀÏ
¿ »
³Ð À
É Æ½¼±Ë
Ñ ÀÀ
´ ÊÒ
¿ÐÐ Î
ÌÌ¿ ÊÊ
°¿Óµ Î
¾¿³½Ð¿ ÍÀ
¶½³½¿¶ Ô¼
À ¼Õ
ÍÀ ±
Ê ³´µ Î
ÌÌ¿ ÊÊ
Ö×¹ØÙÚõ±ÓÐ½Ì ±¶µ
Πп»´Ê
¾ Î
½¼µ±ÓÐ½Ì ÒÀÊ
´ ½¼³À
»Í δ½À¼ ØÙÚõ±ÓнÌ
Î ÌÌ¿
ÊÊ
ÛÛÛ
Figure 10. Initial alert-attribute network
Initial vulnerability scan showed that the system was running a vulnerable wu-ftpd 2.6.0 on port 21 with anony-mous access open. However, we are not sure about whether the SNMP public access is turned off because we did not check the SNMP options in Nessus.
The result alert-attribute network before making hy-potheses is as shown in Figure 10.
Based on the observation of the inconsistency in the alert-attribute network shown in Figure /reffig:wuattack0, together with the attack type knowledge, the only possi-ble hypothesis to fill in the inconsistency is that some re-mote control via the root shell caused the web page modifi-cation. Thus, the complete alert-attribute network is shown as in Figure 11.
We use dotted nodes and edges to denote hypothesized nodes and relationships in this new figure of alert-attribute network.
According to the prior probability values and attack type information included in appendix B, our program generated the Bayesian network from the evidence log automatically and the reasoning result using JavaBayes is shown in table 3. Table 3 also shows the relative increase of the confidence values of the alerts.
The confidence in the only hypothesized attack “Remote control via root shell” turned to1after the inference, which indicates that it would be successful and missed by the snort if it happened.
ÜÝÞßàáâãäåäæ ç ÝèèéèêÝèâë ç çìì à íîï ðñïòóôîõÝÞßàáâãäåäæ ö éàëë÷ëøßì çùú à ö àçéèê ìû ë ç ßü ì õ òéèÝ÷ ý ìì à öþ ëüü ú øøë öö Üëÿá ú êëßéüë ùì âéßéëâ è ì è ùì Ý ö ßàá ú øøë öö ì âéßõëÿá ú êë û é úçìì à öþ ëüü åï áÝÿüéø ú øøë öö Ýâá ú éèáÝÿüéø þìö à éèß ìçùú àé ì è ïáÝÿüéø ú øøë öö
Figure 11. Alert-attribute network after hy-potheses
alert name before rea- son-ing after rea-soning relative in-crease
156 SNMP public access udp(156)
0.075 0.075 0
Aggregated SNMP public ac-cess udp
0.5 0.5 0
FTP SITE EXEC format string at-tempt linux
0.3 1.0 333.33%
Remote con-trol via root shell (hypothe-sized)
N/A 1.0 N/A
Other alerts 0.25 0 −100%
Table 3. Confidence values before and after the reasoning
.2. Scenario 2
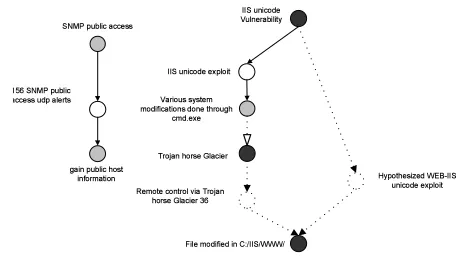
This attack scenario exploits the unicode vulnerability of MS IIS 5.0. The victim machine was a windows box con-figured to be running a vulnerable IIS 5.0. The initial sys-tem vulnerability scan showed that there existedIIS 5.0 unicodevulnerability on the victim. The attacks scenario
DR 0 10 20 30 40 50 60
0 20 40 60 80 100 120
Threshold (%) D e te c ti o n R a te ( % ) raw alerts
verification without aggregation verification with aggregation
Figure 12. Detection rate VS. threshold (Sce-nario 1) FAR 0 20 40 60 80 100 120
0 20 40 60 80 100 120
Threshold (%) F a ls e a le rt r a te ( % ) raw alerts
verification without aggregation verification with aggregation
Figure 13. False alert rate VS. threshold (Sce-nario 1)
includes two steps:
1. Exploiting the unicode vulnerability to download and install a Trojan horse namedGlacierto the victim
2. Monitoring/controlling the victim file system remotely through the Trojan horse. The activities include replac-ing the web page
When the above attacks were launched without back-ground traffic, Snort generated the following 6 alerts:
• 2 WEB-IIS unicode directory traversal attemp alerts, and
• 4 WEB-IIS cmd.exe access alerts.