Further Examples of Evolution
by
Gene Duplication Revealed Through
DNA
Sequence Comparisons
Tomoko Ohta
National Institute of Genetics, Mishima 4 1 1 , Japan
Manuscript received March 29, 1994 Accepted for publication August 22, 1994
ABSTRACT
To test the theory that evolution by gene duplication occurs as a result of positive Darwinian selection
that accompanies the acceleration of mutant substitutions, DNA sequences of recent duplication were
analyzed by estimating the numbers of synonymous and nonsynonymous substitutions. For the troponin
C family, at the period of differentiation of the fast and slow isoforms, amino acid substitutions were shown
to have been accelerated relative to synonymous substitutions. Comparison of the first exon of a-actin
genes revealed that amino acid substitutions were accelerated when the smooth muscle, skeletal and
cardiac isoforms differentiated. Analysis of members of the heat shock protein 70 gene family of mammals
indicates that heat shock responsive genes including duplicated copies are evolving rapidly, contrary to
the cognitive genes which have been evolutionarily conservative. For the qantitrypsin reactive center, the
acceleration of amino acid substitution has been found for gene pairs of recent duplication.
E
VOLUTION by gene duplication has now beenwidely accepted as an important phenomenon (OHNO 1970; OHTA 1980). Based on theoretical study, I
suggested that positive Darwinian selection is needed for
acquiring a gene with a modified function, whereas genes whose function has been fixed for a long time
evolve mostly through random genetic drift (OHTA
1988). There are now several examples that are com-
patible with the above theory, stomach lysozyme (IRWIN
and WILSON 1990), visual pigment genes (YOKOYAMA and YOKOYAMA 1990), homeobox family (KAPPEN et al. 1989),
hemoglobin y (FITCH et al. 1991), alcohol dehydrogenase
( LDNC and LANGLEY 1993), ion channel family (STRONG et al.
1993) and growth hormone family (OHTA 1993; WALLIS 1993). There are other examples of accelerated amino acid substitution connected to duplication, in which the un-
derlying mechanism is not obvious
(L
1985).To examine the mechanisms of evolution by gene du- plication, it is desirable to clarify the pattern of nucle- otide substitutions of recently duplicated genes, because old differentiation is masked by subsequent nucleotide substitutions and therefore often undetectable. Espe-
cially if one wants to determine the relative numbers of
synonymous and nonsynonymous substitutions among duplicated genes, the former may be saturated by old duplication, and a reliable estimate cannot be obtained. What do the relative numbers of synonymous and nonsynonymous substitutions tell us? Because most of synonymous substitutions are thought to be selectively neutral in mammals, they accumulate by mutation rate
(KIMURA 1983). If nonsynonymous substitutions show a different pattern, selection should be responsible for
the pattern. It may be argued that the different pattern
simply reflects change in selective constraint and does
Genetics 138: 1331-1337 (December, 1994)
not show the positive selection. In fact, it is customary to suppose that positive selection is detectable only when the number of nonsynonymous substitutions exceeds
that of synonymous substitutions (HUGHES and NEI
1988). Although the explanation by changing con- straints cannot be completely denied, the operation of
positive selection is a more natural interpretation, if the
acceleration of amino acid substitutions is detected in conjunction with functional differentiation.
The data for nucleotide sequences in the gene fami-
lies of troponin C, a-actin, heat shock protein and anti-
trypsin include those of some recently duplicated genes with distinct functions. The pattern of synonymous and nonsynonymous nucleotide substitutions of such se- quences were examined. Nonsynonymous substitutions were shown to be accelerated in conjunction with func- tional differentiation.
DATA ANALYSIS
Nucleotide sequences were obtained from the genetic databases maintained at the National Institute of Ge-
netics, which include GenBank, DDBJ (DNA Databank
of Japan), and EMBL. Five sequences of troponin C,
nine sequences of a-actin, 8 sequences of heat shock
protein 70 and 10 sequences of a,-antitrypsin were used.
For the acquisition and analysis of the data, the ODEN
Package created by INA (1992) was used. The numbers
of synonymous and nonsynonymous substitutions were
estimated using the method of NEI and GOJOBORI (1986)
which is in the ODEN Package. This method divides nucleotide substitutions into synonymous and nonsyn- onymous categories, and then the multiple hit is esti- mated under the assumption of random mutability
1332 T. Ohm
TABLE 1
The number of synonymous substitutions (upper figures) and that of nonsynonymous substitutions (lower f i s ) per 100 sites among troponin C genes of human, mouse and rabbit
Slow troponin C Fast troponin C
MUSCTNCA HUMTNCS MUSFSTCG RABTNC HUMTC2
Slow MUSCTNCA 70.37 2 13.27 236.29 2 11 1.07 108.81 2 22.26 107.35 2 21.89
40.62 2 7.75 189.51 2 143.94 111.862 31.00 109.53 2 30.33
HUMTNCS 155.73 % 39.75 94.25 2 18.35 76.57 2 14.55
0.30 % 0.?0 1 3 4 . 1 4 % 46.92 90.25 2 20.84 8 4 . 3 7 % 18.45
Fast MUSFSTCG 26.10 % 2.99 25.35 % 2.94 70.80 2 13.37 77.11 2 14.62
27.78 2 3.20 26.55 2 3.09 42.27 2 8.03 43.38 2 8.41
RABTNC 26.37 2 3.02 25.62 5 2.96 0.26 2 0.26 28.92 2 6.56
26.80 % 3.07 26.21 2 3.04 0.30 2 0.30 19.97 2 4.52
HUMTCZ 26.16 2 3.00 25.35 t 2.94 0.52 2 0.37
26.65 2 3.06 25.172 2.92 0.61 2 0.43 0.29 2 0.29
The Roman figures were obtained using the method of NEI-GOIOBORI (1986) and the italic figures, with that of INA (1994). As for the accession number and the-data source, see
APPENDIX.
estimate was calculated using the method Of KIMURA and
OHTA (1972) which is also in the ODEN Package.
Since the assumption of random base substitution is
often not satisfied, the method of NEI-GOJOBORI is not
quite satisfactory. INA (1994) invented a new method
which brings KIMURA’S two-parameter model into the
NEI-GOJOBORI method. Through extensive simulations,
INA has shown that his method usually gives a better es-
timate than that of NEI-GOJOBORI, and his method has
been used in this study. On the other hand, LI’S (1993)
new method, which gives a similar estimate to INA’S, has
turned out to be often inapplicable for the present data sets and is not used here. For the present purpose of
finding the acceleration of nonsynonymous substitu-
tions in conjunction with functional differentiation, an analysis using the two methods gives satisfactory results.
In INA’S method, the ratio of transition to transversion
is estimated from the third position of codons, and the estimated value is used for calculating the numbers of synonymous and nonsynonymous substitutions. When
the sequence used was short, Le., less than 150 nucle-
otide sites, the ratio was estimated beforehand, by using the larger region that includes the sequence.
RESULTS OF ANALYSES
Troponin
C
gene family Troponin C is a protein that regulates excitation-contraction coupling in heart and skeletal muscle. In mammals, two distinct isoforms of this protein have been identified, the fast and the slow types, which are encoded by homologous but differentgenes (DHOOT and PERRY 1979). DNA sequences of both
genes in mouse and man were available and analyzed.
Table 1 shows the results. The upper figures are the
estimated number of synonymous substitutions with a standard error per 100 sites, and the lower figures, that
of nonsynonymous substitutions. The Roman figures
were calculated using the method of NEI-GOJOBORI, and
the italic figures, with that of INA. Note that the estimated
values by the two methods considerably differ in some se-
quence pairs, but are very similar in other pairs. This is
because the difference of the estimated values depends on
the magnitude of bias in transition-transversion ratio. For
details of such effects, see INA (1994).
A striking pattern was found; the number of nonsyn- onymous substitutions relative to that of synonymous substitutions was much smaller for the slow-slow and for the fast-fast comparisons than for the slow-fast compari- sons. In other words, amino acid substitution must have
been accelerated during the period of differentiation of
the slow and the fast troponins, and then was slowed
down subsequently. According to PARMACEK et al.
(1990), the divergence between the two forms of tro-
ponin C is associated with their functional differentia-
tion. This statement has now been expanded so that
functional differentiation is associated with rapid amino acid substitution. In this process, positive Darwinian se- lection is the most likely cause of the acceleration.
a-Actin genes: Actin is the most abundant of the cyto- skeletal proteins. Actin genes form a highly conserved
family in eucaryote genomes. Several isoforms of a-actin
are known such as skeletal, cardiac and smooth muscle
types (Hu et al. 1986). By comparing sequences of these
isoforms, it is found that about half of the nonsynony- mous substitutions are within the first exon that is only
about
12%
of the protein. It has also been reported thatthe amino terminus (first exon) is the site of major actin-
myosin interactions (SUTOH 1982). Thus, it is likely that
the functional differentiation among the isoforms, if any, may be revealed by the first exon sequence. In the following, the result of sequence analysis of the first exon is presented.
In Table
2,
the estimated numbers of synonymous andnonsynonymous substitutions are given as before. Again,
El
$
bc) - 9
ct
d
b %
g s
s5
@
2;
&?
Z?
$ 7a 5 k
v\
2
:
s mZ h
g * mj+ 66 46
g
’i
$$
0 - m s O O P - s
$
E
+I +I $ 1 t I tl tl +I tl
t;
s
gg
~2
$:
$ 2
3
q m e - m u * h
(1 % r y -
z
8
b an, m r y a - an,F 2
2R g!
5 %
2
o s W h 4- m v \
5
ti
tl t I tl + I $ 1 tl +I t I5 a . - 4 et. m m
.s
0
g
M
x
g s
$ 5
2
:
$
rl
2: = s
2 5
f m4 .
E
o m -ru P-h m y
2
q2
$ 2
s
n2
Hv
g
3
Z $ g ! $ E
5
i;:
i
Zh
2 0
= sSt-.
E
5
k v )
m h Go- *n, m -
5
3
0
m r y a n , bn, m r y
3
i
3
$
s2
z g
$
.-
u)
2;
$ 2
2;
2
:
z
E m 0 m h m - 0- + w cj+ bn, uim r y +I tl t I +I t I +I t I tl
3
m u \ = s 2 s
Zh
B
(1
t i 0
& *
< +
4’9.-
+I tl +I tl tl $ 1 + I +Is
0 6 a h on; ery dod m n , - 6 m m1
-
o m
% 2
$
a! c?3
=
g : b & 2: 0 62
4
-
z
E
tl +I $ 1 t I $ 1I
t II
v
c
s
(1
il
d
$ 2 6
4
2
2
a b Z Z $ 8
B
2
v) 2 Ee,
si2
o s2 2
g s
23;$
dl’ & P t i s
m r y m w m - +I tl $ 1 tl t I tl
m h P-s bl
i q v \
d.”
“ 0g $
s ;
z $
g x
g14
2 %
d s &a‘ & “
m - m - m -
tl +I tl +I tl + I
bv\ m o m s
o u m w P-s P-iD 66 00- & v ;
W e
w \ om -
iq?
- e
g ;
2 6
1
tI t I tl tl /
E:
.:/
o r ; & <
22
/
t ” d m v \
G
/
0 0
sg
1
1
/
O 0 O 02 g
x g
g ? T
8..
O Ogry \&n, m j n ; tin;
+I tI $ 1 +I $ 1 +I m u 3 0 o s
m q - s - h
dr; 6 6 mod
s P P
89
2- 2-
ti6 & n ; m j n ;
m o v - C O P
t I $ 1 tl t l +I tl o s “ 0 “ 0
mod m 6 m e
1 1
2 %
s;
30%
Din; m j n ; m j n ; +I t l +I +I tI +I m m m v N Q P ? 1% 1% a h m s m s
p $
e - - 0Oin; m n , m n , s ? s ? m m m w m h l
t I +I $ 1 +I t l $ 1
rnq - s - s
dt; 056 W Q j
$ g m
0$ 3 2
Z E
2
-
Y
v)z ?
5 2
P - r y
$ 1 tl
zf
2:
/
6;
- 1m m 6 s
tl t I t I t I
m r y a -
2:
2:
+ ? - -!g
*n;
“n,
@
3 ?
<ry - 1
tI $ 1 + I t I
c o n , a - + ? - -!g
G o n ; m n ,
m o b s
2: 2:
$ 1 +I +I tl m ? a -*. P *. P
G o n ; c o n ;
s;
2 2
m j n ; &n;
c o n , +I tl m - +I tl
1 s ” ?
mod m o
1
e -
mj? Bin,
m v \ P I W
ti $ 1 ti t I
o?
8$
1% soq mod m s
m w 0 -
2: 2:
2&
g z &,-& & &m w 0 -
5
d
5
s ? s ?
mn, m n , E $ 1 +I $ 1 +I
‘3
2 & g z c ad6 W o dz
5
5c
tl t I tl t I
-
b s ;
n
2
5
8
.-
Z Z Z
E
% e,
1334 T. Ohm
TABLE 3
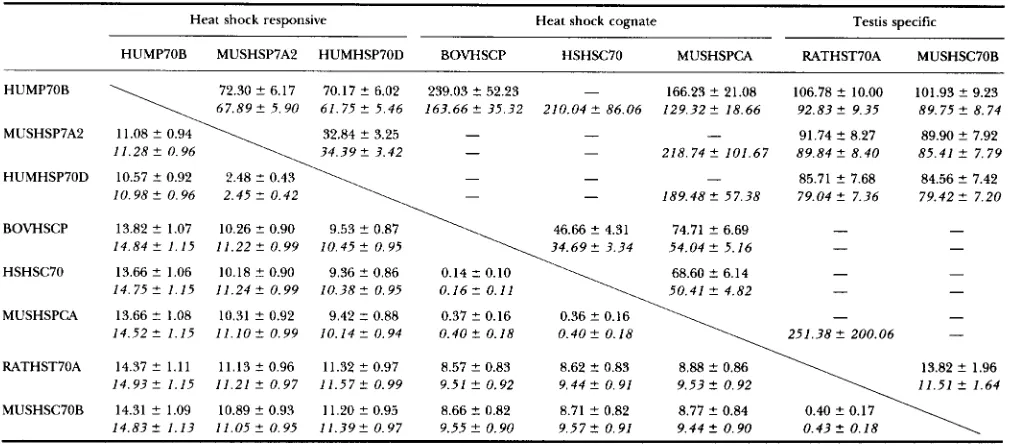
The number of synonymous substitutions (upper f i v e s ) and that of nonsynonymous substitutions (lower f i i s ) per 100 sites among gene members of HSP70 family
Heat shock responsive Heat shock cognate Testis specific
HUMP70B MUSHSP7A2 HUMHSP70D BOVHSCP HSHSC70 MUSHSPCA RATHST7OA MUSHSC70B
HUMP70B 72.30 2 6.17 70.17 2 6.02 239.03 5 52.23 - 166.23 2 21.08 106.78 C 10.00 101.93 2 9.23 67.892 5.90 61.75 2 5.46 163.662 35.32 210.042 86.06 1 2 9 . 3 2 2 1 8 . 6 6 92.833- 9.35 89.75 2 8.74
MUSHSP7A2 11.08 2 0.94 32.84 2 3.25 - - -
34.39 2 3.42
91.74 3- 8.27 89.90 2 7.92 - - 218.74 2 101.67 89.84 2 8.40 85.41 2 7.79
85.71 2 7.68 84.56 3- 7.42
10.98 2 0.96 2.45 2 0.42 189.48 3- 57.38 79.042 7.36 79.42 2 7.20
1 1 . 2 8 2 0.96
BOVHSCP 13.82 2 1.07 10.26 2 0.90 9.53 C 0.87 46.66 2 4.31 74.71 2 6.69 - -
14.84 C 1.15 11.22 2 0.99 10.452 0.95
HSHSC70 13.66 2 1.06 10.18 5 0.90 9.36 2 0.86 0.14 C 0.10 68.60 C 6.14 1 4 . 7 5 2 1.15 1 1 . 2 4 2 1 0 . 3 8 C 0 . 1 6 2 0 . 9 9 0 . 9 5 0.11 50.41 2 4.82
- -
- -
MUSHSPCA 13.66 C 1.08 10.31 2 0.92 9.42 2 0.88 0.37 C 0.16 0.36 2 0.16
1 4 . 5 2 5 1.15 1 1 . 1 0 2 0.99 1 0 . 1 4 2 0.94 0 . 4 0 5 0.18 0.402 0.18 251.38 2 200.06
RATHST70A 14.37 2 1 . 1 1 11.13 2 0.96 11.32 C 0.97 8.57 2 0.83 8.62 3- 0.83 8.88 C 0.86 13.82 2 1.96 1 4 . 9 3 2 1.15 11.21 3- 0.97 1 1 . 5 7 2 0.99 9.512 0.92 9.442 0.91 9.53 2 0.92 11.51 C 1.64
- -
-
MUSHSC70B 14.31 C 1.09 10.89 2 0.93 11.20 2 0.95 8.66 3- 0.82 8.71 2 0.82 8.77 2 0.84
1 4 . 8 3 2 1 . 1 3 1 1 . 0 5 C 0 . 9 5 1 1 . 3 9 2 0 . 9 7 9 . 5 5 2 0 . 9 0 9 . 5 7 2 0 . 9 1 9.44 2 0.90 0.43 2 0.18 See Table 1 . Dashes indicate unestimable cases.
that of synonymous substitutions is smaller for the same-
isoform comparisons than for the different-isoform comparisons. In fact, for most of the within-isoform comparisons, no nonsynonymous substitution is ob- served. Both of two exceptions, HSACT-OCRNAASMA pair of the smooth muscle actin and HUMACTCAl- MUSACTCA5 pair of the cardiac actin, are caused by a
two-step change of a codon, and there is no amino acid
difference. Note that, in counting the numbers of syn- onymous and nonsynonymous substitutions, all possible paths are equally weighted for multiple-step changes of
a codon in the NEI-GOJOBOIU and the INA methods. Thus,
it is likely that there is no amino acid substitution among
the same-isoform sequences. As for the different-isoform
comparisons, there are 3-8.5 nonsynonymous differ-
ences that result in amino acid differences. Actually, the skeletal actin and the cardiac actin are coexpressed and
their tissue specificity is not complete (GUNNING et al.
1983). The amino acid difference between the two iso- forms is smaller than that between the smooth muscle actin and skeletal or cardiac actin. The amino acid divergence seems to correlate well with the tissue specificity. The es- timated numbers of synonymous and nonsynonymous s u b stitutions have large standard errors because of the short
region counted, and statistical significance can not be o b
tained for the differences of the ratio of the nonsynony-
mous to the synonymous substitutions. However, the ten-
dency is clear, and it is likely that some amino acid
substitutions have been caused by the functional differen- tiation of binding with the tissue specific myosin.
Heat shock protein 70 gene family: Heat shock in- duces several kinds of proteins in most organisms, among which heat shock protein (hsp) 70 is the fore-
most. In mammals, this protein is encoded by a multi-
gene family (LINDQUIST 1986), and several DNA se-
quences of mammals are available. The multigene family includes heat shock responsive and nonrespon- sive genes, and the latter participates in regulation of
ordinary cell growth (PELHAM 1986; GIEBEL et al. 1988).
DNA sequences of hsp70 genes of several mammalian
species were analyzed; three sequences of the heat shock
responsive gene, three sequences of the heat shock cog-
nate gene and two sequences of the testis-specific gene.
Table 3 presents the results. As before, the upper figures
are the estimated number with standard error of syn- onymous substitutions and the lower figures, that of
nonsynonymous substitutions per 100 sites. A dash in-
dicates the inestimable case. Again, the relative values of
nonsynonymous and synonymous substitution numbers
show an interesting pattern. Namely, the number of
nonsynonymous substitutions relative to that of synony- mous ones is quite small for comparisons within the cog-
nate or within the testis-specific group, but it is not so for
comparisons among heat-shock-inducible genes and for comparisons between heat-shock-inducible and testis- specific genes. The cognate group appears to be too divergent from the other groups to get a reliable esti- mate of the number of synonymous substitutions.
Sequence divergence within the heatshock-inducible group needs more detailed examination. Note that the two human sequences of this group are the product of gene duplication which occurred before the human-mouse di- vergence, and HUMHSP70D is orthologous to the mouse gene. It can be seen that the number of nonsynonymous
substitutions relative to that of synonymous ones is smaller
1335
25
g
2 2
5
R " rs
2
5 :
3 - 9
z
RYjI I I I
r-q
2 2
+I t I
m y -
t??
2 5
I I I I
q ?
S T
t I 1.1- 0
m 9
a56
z -
$
$ %
q
:
E
+I tI
z ?
S %
t l +I
$ 3
2 s
1
c)
IC
r-"
m m 3 0 0 0 g c yr-?
m ?su,
3
:
m21
0s
3
3
bv, 0 1 & v \ - 0 603 miwt I t I tl tl tl tl $ 1 +I ti +I $ 1 +I +I $ 1 m w w q my- 3 1 - 9 wv,
$ 2
tl tl t I $ 1
$ 1 +I tI t I +I ti
r-hl o w m o
dv, * m * w
rrjd c i j d mic\i
~9 m m m m
+I +I +I $1 +I +I ti +I
r-u, m 1 ov, w w m m 9 0 9 - m w
Id&
eo<
El$ w < "1 @ J w m u , m y ,tl +I +I +I tl tI $ 1 +I $ 1 +I
r - w
*'s
- 1 w 9 m s- w @ah r r v , 100 w w
@Jhl m 9 u, r-P, a m 4 6 a56 r-& Od 0 6
gG
$ 2
% %2 s
g 2 % %
rrj$ R * 6 6 R < 6 & -;jd
@J"r @ J w
*-+
r - w m ms x $ ? s %
g 2
T 1 l.9 y " * h T ? r - hb.& wm.
rrj<
s & 0 - m u m w0 . d & R , j
21'
rrj& CdG G 6 Y jm z w r y - 1 w corn, my, m v , 3 1 - 1 3 1
ti tl +I +I +I $ 1 tl $ 1 +I +I tl tl +I ti
- 0 r-1 mc9 o w mcm m u , 3 0
r D v , m v , - h
*n\
m " r m w m y -tl +I t I +I t I $ 1 t I +I ti ti tl t I +I +I $ 1 +I
g;
;a
Z E G 2
$ 2
% a s %
$ 2
2 ' , 1 g " 9 0; Ncy d & % $ - 1 w % *
$ $
$ 2
B
5
$
%
S
&
Z Z Z Z Z Z
2
8
5 Z E E E E
2 3 5
g g g z 3 g
s
q
L
5 2
mu,
+I ti
O N
O Y j
mu,
z x
5 %
+I ti
mv,
O m
* v
rrjd
g 2
C;;K
8?
5 :
a56 tl $ 1W q
@ J w
m
+I tl rrhl
T 9
- 6
m y ,
$
3hl
$ 1 +I
Woo\ 3 1
m n \
& <
*p.
2 ?
s:
G $
% ?
2:
w
+I tl
O h m m
tl +I m h l
m u ,
s
m'% ?
d
3
2
:
s+I tl
-2
b o E
l o w
dYj
.$
m v ,3
i??
,5
& 6
a
$ 1 tl 5
% $
z
G 6
3 v,W
" r c )
-
$ 2
a w
s g
1336 T. Ohta
between paralogous comparisons. The difference in rela-
tive values is statistically significant. Thus the general pat-
tern of the rapid amino acid divergence in connection with
functional differentiation is observed for the hsp70 gene family.
a,-Antitrypsin gene
family:
Proteases and their in- hibitors are encoded by gene families in mammals. For- tunately, some of their tertiary structures have been ana- lyzed, and the regions of the reactive center have been determined. Because of the hypervariability of amino acids at the reactive center, it has been proposed that positive natural selection has operated to increase therate of amino acid substitutions (LASKOWSKI et al. 1987;
HILL
and HASTIE 1987). Gene conversion has also beensuggested as promoting variability (OHTA and BASTEN
1992). Here it is desirable to examine how this hypervari-
ability is related to gene duplication. Several mouse gene sequences of a,-antitrypsin available from GenBank, ap- parently have occurred by recent duplication, and show
hypervariability at the reactive center (BORRIELLO and
KRAUTER 1991). In this report, mouse sequences were analyzed together with sequences from other species;
human, rabbit, guinea pig and rat (see APPENDIX). The
results for the reactive center region are presented,
which include 21 amino acid sites.
Table 4 shows the results. The upper and lower figures
are the numbers of synonymous and nonsynonymous substitutions as before. From the table, it can be seen that, among the mouse sequences, the nonsynonymous substitution number exceeds the synonymous substitu- tion number, but that, for sequence pairs between spe-
cies, the former does not exceed the latter. It is likely that
the acceleration of amino acid substitution occurred through selection for mouse genes in conjunction with gene duplication.
DISCUSSION
The present analyses provide more examples of evo-
lution by gene duplication in which functional differ- entiation accompanies acceleration of amino acid sub-
stitution (OHTA 1991). Although only coding regions
were analyzed, these examples also suggest that evolu- tion of regulatory elements is important, since func- tional differentiation is correlated with changes of expression. It would be desirable to study the differ-
entiation pattern of regulatory elements in the future.
Actually, one would expect that more duplicated genes deteriorate than observed from the theoretical
point of view (KIMURA and KING 1979; OHTA 1988).
One reason for less chance of their deterioration than expected would be the prevention of deterioration through continued expression. Unless regulatory el-
ements change, abnormal products would be harmful
and would be selected against. Then protein se-
quences and regulatory elements would have to co-
evolve. In such a situation, acceleration of amino acid
substitution is likely to be caused by positive Danvin-
ian selection rather than by simple relaxation of se- lective constraints.
In eukaryote genomes, particularly in mammalian ge-
nomes, there are numerous gene families that origi-
nated mostly by gene duplication. However, in many cases, the duplication event was ancient, and synony- mous substitutions are saturated. Then the present ap- proach is not applicable. It should be noted that, even
in the present results, the synonymous substitution num-
ber per 100 sites is not very reliable, when the number
is 100 or more in the tables. The purpose of this study
is to show the pattern of synonymous us. nonsynony-
mous substitutions in duplicated genes, and not to es- timate the divergence accurately.
Another related problem in the present study is the
concept of a molecular clock. It is now clear that the rate
of amino acid substitution varies according to the func- tional differentiation of the products, which is often as- sociated with gene duplication. Amino acid sequences are commonly used for constructing phylogenetic trees.
One has to be careful in interpreting the results because
of the acceleration of amino acid substitution at the pe- riod of functional differentiation.
I thank WEN-HSIUNG LI and an anonymous referee for their valuable comments on the manuscript. This work was supported by a grant- in-aid from the Ministry of Education, Science and Culture of Japan. This is contribution no. 1999 from the National Institute of Genetics, Mishima 411, Japan.
LITERATURE CITED
BORRIELLO, F., and K. S. KRAUTER, 1991 Multiple murine a,-protease inhibitor genes show unusual evolutionary divergence. Proc. Natl. Acad. Sci. USA 88: 9417-9421.
DHOOT, G. R, and S . V. PERRY, 1979 Distribution of polymorphic forms of troponin components and tropomyosin in skeletal muscle. Nature 2 7 8 714-718.
FITCH, D. H. A,, W. J. BAILEY, D. A. TAGLE, M. GOODMAN, L. SIEU et a l . , 1991 Duplication of the yglobin gene mediated by repetitive L1 LINE sequences in an early ancestor of simian primates. Proc. Natl. Acad. Sci. USA 88: 7396-7400.
GIEBEL, L. B., B. P. DWORNICZAK and E. K. F. BAUTZ, 1988 Devel- opmental regulation of a constitutively expressed mouse mRNA encoding a 72-kDa heat shock-like protein. Dev. Biol.
GUNNING, P., P. P o r n , H. BLAU and L. KEDES, 1983 a-skeletal and a-cardiac actin genes are coexpressed in adult human skeletal muscle and heart. Mol. Cell. Biol. 3: 1985-1995.
HILL, R E., and N. D. HASTIE, 1987 Accelerated evolution in the reactive centre regions of serine protease inhibitors. Nature 326: 96-99. Hu, M. C.-T., S . B. SHARP and N. DAVIDSON, 1986 The complete se-
quence of the mouse skeletal a-actin gene reveals several con- served and inverted repeat sequence outside of the protein- coding region. Mol. Cell. Biol. 6: 15-25.
HUGHES, A. L., and M. NEI, 1988 Pattern of nucleotide substitution at major histocompatibility complex loci reveals overdominant
INA, Y., 1992 ODEN. National Institute of Genetics, Mishima, Japan. selection. Nature 335: 167-170.
INA, Y., 1994 New methods for estimating the numbers of syony- mous and nonsynonymous substitutions. J. Mol. Evol. (in press). IRWIN, D. M., and A. C. WILSON, 1990 Concerted evolution of mmi-
nant stomach lysozymes. J. Biol. Chem. 265: 4944-4952. W P E N , C., K SCHUGHART and F. H. RUDDLE, 1989 Two steps in the
evolution of antennapedia-class vertebrate homeobox genes. Proc. Natl. Acad. Sci. USA 86: 5459-5463.
KIMURA, M., 1983 The Neutral Theory of Molecular Evolution. Cam- bridge University Press, Cambridge.
KIMURA, M., and J. L. KING, 1979 Fixation of a deleterious allele at one of two duplicate loci by mutation pressure and random drift. Proc. Natl. Acad. Sci. USA 76: 2858-2861.
KIMURA M., and T. OHTA, 1972 On the stochastic model for estima-
tion of mutational distance between homologous proteins. J. Mol.
LASKOWSKI, M., JR., I. &TO, W. J. KOHR, S. J. PARK, M. TASHIRO et al., 1987 Positive Darwinian selection in evolution of protein inhibi-
5 2 545-553.
tors of serine proteinases. Cold Spring Harbor Symp. Quant. Biol.
LI, W.-H., 1985 Accelerated evolution following gene duplication and its implication for the neutralist-selectionist controversy, pp. 333-352 in Population Genetics and Molecular Evolution, ed- ited by T. OHTA and K. AOKI. Japan Scientific Societies Press, Tokyo.
LI, W.-H., 1993 Unbiased estimation of the rates of synonymous and nonsynonymous substitution. J. Mol. Evol. 36: 96-99.
LINDQUIST, S., 1986 The heat shock response. Annu. Rev. Biochem.
LONG, M., and C. H. LANGLEY, 1993 Natural selection and the origin of jingwei, a chimeric processed functional gene in Drosophila. Science 260: 91-95.
NEI, M., and T. GOJOBOH, 1986 Simple methods for estimating the numbers of synonymous and nonsynonymous nucleotide substi- tutions. Mol. Biol. Evol. 3 418-426.
OHNO, S., 1970 Evolution by Gene Duplication. Springer-Verlag, Berlin.
OHTA, T., 1980 Evolution and Variation of MultigeneFamilies (Lec- ture. Notes in Biomathematics, Vol. 37). Springer-Verlag, Berlin. EvoI. 2: 87-90.
55: 1151-1191.
OHTA, T., 1988 Further simulation studies on evolution by gene du-
OHTA, T., 1991 Multigene families and the evolution of complexity.
OHTA, T., 1993 Pattern of nucleotide substitutions in growth hormone-prolactin gene family: a paradigm for evolution by gene duplication. Genetics 134: 1271-1276.
OHTA, T., and C. J. BASTEN, 1992 Gene conversion generates hyper- variability at the variable regions of kallikreins and their inhibi- tors. Mol. Phyl. Evol. 1: 87-90.
PARMACEK, M. S., A. R. BENGUR, A. J. VARA and J. M. LEIDEN, 1990 The structure and regulation of expression of the murine fast skeletal troponin C gene. J. Biol. Chem. 265: 15970-15976.
PELHAM, H. R. B., 1986 Speculations on the functions of the major heat shock and glucose-regulated proteins. Cell 46: 959-961. STRONG, M., K. G. CHANDY and G . A. GUTMAN, 1993 Molecular evo-
lution of voltage-sensitive ion channel genes: on the origin of electrical excitability. Mol. Biol. Evol. 10: 221-242.
SUTOH, R, 1982 Identification of myosin binding sites on the actin sequence. Biochemistry 21: 3654-3661.
WALLIS, M., 1993 Remarkably high rate of molecular evolution of ruminant placental lactogens. J. Mol. Evol. 37: 86-88. YOKOYAMA, S., and R. YOKOYAMA, 1990 Molecular evolution of visual
pigment genes and other Gproteincoupled genes, pp. 307-322 in Population Biology of Genes and Molecules, edited by N. TA-
KAHATA and J. F. CROW,. Baifukan, Tokyo. plication. Evolution 4 2 375-386.
J. Mol. E d . 33: 34-41.
Communicating editor: W-H. LI
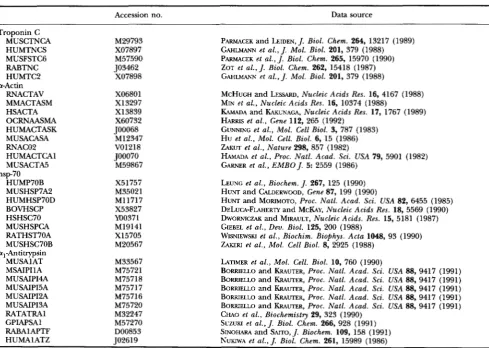
APPENDIX
Sequences from mouse, human, rabbit, guinea pig and rat used are given in Table 5.
TABLE 5
Accession number and data source
Accession no. Data source
Troponin C MUSCTNCA HUMTNCS MUSFSTCG RABTNC HUMTC2
RNACTAV MMACTASM HSACTA OCRNAASMA HUMACTASK MUSACASA RNACOZ HUMACTCAl MUSACTA5
HUMP7OB MUSHSP7A2 HUMHSP70D BOVHSCP HSHSC70 MUSHSPCA RATHST70A MUSHSC70B al-Antitxypsin
MUSAlAT MSAIPIlA MUSAIP14A MUSAIPI5A MUSAIPIZA MUSAIPI3A RATATRAl GPIAF'SAl RABAlAPTF HUMAlATZ a-Actin
hsp70
M29793 X07897 M57590 503462
X07898
X06801 X13297 X13839 X60732 J00068
M12347 V01218 J00070
M59867
X51757 M35021 M11717 X53827 YO0371 M19141 X15705 M20567
M33567 M75721 M75718 M75717 M75716 M75720 M32247 M57270 DO0853 TO2619
PARMACEK and LEIDEN, J. Biol. Chem. 264, 13217 (1989) GAHLMANN et al.,J. Mol. Biol. 201, 379 (1988) PARMACEK et a l . , J . B i d . Chem. 265, 15970 (1990) ZOT et a l . , J . Biol. Chem. 262, 15418 (1987) GAHLMANN et a l . , J. Mol. Biol. 201, 379 (1988)
MCHUGH and LESSARD, Nucleic Acids Res. 16, 4167 (1988) MIN et a l . , Nucleic Acids Res. 16, 10374 (1988)
KAMADA and KAKUNAGA, Nucleic Acids Res. 17, 1767 (1989)
HARRIS et a l . , Gene 112, 265 (1992)
GUNNING et al., Mol. Cell Biol. 3, 787 (1983) Hu et al., Mol. Cell. Biol. 6, 15 (1986)
ZAKUT et al., Nature 298, 857 (1982)
HAMADA et a l . , Proc. Natl. Acad. Sci. USA 79, 5901 (1982) GARNER et al., EMBO J. 5: 2559 (1986)
LEUNG et a l . , Biochem. J. 267, 125 (1990) HUNT and CALDERWOOD, Gene 87, 199 (1990)
HUNT and MORIMOTO, Proc. Natl. Acud. Sci. USA 84, 6455 (1985) DELUCA-FLAHERTY and McKAY, Nucleic Acids Res. 18, 5569 (1990) DWORNICZAK and MIRAULT, Nucleic Acids. Res. 15, 5181 (1987) GIEBEL et al., Dev. Biol. 125, 200 (1988)
WISNIEWSKI et a l . , Biochim. Biophys. Acta 1048, 93 (1990) ZAKERI et al., Mol. Cell Biol. 8, 2925 (1988)
LATIMER et al., Mol. Cell. Biol. 10, 760 (1990)
BORRIELLO and KRAUTER, Proc. Natl. Acad. Sci. USA 88, 9417 (1991) BORRIELLO and KRAUTER, Proc. Natl. Acad. Sci. USA 88, 9417 (1991) BORRIELLO and MUTER, Proc. Natl. Acad. Sci. USA 88, 9417 (1991) BORRIELLO and KRAUTER, Proc. Natl. Acad. Sci. USA 88, 9417 (1991)
BORRIELLO and KRAUTER, Proc. Natl. Acad. Sci. USA 88, 9417 (1991) CHAO et a l . , Biochemistry 29, 323 (1990)