A Test of
a
Counting Model for Chiasma Interference
Eric J.
Fossand Franklin W. Stahl
Institute of Molecular Biology, University of Oregon, Eugene, Oregon 97403 Manuscript received September 6, 1994
Accepted for publication December 8, 1994
ABSTRACT
According to the model of FOSS, LANDE, STAHL and STEINBERG, chiasma interference is a reflection of the requirement for crossovers to be separated by an organism-specific number of potential conversion events without associated crossovers. This model predicts that tetrads with close double crossovers should be enriched for conversion events that themselves are not associated with crossing over. We tested this prediction in Saccharomyces cerevisiae and found it to be unfulfilled.
I
N many organisms, meiotic crossovers discourage each other in a distancedependent manner ( STURTEVANT 1915; MULLER 1916; PERKINS 1962; MORTIMER and Fc-GEL 1974). Because crossing over takes place after pre- meiotic DNA replication, crossovers could interfere with each other in two ways. Either the interference is limited to the chromatids involved in the crossovers (chromatid interference) or it is not so limited (chiasma interfer- ence). Tetrad data from fungi show that chromatid in- terference is essentially absent (MORTIMER and FOGEL 1974) ; on the rare occasions that crossovers occur near each other, the choice of chromatids involved in one crossover has little influence on the choice in the other crossover. This shows up as an -1:2:1 ratio of 2-3-4 strand double crossovers.
Several models have been proposed to explain chi- asma interference. MULLER (1916) suggested that interference is a consequence of the stiffness of chro- mosomes. According to this model, when two chromo- somes have crossed over, it is difficult to bend them back on themselves to make a second crossover nearby. FOX ( 1973) attributed interference to the behavior of a “chiasma-determining mechanism.” This hypothetical enzyme moves along the bivalent at a constant speed and periodically “fires” to determine a crossover. After the enzyme has fired, it needs a certain amount of time to “recharge.” KING and MORTIMER (1990) suggested that a crossover nucleates the polymerization of an in- hibitory substance that spreads along the bivalent, pre- venting nearby attempts at crossing over.
The physical distances (measured in base pairs) over which interference extends can vary by several orders of magnitude from one organism to another. None of the models mentioned above demands this variation. For example, with no independent measure of chromosome stiffness, the steric model must assume that the stiffness
Corresponding author: F. W. Stahl, Institute of Molecular Biology, University of Oregon, Eugene, OR 97403-1229.
E-mail: [email protected]
Genetics 139: 1201-1209 (March, 1995)
of chromosomes varies over orders of magnitude in the same way as interference. Similarly, the chiasmade- termining mechanism and the inhibitory polymer, or the chromosomes over which they act, must have charac- teristics that vary over several orders of magnitude from one organism to another. If the physical distance were appropriately measured in length of synaptonemal com- plex [as implied by SYM and ROEDER ( 1994), and see PETERSON et al. ( 1994) ] rather than base pairs, less varia- tion might be demanded of physical models.
HOLLIDAY’S model attempts to account for this varia- tion ( HOLLIDAY 1977)
.
According to this model, there are factors essential for formation of crossovers evenly distributed along bivalents. A crossover lowers the local concentration of these factors and thereby discourages formation of further crossovers nearby. This model pro- vides unity to the widely differing distances over which interference can extend by positing that approximately equal numbers of these factors are allotted to the chro- mosomes of all organisms that exhibit interference. However, like the physical models mentioned above, this model fails to make discriminating predictions.There are two basic types of homologous recombina- tion events: potential conversions with or without associ- ated crossovers. In this paper, we use nomenclature established by MORTIMER and FOGEL (1974). Those events that could show up as conversions with associated crossovers, were there appropriate markers to detect them, are referred to as “ C , events” or simply “cross- overs.” Those events that could show up as conversions without associated crossovers, were there appropriate markers to detect them, are referred to as “C0 events.” Total potential conversion events without regard to the presence of associated crossovers are referred to as “C events.”
1202 Foss and Stahl
respect to each other, and then the counting machine specifies them such that neighboring C, events are sepa- rated by a specific number ( m ) of C , events. m , which can vary from one organism to another, can be esti- mated in either of two ways, by fitting interference data
( MCPEEK and SPEED 1995) or by determining the frac- tion of conversion events that are associated with cross- overs ( FOSS et al. 1993). This model was inspired par- tially by the observations that C events show no interference and that C, events do not discourage C, events ( STADLER 1959; CARLSON 1971; MORTIMER and FOCEL 1974). Because the number of C events per phys- ical distance varies over orders of magnitude among organisms, the model accounts in a simple way for inter- ference extending over widely differing physical dis- tances in different organisms, In other words, the model predicts that the genetic map, and not the physi- cal map, is the important variable in determining the distance over which interference extends. Consistent with this prediction, interference, when it occurs, is strong at 5 cM from a crossover and negligible by 40 cM ( see FOSS et al. 1993) .
The counting model has quantitative and qualitative precedents in the literature. Both COBBS (1978) and STAM (1979) published mathematical models that are essentially identical to the counting model. A qualitative precedent for the counting model comes from MORTI- MER and FOCEL (1974). They suggested that C, and C, events alternate along the bivalent. However, they failed to follow up on their suggestion and later seem to have abandoned it ( K I N G and MORTIMER 1990).
In contrast to the other models mentioned above, the counting model makes definite quantitative and qualitative predictions. The quantitative predictions have been examined extensively and provide strong support for the model
(Foss
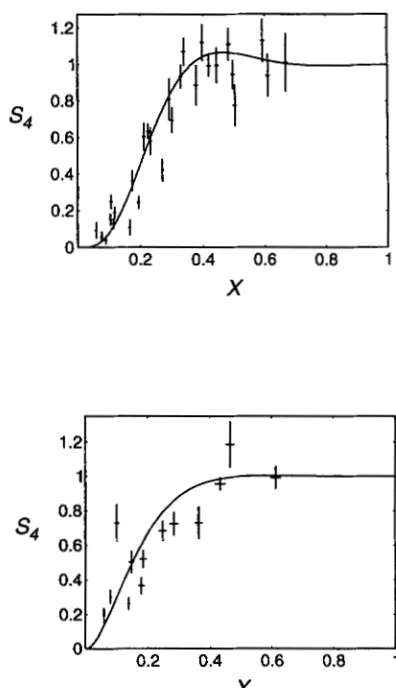
et al. 1993; LANDE and STAHL 1993; MCPEEK and SPEED 1995; ZHAO et al. 1995). The intensity of interference can be quantified as the coefficient of coincidence, S, the ratio of the observed frequency of double recombinants to the ex- pected frequency of double recombinants obtained by multiplying individual recombinant frequencies. (We use the abbreviation S, when four markers determine the two intervals used to calculate S.) To compare quan- titative predictions from the model with data, it was first necessary to determine the value of m for the organisms in question. Based on the fraction of conversions that are associated with crossing over in Drosophila melanogas- ter and Neurospora crassa (-0.2 and 0.3, respectively)( STADLER 1973; PERKINS 1979; HILLIKER and CHOVNICK
1981; HILLIKER et al. 1991; PERKINS et al. 1993), the values of m for these organisms were taken as four and two, respectively. The intensity of interference in these organisms as a function of genetic distance between two intervals shows a remarkable match to the predic- tions of the m = 4 and m = 2 versions of the model,
s4
X
9
0.2 0.4 0.6 0.8 1
X
FIGURE 1.-( Top) Drosophila S, data compared with the model with m = 4. (Bottom) Neurospora S, data compared with the model with m = 2. (From FOSS et al. 1993).
respectively (Figure 1 ) . The m =
4
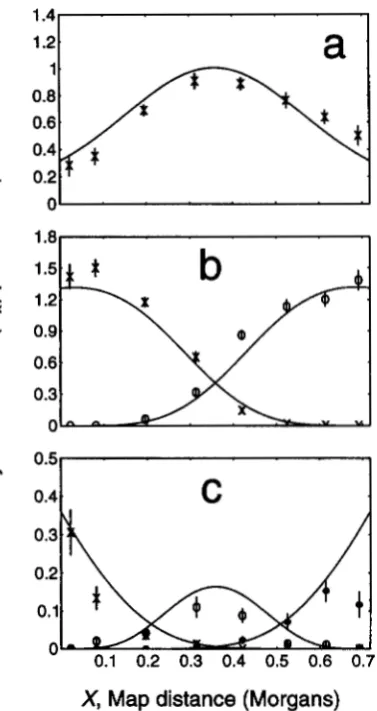
version of the model was also tested for its ability to predict the distribution of crossovers along the linkage map of the X chromo- some of Drosophila for single, double and triple ex- change tetrads, and the fit is again impressive (Figure 2 ) . This test is, at least to some extent, independent of the previous test.These quantitative tests provide strong support for the counting model and prompted us to test a qualita- tive prediction of the model in Saccharomyces cerevisiae. The average ratio of C,:C events in S. cermisiae is -0.37
'"I
1.21
a l
t
P
n
X
2
'c 0.51
x
1
0.41
C
I
X, Map
distance
(Morgans)
FIGURE 2.-Distributions of exchanges in tetrads of Dro- sophila with o n e ( a ) , two ( b ) o r three ( c ) exchanges, respec- tively (ranks 1,2, and 3, respectively), as a function of linkage map position as predicted by the model with m = 4. (From LANDE and STAHL 1993).
MATERIALS AND METHODS
Yeast strains and plasmids: We use the following nomen- clature to describe the locations of genes: gene A::GENE B indicates that geneA has been disrupted with GENE B. GENE BGENE A indicates that GENE B is next to, but not dis- rupting, GENE A.
YEF392 is a diploid made from mating YEF349 and YEF388 (Figure 3 ) . The genotype ofYEF349 is MATa, u r d - 5 2 , &2- AEcoRV, his3A200, leu2-AQnI, lys2-AHpd, trpl-A XbuI, LY- S2ARw, leu.%AQnI,,, ADEzGpAI. The genotype of YEF388 is MATa, uru-52 HIS3, ade.%AEcoRV, h i s 3 A 2 0 0 , h 2 - A K p n I , lys2-AHpuI, thrl-AEcoRV, urg4-ANsphI, lys2-AHpuIae, LEU2e,
UIiAjAmI. Strain construction details are given below. All yeast transformations were done with lithium acetate ( ITO et ul. 1983).
The fragment of ADE2integrated next to GPAl comes from pEF154 cut with BumHI and XhoI. pEF154 was made by ligat- ing an ADEkontaining EcoRI fragment from pEF150 into the EcoRI site of pEF83. pEF150 was made by ligating a BglII fragment from pASZl0 ( STOTZ and LINDER 1990) containing ADE2 to p34H (TSANG et ul. 1991) cut with BumHI. pEF83 was made by ligating a PvuII, XhoI fragment from pMNlO
(MIYAJIMA et al. 1987) containing the 3' end of GPAl to
pRS306 ( SIKORSKI and HIETER 1989) cut with SmuI and XhoI. The presence of the appropriate fragment at GPAl was con- firmed by Southern analysis.
The fragment of URA3 integrated at ARDl comes from pEF122 cut with EcoRI and NotI. pEF122 was made by ligating a SmuI fragment from pEF45 containing the URA3 gene into the HpuI site of pEFll7. pEF45 was made by ligating a HindIII fragment from YEp24 containing URA3 into the Hind111 site in p34H. pEF117 was made by ligating a BumHI fragment from pSPO13-1 ( WANG et ul. 1987) containing DNA 3 ' from ARDl gene into the BumHI site of pKsII+ (Stratagene). The presence of the appropriate fragment at A R D l was confirmed by Southern analysis.
The fragment of HIS3 integrated at u r d - 5 2 comes from pEF172 cut with EcoRV and SmuI. pEF172 was made by ligating a StuI fragment of pEF45 to pJJ215 (JONES and PRAKASEI 1990) cut with SmuI and PuuII. The presence of the appro- priate fragment at uru3-52 was confirmed by Southern analysis.
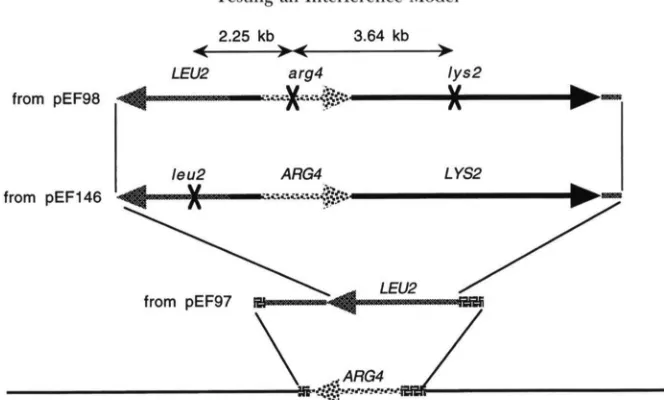
The fragment of DNA at ARM containing LYS2, ARG4 and leu2 comes from pEF146 cut with Sal1 and PstI. pEF146 was made by ligating an XbuI fragment from pEF143 containing ARM into the XbuI site of pEF91. pEF143 was made by ligating an SnuBI, Ecu47-I11 fragment from pMLC28 : : ARG4 [ PstI frag- ment of ARG4 in pMLC28 ( LEVINSON et ul. 1984) ] to p34E
( TSANG et ul. 1991 ) cut with SmuI. pEF91 was made by ligating an XbuI fragment from pEF76 containing urg4ABglII into the XbuI site of pEF37. pEF76 was made by ligating an Eco47-111, SnuBI fragment of urg4 with the BglII site ablated to p34E cut with SmuI. pEF37 was made by ligating a BumHI, XhoI frag- ment from pDA6200 (BARNES and THORNER 1986) con- taining the 5' end of LYS2 and a XhoI, BglII fragment from pDA6200 containing the 3
'
end of LYS2 into the BglII site of pEF29. pEF29 was made by ligating a SuZI, CluI fragment of pMJ56 (pBR322 containing HindIII fragment of URA3 and SulI, XhoI fragment of leu2-AEzpnI) containing leu2-AEzpnI to pEF27 cut with Sal1 and CluI. pEF27 was made by removing a Sal1 fragment from YEpl3. To target the SulI, PstI fragment of pEF146 to ARM, ARM was first replaced by LEU2 (Fig- ure 4 ) . This was done by transformation with a HindIII frag- ment of pEF97. pEF97 was made by ligating a SmuI fragment from pEF87 containing LEU2 to pNPS425 [same as pMLC28::ARG4, except G to C change at translation-initiat- ing ATG and vector is pMLC12 ( LEVINSON et ul. 1984) ] cut with Ecu47-I11 and SnuB1. pEF87 was made by ligating a PstI fragment from YEp13 containing LEU2 to p34H cut with PstI. The presence of the appropriate fragment of pEF146 at ARM was confirmed by Southern analysis.1204 Foss and Stahl
0.1 6.3 3.5 3.4 4.6 12.8
\ I \ I \ I \I
r \ r . / \ r \
>
5.4
-
30 1.o
-a
*
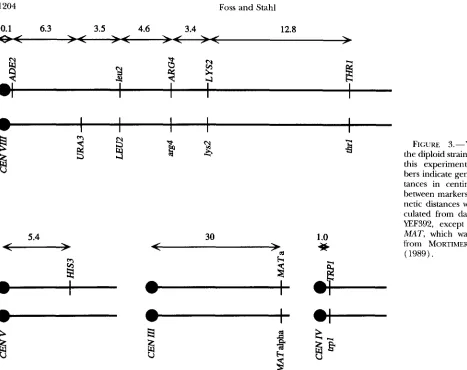
zi
FIGURE 3.-YEF392,the diploid strain used in this experiment. Num- bers indicate genetic dis- tances in centimorgans between markers. All ge- netic distances were cal- culated from data from YEF392, except CENIII- MAT, which was taken from MORTIMER et al.
(1989). h
from pDA6200 containing the 5’ end of LYSZ and a XhoI,
BgZII fragment from pDA6200 containing the 3 ’ end of LYS2 into the BglII site of pEF27. The presence of the appropriate fragment of pEF98 at arg4 was confirmed by Southern analysis.
Sporulation and dissection: YEF392 was patched out on YEPD plates, incubated overnight at 30°, replica-printed to sporulation medium, dissected after 3 days incubation at 30”
and scored after 2 more days at 30” (SHERMAN et al. 1982). Sporulated cultures were treated for 7 min with 1% Glusulase (DuPont)
.
Map distances and coefficients of coincidence: To calcu- late map distances, we used the formula of PERKINS ( 1949), with slight variations to allow it to accomodate conversions. We assumed that crossovers happen on the outside of conver- sion tracts (as is observed), and that those crossovers happen with equal probability on either side of the conversion tract. Rare tetrads showed nonparental ditype (NPD) segregation of markers flanking a converted site. (We use the abbreviation CxANPD to denote such tetrads, where A is the converted marker.) We assume that when two crossovers land in small contiguous intervals, chiasma interference separates them, so that one crossover lands in each interval. With these assump- tions, we arrive at the following formula: X,, = (100) ( T
+
tetrads) ( T = number of tetratype tetrads, CxA = number of tetrads with C, event at A that does not coconvert the other marker in question, B in this case). For example, LYS&K<;4 and ARG4 segregated in the T configuration 154 times but never in the NPD configuration. There were 21 C, events at 6NPD
+
0.5Cd+
0.5CXB+
C-pD+
C,,,pD) / ( 2 ) (totalLYSZARG4 that did not coconvert A R M , and 77 C, events at A R M that did not coconvert LYSZARCil. Two times, flanking markers segregated in the NPD configuration when there was a C event at LYS2A,tc4 that did not coconvert A R M . Two times, flanking markers segregated in the NPD configuration when there was a C event at ARG4 that did not coconvert LYSZAKC4. Therefore the genetic distance between LYSZAItC4 and ARG4 is ( 1 0 0 ) [ ( 1 5 4 )
+
( 0 . 5 ) ( 2 1 )+
( 0 . 5 ) ( 7 7 )+
( 2 )+
( 2 ) ] /( 2 ) (3081) = 3.4 cM. Conversion events at the terminal marker THRl were ignored. This is equivalent to treating the THRl-LYS2ARc;4 interval as “one conversion tract length from THRl” to LYSzAKC4. The (short) map distances between TRPl and ura?-52::HIS? and their centromeres were calcu- lated using the formula X = ( 100) ( T ) / ( 2 ) (total tetrads)
(SHERMAN and WAKEM 1991 ) . The T in this case means tet- ratype between the marker in question and the other two markers most tightly linked to nonhomologous centromeres
( ADEZCPAI being the third relevant marker).
Coefficients of coincidence for two intervals ( 1 and 2 ) were calculated using the formula S, = (0.25TI2
+
0.5TNPD12+
0.5TNPD2,) (total tetrads) / ( 0.5T1+
NPD,) (0.5T.L+
NPD2). TI2 stands for number of tetrads that are tetratype in intervals 1 and 2. TNPDI2 stands for number of tetrads that are tetratype for interval 1 and NPD for interval two. This formula is equivalent to the random spore-based formula in Foss et al. (1993). It is also a logical treatment of tetrad data (WEINSTEIN 1959). Errors were calculated as described in MULLER and JACOBS-MULLER ( 1925).FIGURE 4.-Targeting scheme used to integrate LYS2, LEU2 and A R M at A R M . Numbers indicate kilobases between markers.
1
-
C-RS.
When m = 2, S, = 1 - 2 e-“.‘ cos [ ( n / 3 )-
& X ] . In these formulas, X is the genetic distance in Mor- gans between two intervals of infinitesimal length. In practice,
we take Xas the distance in Morgans between the midpoints
of the two intervals in question. ”hen the distance between the intervals is small, S I +
&.
To assess the maximum error incurred by taking X as the midpoints of the two intervalswhen calculating S t , we calculate S, as well, using the formula
S, = ( RI2
+
R2)-
R I 3 ) / 2 R f 2 R Z J . R values were calculated following the procedure of Foss et nl. ( 1993) taking the two test intervals as running from the midpoint of the intervening interval to the outermost markers.RESULTS
According to the model of FOSS et al. ( 1993), cross- overs in S. caeuisiae are rarely separated by a small ge- netic distance because it is unlikely that two C,, events will fall in that small region. The model thus predicts that close double crossovers will be enriched for in- tervening
C ,
events. To test this prediction, we built astrain, YEF392, containing two close intervals to detect close double crossovers. These intervals are separated by two conversion hot spots to detect intervening C, events (Figure 3 ) . [The close intervals are THRI- I-Ys2ARG.# and URA3A,,l-ADE2c;l,Al. Crossovers in these intervals interfere with each other
(S,
= 0.71 5 0,075).The conversion hotspots are ARM and LEU2,,,, which in this context convert at 6.3% and 9.9’36, respectively.] It was important to have a control interval on another chromosome, to guard against the possibility that a posi- tive correlation between close double crossovers and intervening C, events was simply due to a subpopulation of the cells being hyperrecombinagenic. The CENV to ura3-52 HIS3 interval serves this purpose. The pres- ence of two tightly centromere-linked markers on other chromosomes ( TRPl and ~ J % ? G I > A / ) allowed us to mea-
sure this interval. Furthermore, the presence of three markers on chromosomes other than chromosome WII
( u r d - 5 2 HIS3, TRPl and MAT) helped guard against false tetrads. Spore viability was high (97% ) .
Out of
3081 tetrads with four viable spores, there
were 1467 tetrads with no crossovers from THRI to ADE2c;1Bz,l. Of these, 171 (11.7%) had a C , event at at least one of the intervening markers ( A R M and IXU2,,,.,). In contrast, among the 64 tetrads with cross- overs in each of the outside intervals but without cross- overs in the intervening region, only 4 tetrads ( 6 % )had a C, event at at least one of the two intervening markers. When compared to the “no crossover” group, this double crossover group should have had 38 or 41
C, events according to the m = 2 and m = 1 versions of the counting model, respectively (see APPENDIX).
This difference is highly significant ( P
<
0.0030 and0.0026 for m = 2 and 1, respectively). The model pre- dicts a smaller difference in the frequencies of C , events when the double crossover group is compared with the general population. There were 273 C,, events (8.9% )
at at least one of the intervening markers among the general population. The counting model predicts 13
C, events among the double crossover group instead
of the 4 observed, regardless of the value of m (see
APPENDIX). This difference is significant ( P
<
0.038). The frequencies of crossing over in the control interval( CEWto uru3-52 HIS3) did not differ significantly between these three groups of tetrads: 8% ( 5 / 6 4 ) for
the double crossover group, 9% ( 137/ 1467) for the no crossover group and 1 1
%
for the general population.1206 Foss and Stahl
these markers. No special effort was made to detect sectored colonies, which are rare for most yeast mark- ers, and few were detected. We can think of no reason why inefficient detection of 3:5 or 5:3 tetrads should skew our results.
Crossovers in the intervals THRl to LYS2AR(;4 and LEU2,,@ to URA3,, show strong interference ( S4 =
0.17 2 0.067). Out of 3081 tetrads, there were only six double crossovers, when 35 were expected based on S4 = 1 (assuming no triple crossovers). One of these tet- rads had a C, event at one of the intervening markers. These numbers are too small to be informative.
When crossovers did occur in both the THRl to LYS2AR(;4 and the URAJAml to ADE2GpA1 intervals, the choices of chromatids involved in the two exchanges were not demonstrably nonrandom with respect to each other. Out of 64 double crossovers, 20 involved two chromatids, 33 involved three chromatids and 11 in- volved four chromatids. With no chromatid interfer- ence, this distribution would be expected to be 16:32:16. Slight negative chromatid interference has been reported previously (PERKINS 1962; FOGEL et al.
1979).
Consistent with what others have seen, conversion events in this strain do not discourage each other. Some 5.6% ( 173
/
3081 ) of tetrads showed a conversion event at T H R l , 15.5% (478/3081) of tetrads showed a con- version event at L.EU2,@ and/ or ARG4 and 0.9% ( 28/3081) of tetrads showed conversion events at both of these loci, resulting in a “coefficient of coincidence” of 1.0. These are the only loci in this strain that convert at frequencies high enough to address this issue.
DISCUSSION
According to the model of Foss et al. (1993), chi- asma interference is a reflection of the requirement for C, events to be separated by a specific number ( m ) of C , events. The model accurately predicts data from Drosophila and Neurospora. The model also accounts for the observation that in different organisms interfer- ence extends over widely differing physical distances, but it is consistently strong 5 cM from a crossover and negligible by 40 cM. However, as shown in this paper, a central prediction of the model is not fulfilled in yeast. The model predicts that tetrads with close double crossovers will be enriched for intervening C, events when compared with the general population and, espe- cially, when compared with tetrads with no crossovers in the region under study. In contradiction to this pre- diction, only 6% ( 4 / 6 4 ) of double crossover tetrads had a C, event at at least one of the intervening mark- ers, whereas 8.9% of the general population had a C, event at at least one of the intervening markers and
11.7%
(171
/
1467) of the tetrads with no crossovers in the region had a C, event at at least one of the interven-ing markers. The difference between the model’s pre- diction for the comparison of the double crossover group and the general population is significant for any value of m , and the difference for the comparison of the double crossover group and the no crossover group is highly significant for m = 1 or 2 (see APPENDIX). Thus, serious doubt is cast on the model. The accuracy of the functions provided by the model remains mysteri- ous but useful ( STAHL and LANDE 1995)
.
Variations on the counting model were presented in FOSS et al. (1993) in which the first C event to be re- solved would be a C,, in which C events were resolved starting from the centromere with m C, events and in which variable numbers of C, events follow the obliga- tory m events. The data presented here are inconsistent with these versions of the model as well.
Any model for chiasma interference that takes into account the observations that C events are distributed at random with respect to each other and that C , events do not discourage C, events will predict that double crossover tetrads will be enriched for intervening C, events relative to the general population. This is be- cause a C event at an “intervening” marker will almost always be resolved as a C, event among double crossover tetrads, whereas resolution of such a C event is not so restrained among the general population. In other words, double crossover tetrads will be enriched for intervening C, events simply because intervening C
events cannot be resolved as C, events. We fail to see this enrichment. However, our numbers are not large enough to make this failure significant.
Previous studies have demonstrated that conversion events in yeast do not show interference and that chro- matid interference is essentially absent. If interference in our strain failed to demonstrate these qualities, the results of our experiment would be suspect. However, our strain behaved normally in these regards.
an
correct regardless of the value of m, when double cross- over tetrads are compared with the general population. If, on the other hand, C, events occurred at ARG4 at the same frequency among double crossover tetrads as among no crossover tetrads or as among the general population, there should have been three or two C,
events at ARG4, respectively.
The counting model is inconsistent in its ability to predict the coefficients of coincidence observed in this experiment. For the outside intervals ( THRl-LYS2mG4 and U & ~ ~ A R D I - ~ E ~ G ~ A ~ , X = 0.211), the model’s pre- dictions match the data. The model predicts a coeffi- cient of coincidence
S,
= 0.70 when m =2
(S,
= 0.50), and the observed coefficient of coincidence is 0.71 20.075. However, for the other pair of intervals men- tioned above ( TffR1-LYS2ARG4 and LEUI?,,@- U&iJAml, X = 0.162), the model predicts S4 = 0.53 when m =
2
( S , = 0.39), whereas the data show S4 = 0.17 2 0.067. The model’s predictions at m = 1 show worse fits to the data. These calculations are described in MATERIALS AND METHODS.
Estimates of the ratio of C,:C events vary widely in
S.
cermisiae. The average C,:C ratio of 0.37 for yeast mentioned above comes from five estimates that range from 0.18 to 0.66 ( FOGEL et al. 1981). When these numbers are corrected for incidental exchanges within the context of the counting model, the average C,:Cratio becomes 0.33, with a range from 0.16 to 0.60
( STAHL and LANDE 1995). (For both these data and the Neurospora data mentioned below, we do not know how much of this variation is due to sampling error.) This suggests values for m that range from 0.67 to 5.3
.
Such variation is seen even within a single region of the genome ( FOGEL et al. 1979).
Variation in estimates of the C,:C ratio is seen in Neurospora also, although to a lesser degree. When corrected within the context of the counting model, the values for this ratio range from 0.18 to 0.38 in nine estimates, with an average value of 0.30. In the absence of knowledge regarding sampling variation, this could mean that m varies from 1.6 to 4.6. If the counting model were modified to ac- count for such possible variation, its delightful simplic- ity would be sacrificed.The counting model was promising because its math- ematical formulation describes data from Drosophila and Neurospora with noteworthy accuracy (and, of course, the model may apply to those creatures). These quantitative predictions were based on the assumption that C events are Poisson distributed. To be Poisson distributed, a given “trial” must be “successful” with low probability. The “hotter” a recombination hotspot is, the less it satisfies this requirement. ENGELS (per- sonal communication) brought this point to our atten- tion and addressed it quantitatively. He showed that hotspots in yeast are not hot enough to cause significant deviations from the model’s predictions.
RUSS LANDE provided essential advice on data analysis. NEIL SCHULTES, JEREMY THORNER, MIKE LICHTEN, I. MIYAJIMA, A. STOTZ and STEVE Gow kindly provided plasmids. We are grateful to ANDREW
MURRAY and LARRY GILBERTSON for helpful discussions. JETTE FOSS and members of our laboratory helped us with the manuscript. The work was supported by National Institutes of Health (NIH) grant GM-33677 and National Science Foundation grant DMB8905310. E.J.F. was supported during part of these studies by NIH Genetics Training grant 5 T32 GM-07413. F.W.S. is American Cancer Society Research Professor of Molecular Genetics.
LITERATURE CITED
BARNES, D. A,, and J. THORNER, 1986 Genetic manipulation of Sac- charomyces cerevisiae by use of the L E 2 gene. Mol. Cell. Biol. 6: 2828-2838.
CARLSON, P. S., 1971 A genetic analysis of the rudimentary locus of Drosophila melanogaster. Genet. Res. 17: 53-81.
COBBS, G., 1978 Renewal process approach to the theory of genetic linkage: case of no chromatid interference. Genetics 89: 563- 581.
FOGEL, S., R. K. MORTIMER, K. LUSNAK and F. TAVARES, 1979 Meiotic gene conversion: a signal of the basic gene recombination event in yeast. Cold Spring Harbor Symp. Quant. Biol. 43: 1325-1341. FOGEI., S., R. K. MORTIMER and K. LUSNAK, 1981 Mechanisms of
meiotic gene conversion or “Wanderings on a foreign strand,” pp. 289-339 in Molecular Biology of the Yeast Saccharomyces: Life Cycle and Inheritance, edited by J. N. STRATHERN, E. W. JONES and J. R. BROACH. Cold Spring Harbor Laboratory, New York. FOGEL, S., R. K. MORTIMER and K. LUSNAK, 1983 Meiotic gene con-
version in yeast: molecular and experimental perspectives, pp. 67- 107 in Yeast Genetics, edited byJ. F. T. SPENCER, D. M. SPENCER and A. R. W. SMITH. Springer-Verlag, New York.
FOSS, E., R. LANDE, F. W. STAHL and C. M. STEINBERG, 1993 Chiasma interference as a function of genetic distance. Genetics 133: 681 -
691.
FOX, D. P., 1973 The control of chiasma distribution in the locust, Schistocera gregaria (Forskal) . Chromosoma 43: 289-328. HILLIKER, A. J., and A. CHOVNICK, 1981 Further observations on
intragenic recombination in Drosophila melanogaster. Genet. Res.
HILLIER, A. J., S. H. CLARK and A. CHOVNICK, 1991 The effect of DNA sequence polymorphisms on intragenic recombination in the rosy locus of Drosophila melanogaster. Genetics 129: 779-781. HOLLIDAY, R., 1977 Recombination and meiosis. Phil. Trans. R. SOC.
Lond. B. 277: 359-370.
ITO, H., Y. FUKUDA, K. MURATA and A. KIMURA, 1983 Transforma- tion of yeast cells treated with alkali cations. J. Bacteriol. 153:
JONES, J. S., and L. PRAKASH, 1990 Yeast Saccharomyces cereuisiae se- lectable markers in pUC18 polylinkers. Yeast 6: 363-366.
KENDALL, M., and A. STUART, 1977 The Advanced T h e 9 of Statistics. Macmillan, New York.
KING, J. S., and R. K. MORTIMER, 1990 A polymerization model of chiasma interference and corresponding computer simulation. Genetics 126: 1127-1138.
LANDE, R., and F. W. STAHL, 1993 Chiasma interference and the distribution of exchanges in Drosophila melanogaster. Cold Spring Harbor Symp. Quant. Biol. 58: 543-552.
LEVINSON, A,, D. SII.VER and B. SEED, 1984 Minimal size plasmids containing an M13 origin for production of single-strand trans- ducing particles. J. Mol. Appl. Genet. 2: 507-517.
MCPEEK, M. S., and T. P. SPEED, 1995 Modeling interference in genetic recombination. Genetics ( i n press) .
M ~ J I M A , I., M. NAKAFUKU, N. NAKAYAMA, C. BRENNER, A. MIYAJIMA et al., 1987 GPAl, a haploid-specific essential gene, encodes a yeast homolog of mammalian G protein which may be involved in in mating factor signal transduction. Cell 50: 1011-1019. MORTIMER, R. K., and S . FOGEL, 1974 Genetical interference and
gene conversion, pp. 263-275 in Mechanism in Recombination,
edited by R. F. GRELL. Plenum, New York.
MORTIMER, R. K., D. SCHILD, C. R. CONTOPOULOU and J. A. KANs,
38: 281 -296.
1208 Foss and Stahl
5 : 321-403.
1989 Genetic and physical maps of Saccharomyces cereuisiae. Yeast
MULLER, H. J., 1916 The mechanism of crossing over.
Am.
Nat. 50:MULLER, H. J., and J. M. JACOBSMULLER, 1925 The standard errors of chromosome distances and coincidence. Genetics 10: 509-524.
PERKINS, D. D., 1949 Biochemical mutants in the smut fungus Ustilago
maydis. Genetics 34: 607-626.
PERKINS, D. D., 1962 Crossingaver and interference in a multiply- marked chromosome arm of Neurospora. Genetics 47: 1253-1274. PERKINS, D. D., 1979 Crossing over of flanking markers is less than
50% among meiotic convertants. Genetics 91: s94.
PERKINS, D. D., R. LANDE and F. W. STAHL, 1993 Estimates of the proportion of recombination intermediates that are resolved with crossing over in Neurospora crassa. Genetics 133: 690-691. PETERSON, D. G., S. M. STACK, J. L. HEALY, B. S. DONOHOE and L. K.
ANDERSON, 1994 The relationship between synaptonemal com- plex length and genome size in four vertebrate classes (Osteic- thyes, Reptilia, Aves, Mammalia). Chromosome Res. 2: 153-162. SHERMAN, F. and P. WAKEM, 1991 Mapping yeast genes, pp. 38-57 in Methods in Enzymology, edited by C. GUTHRIE and G. R. FINK.
Harcourt Brace Jovanovich, San Diego.
SHERMAN, F., G. R. FINK and J. B. HICKS, 1982 Methods in Yeast &et-
ics. Cold Spring Harbor, New York.
SIKORSKI, R. S., and P. HIETER, 1989 A system of shuttle vectors and yeast host strains designed for efficient manipulation of DNA in Saccharomyces cereuisiae. Genetics 122: 19-27.
STADLER, D. R., 1959 The relationship of gene conversion to crossing over in Neurospora. Proc. Natl. Acad. Sci. USA 45: 1625-1629. STADLER, D. R., 1973 The mechanism of intragenic recombination.
Annu. Rev. Genet. 7: 113-127.
STAHI., F. W., and R. LANDE, 1995 Estimating interference and linkage map distance from two-factor tetrad data. Genetics 139:OOO-000. STAM, P., 1979 Interference in genetic crossing over and chromo-
some mapping. Genetics 92: 573-594.
STOTZ, A,, and P. LINDER, 1990 The ADE2 gene from Saccharomyces cereuisiae: sequence and new vectors. Gene 95: 91-98.
STURTEVANT, A. H., 1915 The behavior of the chromosomes as stud- ied through linkage. Z. Indukt. Abstammungs. Vererbungsl. 13: 234-287.
Sw, M. and G . S. ROEDER, 1994 Crossover interference is abolished in the absence of a synaptonemal complex protein. Cell 79: 283- 292.
TSANG, T., V. COPELAND and G. T. BOWDEN, 1991 A set of cassette cloning vectors for rapid and versatile adaptation of restriction fragments. Biotechniques 10: 330.
WANG, H.-T., S. FRACKMAN, J. KOWALISW, R. E. ESPOSITO and R. ELDER, 1987 Developmental regulation of SP013, a gene re- quired for separation of homologous chromosomes at meiosis I. Mol. Cell. Biol. 7: 1425-1435.
WEINSTEIN, A,, 1959 The geometry and mechanics of crossing over. Cold Spring Harbor Symp. Quant. Biol. 23: 177-196.
ZHAO, H., T. P. SPEED and M. S. MCPEEK, 1995 Statistical analysis of crossover interference using the chi-square model. Genetics
193-221; 284-305; 350-366; 421-434.
139: 1045-1056.
Communicating editor: P. J. PUKKILA
APPENDIX
Russell Jande
Department of Biology, University of Oregon, Eugene, Oregon 97403
Statistical analysis of experimental conversion fre- quencies: We perform statistical tests of an hypothesis generated by the theory of chiasma interference de- rived by Foss et al. (1993). The hypothesis concerns chromosomes with three adjacent marked intervals within a moderately short distance (Figure A1 ) . Tet- rads with a double crossover, one in each of the flanking intervals, will be enriched for gene conversions in the
4 M
0.128
0.115
-
0.063x=0.211
FIGURE A1.-Map distances (in Morgans) between mark- ers in YEF392. Distances are based on the tetrads dissected for these experiments as described in MATERIALS AND METHODS.
middle interval, in comparison either with all tetrads or, even more so, to tetrads with no crossover. To compare experimental results with predictions from the general theory, we need to derive a specific prediction of the magnitude of the enrichment expected for this experi- ment, as well as the standard error of the appropriate test statistic for the experimental observations.
Theoretical prediction: In the general theory, con- version events, C, have a Poisson distribution as a func- tion of linkage map distance along the chromosome. Two adjacent conversions each with a crossover, C,, must be separated by m conversions without a crossover, C,. In an interval of map length X Morgans, the mean number of C events per tetrad is 2 ( m
+
1 ) X.Among all tetrads examined, the probability of a C, in a short interval d X is Q1 = 2mdX. In tetrads with a double crossover ( C , in each flanking interval), the probability of a C, in a short interval d X is approxi- mately f& md X/ X, assuming that tetrads with three or more crossovers occur with negligible frequencies.
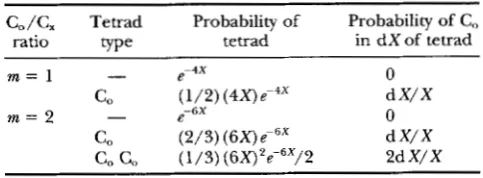
In tetrads with no crossover, the probability of a C , in a short interval d X can be constructed from Table A1 by summing the products of the last two columns. For m = 1 this is Q3 = 2e-4xdX, and for m = 2 it is Qs
= 4 ( 1
+
3X)e-"dX.We test the following two hypotheses. (1) The pre- dicted magnitude of enrichment of Cos in the middle interval in tetrads with double crossovers (one in each flanking interval) compared with the entire sample is
a /
Ql 1/
( 2 X ) , which is independent of m.( 2 )
The predicted magnitude of enrichment of Cos in the
TABLE A1
Constructing the probability of C, in tetrads without crossover in an interval of XMorgans
c,/C, Tetrad Probability of Probability of
c,
ratio tvwe tetrad in dXof tetradm = l
m = 2 -
-
e-4X0
e-fiX 0
C, (1/2) ( 4 X ) e - 4 X d X/X
C, (2/3) (6X)e?' d X/X
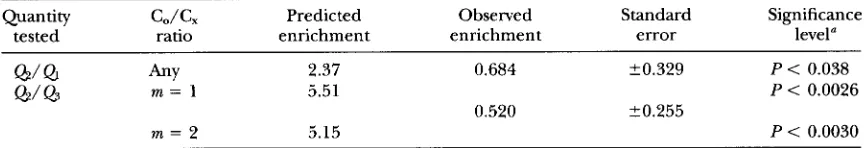
TABLE A2
Comparison of theoretical predictions and experimental observations on chiasma interference, for an interval of length X = 0.211 Morgans
Quantity C,/G Predicted Observed Standard Significance
tested ratio enrichment enrichment error level"
Q/Q
h Y 2.37 0.684 20.329 P < 0.038Q/Q
m = 1 5.51 P < 0.00260.520 20.255
m = 2 5.15 P < 0.0030
a From Chebychev inequality.
middle interval in tetrads with double crossovers (one in each flanking interval) compared with tetrads with no crossovers is
& /
Q3 e4x/ ( 2 X) for m = 1 and & / Q ~ e 6 " / [ ( 2 x ) (1+
S X ) ] for m = 2.The experimental observations are as follows. From a total of 3081 tetrads examined, three involved triple cross- overs, which satisfies the assumption that tetrads with three or more crossovers are very rare. There were 273 tetrads with C, at markers in the middle interval, regard- less of the state of the flanking intervals. There were 66 double crossover tetrads (with a C& in each flanking inter- val), and of these only four had C, at markers in the middle interval. There were 1467 tetrads with no cross- over, and of these 171 had C, at markers in the middle interval. We take the length of the interval in the theoreti- cal formulas above to be the distance between the mid- points of the two flanking intervals, that is X = 0.211 Morgans. These data can be used to evaluate the quanti- ties
&/
Ql
and @ /&
and to compare them to the t h e e retical predictions derived above.Table A2 shows that instead of the predicted enrich- ment of Cos in the middle interval, the data manifest a (nonsignificant) depletion. The discrepancies between the theory and observation are significant in the first test and highly significant in the second test, regardless of whether m = 1 or 2. Formulas for approximate stan- dard errors and significance levels used in the statistical tests are given below.
Standard errors: Taylor series expansion was used to obtain approximate sampling variance of the test statistics, assuming that mutually exclusive categories of tetrads followed a multinomial sampling distribution.
The ratio
&/
Q1 can be estimated from the data asr = ~ ~
(n1
n,)
( n l y n 3 ) 7where n1 = number of tetrads with C, in each flanking
interval with C, in middle interval, n, = number of tetrads with C, in each flanking interval without C, in middle interval, n3 = number ol' tetrads with C, in mid- dle interval (regardless of flanking intervals) - nl and N = total number of tetrads.
The ratio @ / Q3 can be estimated from the data as
n3
+
n4r = ___ ~
(n1:n2)
(
n31
where nl and n, are as defined above, and now n3 =
number of noncrossover tetrads with C, in middle inter- val and n4 = number of noncrossover tetrads without C, in middle interval.
In both cases, the sampling variance of the estimate can be approximated as
4 4
09 E
2
C C
aiaj(Sqpt - p i p j ) N ,i = l j = 1
where
6,
= 1 if i = j and 0 otherwise, andpi
= n i / N . The standard error is 07.For the first test estimating
&
/
Ql
,
= - 1/
( n1+
n,),
a3 = - l / ( n l+
n3), ul = a,+
a3+
l / n l , u4 = 0, and we assume that nl+
n, and nl+
n3 are both large ($10).For the second test estimating
&/
Q,
ul =n,/
[ n l ( n l
+
% ) I ,
a, = - l / ( n l+
n,),
a3 = - n 4 / [ n 3 ( n 3+
n4)1,
u4 = 1/
( %+
n4) and we assume that nl+
n,and n3 are both large ( B 10)