Copyright 0 1996 hy the Genetics Society of America
Dynamics of Plant Mitochondrial Genome: Model
of a
Three-Level Selection Process
Beatrice
Albert,*.§
Bernard Godelle? Anne
Atlan,I
Rosine De Paepe5
and
Pierre Henri Gouyon*
*Laboratoire Evolution et Systdmatique des Vdgdtaux, CNRS URA 2154, Uniuersiti Paris X I , 91405 Orsay cedex, France, tEcole Nationale Supirieure d’Horticulture (Versailles-Angers), France, ILaboratoire Dynamique du Ginome et Evolution,
IJM, Uniuersite‘ Paris VI, UMR 9922, 75251 Paris cedex 05, France and $Laboratoire de Biologie Moliculaire des Plantes, CNRS URA 1128, Universiti Paris X I , 91405 Orsay cedex, France
Manuscript received October 2, 1995
Accepted for publication May 17, 1996
ABSTRACT
The plant mitochondrial genome is composed of a set of molecules of various sizes that generate each other through recombination between repeated sequences. Molecular observations indicate that these different molecules are present in an equilibrium state. Different compositions of molecules have been observed within species. Recombination could produce deleted molecules with a high replication rate but bearing little useful information for the cell (such as “petite” mutants in yeast). In this paper, we use a multilevel model to examine selection among rapidly replicating incomplete molecules and relatively slowly replicating complete molecules. Our model simulates the evolution of mitochondrial information through a three-level selection process including intermolecular, intermitochondrial, and intercellular selection. The model demonstrates that maintenance of the mitochondrial genome can result from multilevel selection, but maintenance is difficult to explain without the existence of selection at the intermitochondrial level. This study shows that compartmentation into mitochondria is useful for maintenance of the mitochondrial information. Our examination of evolutionary equilibria shows that different equilibria (with different combinations of molecules) can be obtained when recombination rates are lower than a threshold value. This may be interpreted as a drift-mutation balance.
T
HE natural selection of mitochondrial (mt) genomes in plants can be considered as a three-level process: intermolecular, intennitochondrial (these two levels are called intracellular,BIRKY
1994) and intercellular selec- tion. In this paper, we explore with a simulation model the interplay of intercellular, intermitochondrial and in- termolecular selection in maintaining or not the entire mt information, and we study the change of proportion of mtDNA molecules within a cell (Figure 1).The plant mtDNA is composed of a set of different molecules. Restriction maps of cosmid libraries are al- most always circular, but observations under the micro- scope reveal mainly linear molecules
(BENDICH
1985;QUETIER
et al. 1985;BENDICH
andSMITH
1990). Plant mt genomes are 10- to 100-fold larger than those in animals. The circular genetic map has led to the postu- lation of the existence of master circles, defined as hy- pothetical molecules containing the whole mt informa- tion. Master circles contain coding, noncoding and recombining sequences. They bear long repeats that do not recombine and short repeats that recombine at specific sites (ANDRE et al. 1992). Recombining repeats can be in direct or indirect orientations, the direct re-Corresponding author: Beatrice Albert, Laboratoire d’Evolution et Systematique des Vegetaux, bPt 362, Universite Paris XI, 91405 Orsay cedex, France. E-mail: albertt3psisun.u-psud.fr
peats being more frequently observed (see HANSON and FOLKERTS 1992 for a review). When two sequences recombine, the initial molecule gives rise to other mole- cules. Two smaller molecules are produced by recombi- nation through direct recombining repeats, whereas re- combination through indirect recombining sequences gives rise to one molecule of the same size but with a modification of sequence orientation
(QUETIER
et al.1985). Recombination between recombining sequences generates a population of molecules
(LONSDALE
et al.1988) of different sizes and molecular structures (an example in Figure
2).
Experimental data have shown that mtDNA mole- cules can be in different proportions within the same species. For example, different mitochondrial cytotypes corresponding to various compositions of molecules have been observed in Zea mays (SMALL et al. 1987). Some molecules may be substoichiometric (very low frequencies) in a cytotype and frequent in another one. The amplification of preexisting substoichiometric mol- ecules as a mechanism of variation of the mt genome was suggested for the first time by SMALL et al. (1987). Such a process of amplification of substoichiometric molecules would permit rapid evolution of the mt ge- nome structure and explain why great variability is found in the gene order between closely related species
370 B. Albert et nl.
.00000.I
0 O O . m
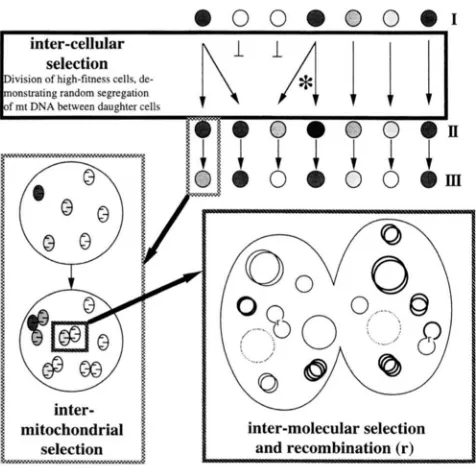
FIGURE 1.-Model of mitochondrial evolution with three levels of selection. The darker the pattern, the higher the fitness (for cells, mitochondria or molecules). The highest level of selection considered here, namely intercellular selec- tion (represented at the top of the figure), consists of the differential survival and replication of “high-fitness” cells
(dark gray) relative to “low-fitness” cells (light gray) (the method of determining the relative fitness of cells is described below). During cell division (represented in the frame enti- tled “intercellular selection”), mtDNA randomly segregates between daughter cells, leading in some cases to inequality between the cells (*). Before the next cell division, mtDNA replicates within mitochondria (cross-hatched frame). If in-
termitochondrial selection occurs, mtDNA replication differs between relatively high-fitness (dark gray) and low-fitness
(light gray) mitochondria (the method of determining rela- tive fitness of mitochondria is described below). Within each mitochondrion (hatched frame) DNA molecules replicate ac- cording to the number of replication origins on the molecule. Selfish molecules (bold circles), with a high density of replica- tion origins, replicate relatively fast; while molecules with no replication origins (dashed circles) do not replicate at all. In addition, mtDNA can recombine (indicated by an r ) . Mito-
chondrial fitness is determined by the composition of all mtDNA sequences within the mitochondrion. A mitochon- drion principally composed of selfish sequences of mtDNA
(e.g., the mitochondrion on the right in the magnified view, appearing light gray in the unmagnified view) has relatively low fitness, whereas a mitochondrion principally composed of sequences containing a sufficient amount of information has relatively high fitness (the dark gray mitochondrion in the unmagnified view). Some genetic complementation between mitochondria is possible (see text for additional details). A cell’s fitness is the sum of the fitnesses of the mitochondria
it contains.
As
a result of intercellular selection, mean fitness increases (e.g., the lower line of cells is darker than the upper one). In contrast, intracellular selection (intermolecular se- lection compensated to some extent by intermitochondrial selection) decreases mean cell fitness ( q . , the third line of cells is less dark than the second line). The resulting system,with three levels of selection, can reach an equilibrium at which alternating generations of cells have an equal mean fitness.
or within the same species (PALMER and HERBON 1988). In contrast, little variability has been found in DNA
sequences, indicating that the evolution of nucleotide sequences is very slow. The substitution rate is of the order of 0.2 substitution per site per billion years, which is 10 times less than in the nucleus and hundred times less than in animal mitochondria (WOLFE et al. 1987). Therefore, the evolution of the plant mitochondrial genome seems to proceed more by rearrangement than by nucleotide substitution. In vitro culture is the only experimental system so far where a change of equilib- rium state of mt molecules has been observed directly
(HANSON and FOLKERTS 1992; VITART et al. 1992). This particular mode of evolution was theoretically modelled by ATLAN and COUVET (1993) to determine what types of equilibria of molecules are possible. Their simulation model involves an intermolecular level of selection: molecules of various sizes and structure repli- cate differentially. Several dynamic equilibria of mole- cules can exist according to the recombination rate values. The model shows that these dynamics alone lead to an invasion of molecules bearing little information. This results either from differential reproduction in favor of small molecules or drift. In the absence of a specific force maintaining it, most of the information is lost. Indeed, a master circle having, for example, one replication origin should replicate in a biological organ- ism more slowly than a small circle with one replication origin. This is another example of conflict linked with the cellular and mitochondrial levels (COSMIDES and TOOBY 1981). In ATLAN and COUVET’S model, the whole mt information is maintained if a replicative advantage is given to the master circle. Indeed, other molecules seem to have a potential for faster replication than mas- ter circles, either because they have the same number of replication origins but are smaller than master cir- cles, or because they are of similar sizes but have more numerous replication origins. Unfortunately for the cells that bear them, these molecules carry little infor- mation, since sequences coding for mt functions are replaced by sequences favoring replication. Such mole- cules will be refered to “selfish circles” (DOOLITTLE
and SAPIENZA 1980; ORGEL and CRICK 1980).
Another process able to preserve the mt information
(i.e., preventing invasion by selfish molecules) without a replicative advantage of master circles could be an intercellular and/or an intermitochondrial selection process. Intercellular selection prevents cells without enough information from dividing. One can expect that molecules in a mitochondrion with all mt informa- tion replicate better than molecules in a deficient mito- chondrion. One would expect therefore that the inter- cellular and intermitochondrial level of selection counteract the intermolecular level: they favor the
pres-
Mitochondrial Genome Dynamics 371
Our model was run with and without a mitochondrial level of selection. Indeed the fusion of mitochondria into a single chondriome has been postulated but has not been clearly observed experimentally. Microscopy pictures generally show isolated mitochondria (BEN- DICH and GAUIULOFF 1984). However, in some hybrids obtained by protoplast fusion, recombination rapidly occurs between the two mitochondrial genomes, indi- cating that mitochondria fuse (BELLIARD et al. 1979). In the presence of a chondriome, there is no spatial structure and thus no selection at the mitochondrial level. However if sometime in the cell cycle, mitochon- dria are isolated and develop separately from each other, selection at the mitochondrial level can occur.
A number of papers have already described intracel- lular selection (e.g., BIRKY 1973; TAKAHATA and SLATKIN 1983; BRENDEL and SEGEL 1987; CONDIT and LEVIN 1990). The aim of this paper is to introduce intermito- chondrial and intercellular selection in a model of plant mt genome dynamics, and to use this model to investi- gate mt evolution in plants. The first questions concern the maintenance of mt information. How is the entire mitochondrial information maintained? Can intercellu- lar selection alone explain the maintenance of the en- tire mt information? If not, do intercellular and intermi- tochondrial selection together maintain it? What types of molecules are responsible for the maintenance of information? The second set of questions concerns the composition of the mitochondrial genome. Is it possible to get several equilibria of mt molecules? What are the main characteristics of these equilibria? And how can the switch from one equilibrium to another one occur? The understanding of the different equilibria of mt molecules and the change of equilibrium should pro- vide information on evolutionary process of the plant mt genome.
THE MODEL
To simulate the evolution of plant mtDNA molecules within a cell population, a theoretical model was con- structed that takes into account the main mechanisms of mt genome evolution. As in ATLAN and COUVET (1993), the evolutionary forces, namely recombination, selection of molecules as a result of their differential replication and drift resulting from random segregation of molecules during cellular division, are assumed to act successively during each cell cycle. A cell cycle be- gins with the recombination process; after mt molecules are apportioned among the mitochondria, replication takes place and mt molecules are randomly distributed between the two daughter cells. In our model, the selec- tion is acting at three different levels: intermolecular, intermitochondrial, and intercellular. The model is a simulation model written in turbo pascal for a PC with a pentium processor. The program can be obtained by
contacting the authors. Each set of parameters were run 40 times.
Main assumptions of the model: The set of mole-
cules on which selection acts is generated through re- combination of recombining repeats. This can happen either between two repeats of the same circle or be- tween two repeats of two different circles. The possible molecules depend on the number, position, and orien- tation of the recombining sequences. We assume in the model that recombination rates between recombining sequences depend on the type of recombination (be- tween or within molecules), and that a molecule can recombine only once per cellular cycle. However, if two
different molecules with the same recombining se- quences are always able to fuse, the number of polymers generated by the fusion process is potentially infinite. Experimental observations do not permit to determine clearly the size of mt molecules; therefore, in the model, we limited the maximum size of molecules to that of
the master circle.
Intermolecular selection favors molecules with little information but with a lot of replication origins. This
was
modelled considering that a molecule in a given mitochondrion will replicate faster if its replication ori-gin density increases (the ratio of the number of replica- tion origins over the length). But since the resources for mtDNA replication in the cells are limited (sug- gested by BIRKY 1994), they must be split between the replicating molecules, so that a molecule replicates less frequently as the number of replication origins in the cell increases.
Intercellular and intermitochondrial selections favor cells and mitochondria that contain all functional se- quences in sufficient amounts (see below). Through intercellular selection, cells with complete information and enough sequences of each type will divide, whereas cells with insufficient information will not. In the same way, through intermitochondrial selection, molecules in mitochondria with more information will replicate more than molecules in mitochondria with little infor- mation. Furthermore, we consider that a deficiency of one type of region containing different sequences within a mitochondrion can be compensated within a cell containing a large amount of this region. This is assuming complementation between mitochondria of the same cell (suggested by OLIVER and WALLACE 1992).
Intracellular variability and the population of circles:
372 B. Albert pt al.
1
!
/
11
2
Mitochondrial Genome Dynamics 373
1 and 7 in Figure
2)
contain two direct recombining sequences and four different regions: a region with the replication origin and three others with coding se- quences containing together all the mt information. There are two master circles differing by the orientation of the coding sequences. Four small circles (two regions each, circles2-5
in Figure 2) are generated by intramo- lecular recombination within master circles. Only two small circles (circles 2 and 5 in Figure 1) bear the region with the replication origin. They are called small selfish circles because they replicate a lot (small size) and bear only one region with coding sequences useful for the mitochondrion. Three circles (circles 6,12,14 in Figure2) have two regions with the replication origin and two other regions; they are called large selfish circles. Three others have no replication origin (circles 8, 10, 11 in Figure 2) and four regions with coding sequences. The last two circles (circles 9 and 13) have one origin of replication and three coding sequences, one of which is found twice. These two circles together possess the same information as two master circles.
Recombination process: A molecule recombines at different rates depending on the type of recombination process (intra- or intermolecular recombination). It is assumed that recombination among molecules occurs randomly between all molecules in a cell (panmictic population of molecules), as suggested by LONSDALE et
al. (1988). We assume that a circle can recombine only once per generation.
For simplicity, the simulations were realized using a system of circles with only direct recombining se- quences. The rate of intramolecular recombination is called Rintra. R,,,, is the probability for a molecule to be choosen to recombine and if the molecule can undergo intramolecular recombination, recombination is com- pleted. The probability of meeting and recombining between two molecules is called Rinter. When recombi- nation occurs, it takes place at random between all the possibilities. With the system of circles used, two circles share always at least one recombining sequence.
Intermolecular selection: One of the assumptions of the model is that within a given mitochondrion, some molecules replicate more than others because of the high density of replication origins that they carry. In the system used in this study, there are only four types
of circles: circles that do not replicate (no replication origin), circles with one region with the origin and three regions with coding sequences (among which are the two master circles), circles with one region with origin and one region with coding sequences (called small selfish molecules), and large circles with two ori- gins (large selfish circles). Therefore, there is a differ- ence in the density of replication origins between selfish circles and large circles with just one replication origin when they replicate within the same mitochondrion. The fitness of selfish molecules relative to molecules having one origin of replication for three regions with coding sequences is assumed to be r, with r 2 1. The higher the value of r, the stronger the molecular selec- tion. Therefore, the fitness of a molecule, Wmolpcule can be expressed as:
Wmolecuk = 0 if the molecule has no replication origin (circles 8, 10, and 11 in Figure 2),
Wmoleczlle = 1 if the molecule has three regions with coding sequences and one origin
(master circles 1 and 7),
WmOlpmk = r if the molecule is selfish
(circles 2, 5, 6, 12 and 14). (1)
Intercellular and intermitochondrial selection: In- tercellular selection was modelled in two ways: either a truncated or a probabilistic selection. In the truncated cellular selection, it is assumed that only a fixed number
x of best cells (higher fitness) divide and the same num- ber of worst cells are eliminated. In the probabilistic cellular selection, the probability for a cell to divide corresponds to its relative cellular fitness, x cells are chosen. The same number x of cells is chosen to die with a probability corresponding to its relative cellular fitness. In both cases, a cell is composed of a set of mitochondria, and the cell population is constant (50 cells). Molecules are randomly distributed between the
two daughter cells (BIRKY 1983). A good cell [high cellu- lar fitness (Wceu)] possesses good mitochondria [high mitochondrial fitness ( Wmi,,)]. This can be simulated using the following equation:
W e l l =
c
W m d j ) . (2) iFIGURE 2.-Population of mitochondrial molecules. A mitochondrial genome containing several regions was chosen. The
different regions are as follows: ori, a, b, c, 1 and 2. o n contains the replication origin and other sequences not useful; a, b, c
are long regions (containing coding and no coding sequences), and 1 and 2 are direct recombining repeats. The gray arrow
represents the recombining sequence 1 and the black one, the recombining sequence 2. The orientation of the sequence is
indicated by the direction of the arrow. The master circle 1, whose sequence composition is lori2alb2c generates circles 2-14
through recombination between the recombining sequences. Lines relate circles that generate each other through recombina- tion. The numbers above the line indicate which type of recombining sequence is involved in the recombination. The end of the line indicates whether the recombination event happens within or between molecules (for example, from circles 2 and 3
to 1 the recombination is intermolecular, and from circle 1 to 2 and 3 the recombination is intramolecular). Shaded circles
contain complete mitochondrial information, i.e., are master circles. Circles 2 and 5 are called small selfish circles, and circles
374 B. Albert et al.
Well-functioning mitochondria require a certain amount of genetic information, which means at least a minimum of all regions. A mitochondrion is assumed to contain 10 circles chosen randomly between all the cell’s mt circles (BIW 1983). The repartition of the molecules is done after the recombination process and before replication ( i . e . , the selection). A good balance between all the mt regions is considered necessary to have a good mitochondrion. If one region is missing, the mitochondrion cannot function (no replication). It is possible to obtain such a pattern by considering that the contributions of every region interact multi- plicatively to give the mitochondrial fitness. W.,,i: repre- sents the contribution of a region ( 2 ) to the fitness of a mitochondrion
( j ) ,
the mitochondrial fitness ( Wrnil,,)can be modelled as the product of the contribution of each type of region:
Wn,,,
( j ) =n
w,
( i d . ( 3 ),
If some regions are less represented than others, the mitochondrial fitness is decreased. However, the mito- chondrion can be complemented by other mitochon- dria, Le., the lack of a sequence in a mitochondrion can be compensated for by the presence of this sequence somewhere else in the cell (suggested by OLIVER and WALLACE 1992). Complementation can occur during fusion of mitochondria or maybe by transfer of gene products from one mitochondrion to another (the ac- tual mechanism is not known, but exchanges have been detected). We modelled this phenomenon by consider- ing that the contribution of a region to the mitochon- drial fitness is influenced by the overall frequency of this region in the cell. The negative effect of the lack of a region in a mitochondrion is more drastic when this region is rare in the cell. The way we calculated
Wr,(i,j) allows us to model this effect. W,pK(i,j) is maximal (equal to one) if the mitochondrion has its optimum number or more of region i (see Equation 4). If there is less than the optimum number of a region in the mitochondrion, the contribution of the region ( Wrpg) to the mitochondrial fitness decreases (when N,,,,, - N,,,‘/(i)
increases, WVpg(i,j) decreases). The contribution de- creases the rarer the region is in the cell, Le., when the frequency within the cell of the region i (Nc,, (2)) rela- tive to the commonest region in the cell ((Ncyeg(z)) de- creases, Wreg(i,j) decreases, (see Equation 5). Therefore,
Wrvg(i,j), the contribution of the region to the W,,atL,, can be calculated as follows:
if N A i )
>
N P f ,then WTpg(i,j) = 1, (4)
else wrPg(i,j) = [ N C ~ ~ ~ ( ~ ) / N C , , ( ~ ) I ‘ ” ~ , ~ I ~ ” ~ ~ ~ ~ ~ ~ ‘ ‘ , ’ ” > ( 5 )
with
Nc,,(i)
= number of regions i in the cell, N,,,,l =optimum number of regions in the mitochondrion to
have a well-functioning unit and
N,,,(i,
j )
= real number of regions( i )
in the mitochondrion( j ) .
The replication of a molecule within a cell depends on the type of this molecule and the mitochondrion containing this molecule. The ability of a molecule to replicate is expressed by W,n,,lpcuk (explained earlier). The replication takes place inside mitochondria. Mito- chondrial selection is expressed by considering that rep- lication of a given type of molecule is proportional to the quality of the mitochondrion (measured by WtnL(,,)
containing the molecule. Moreover, since cellular re- sources used for mt replication are limited (suggested by BIRKY 1994) and allocated to each molecule, the more replication origins within a cell, the less the repli- cating ability conferred by each individual origin. The replicative rate of a molecule (Rmokulv) is therefore sup- posed to be inversely proportional to the total number of replication origins within a cell. This can be mod- elled using the following equation:
Knol*(
til? = W , U L O * W m o k I&* k/Nc,ri, (6)where Wr,Llrl,, represents the ability of a mitochondrion to replicate its molecules (see Equation 3), W,,toku[p rep- resents the ability of a molecule to replicate (see Equa- tion 1 ) , k is a constant expressing the total amount of resources allocated to mitochondrial replication in the cell, and Nc,, is the number of replication origins in the cell. The number of copies produced for a given molecule was computed from a Poisson distribution us- ing the replication rate &,L,,le,ILD as a parameter.
The absence of an intermitochondrial selection level was simulated in the same way but instead of having a mitochondrion with randomly chosen circles, we de- fined an average mitochondrion. An average mitochon- drion is composed of an average frequency of all the sequences present in the cell. Wnlif,, and W,, were calcu- lated in the same way.
RESULTS
Two-level model with intermolecular and intercellu- lar selection; maintenance of the mitochondrial infor- mation: The maintenance of mt information strongly depends on the strength of intermolecular selection. For values of r (the relative fitness of selfish molecules) greater than a threshold value lying between 1.2 and
1.4, selfish molecules always increase in frequency; the cell fitness decreases at the Same time (Figure 3). The cell fitness is close to zero, but there are still some molecules in the cells. The percentage of selfish circles is high, but some master circles and others are still present. When the advantage of selfish circles decreases
( r decreases and is close to 1.2-1.4, simulations 1 to
8 Table l ) , the information can be maintained (the intermolecular selection pressure decreases).
Mitochondrial
1 0 0 , 1
70
50
40
t
30 20
10
-
W cell” P e r c e n t a g e of selfish circles
0
0 50 100
FIGURE 3.-Loss of mt information with two levels of selec- tion. The simulations were done with molecular and cellular selection levels. The percentage of selfish circles (circles 2, 5, 6, 12 and 14) is shown over the generations. The average fitness of the cell population is represented over the genera- tions. The selfish circles increase and W,, decreases at the same time. Finally, there are not enough molecules in the cells, so these go extinct. The simulation parameters are as
follows: r = 2, R , . , , = &,,lra = 0.1, x = 5, Nwt = 3, no mt
selection and truncated cellular selection.
depends on parameter values (see simulations in Ta- ble l ) a n d o n t h e
type
of cellular selection. When the optimum number for one type of region in a mito- chondrion increases (simulations 1 - 2 ) , the informa- tion is lost more easily. An increase in intermolecular recombination rate leads to an increase in averageGenome Dynamics 375
fitness of t h e cell population (simulations 2-4). An increase in intramolecular recombination rate gives rise to a decrease in average cellular fitness (simula- tions 2-3). When the number of cells that divide in- creases, the equilibrium state of the cellular fitness is reached less rapidly. The threshold value for the maintenance of mt information is always higher under truncating selection than under probabilistic selec- tion (simulations 2-6).
Three-level model, with intermolecular, intermito- chondrial and intercellular selection; maintenance of the mitochondrial information: The mt information is always maintained with these three levels of selection. For every simulation, whatever the parameters (we tested values of r up to
2 ) ,
the average fitness of the cell population reaches an equilibrium with n o loss of information. This equilibrium does not depend on the initial composition of circles within the cell population. In Figure 4, three simulations are shown, starting with three different circle compositions in the cells. T h e same equilibrium of cell fitness is reached.Influence of parameters: See the simulations in Table
1. T h e average fitness of the population of cells can vary up to fivefold according to the parameters. The average fitness of the cell population decreases when there is a n increase of the optimum number of regions needed in a mitochondrion to be a well-functioning unit (simulations 9-12). This effect can be explained by the fact that when little information is needed, a mitochondrion is more readily “good” and as a conse- quence the average fitness of cells is higher. An increase
TABLE 1
Influence of the parameters
Truncated Average of Average Average of the
Mitochondrial cellular no. of percentage of
Simulation selection selection r ELn, Nwf x
W,,,
W,,,, circles master circles1
+
1.4 0.1 0.1 3 5 0 150 52
+
1.4 0.1 0.1 1 5 2.5 460 33
+
1.4 0.1 0.3 1 5 1.5 260 34
+
1.4 0.3 0.1 1 5 3 490 35
+
1.4 0.3 0.3 1 5 2 330 36
7
+
1 0.3 0.3 3 5 5 260 190 28
+
1.2 0.3 0.3 3 5 0 150 8 59
+
+
2 0.1 0.1 3 5 18 0.34 56010
+
+
2 0.3 0.1 3 5 18 0.35 520 6 811
+
+
2 0.1 0.3 3 5 10 0.24 450 612
+
+
2 0.1 0.1 1 5 47 0.55 870 513
+
+
2 0.1 0.1 3 15 18 0.34 560 1114 2 0.1 0.1 3 5 10 0.31 350 5
-
-
- -
-
- - 1.4 0.1 0.1 1 5 1
-
-
+
-376 B. Albert et al.
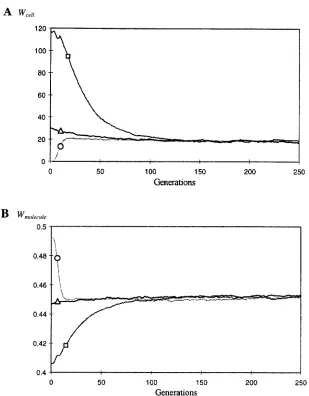
0 50 100 150 200 250
Generations
FIGURE 4.-Maintenance of mt information with three levels of selection. The simulations were done with molecular, mitochondrial and
cellular levels of selection. (A) The average
fitness of the cell population is represented over the generations for three various initial proportions of the different circles. It reaches an equilibrium, with no loss of information,
whatever the initial situation. (B) The mean
molecular fitness, here equal to the number of replication origins per sequence, is shown over the generations. Intercellular and inter- molecular fitnesses stabilize simultaneously.
The simulation parameters are as follows: r =
2,
KnLm
= R,,,,, = 0.1, x = 5, N,, = 3, mt selec- tion and truncated cellular selection (this sim-ulation correspond to the simulation 9 in Ta-
ble l ) . T h e initial composition of circles are as follows: the simulation with the square has 447 master circles, 774 small selfish circles, 185 large selfish circles, 50 small circles with no origin of replication; the simulation with the
triangle has 127 master circles, 412 small
selfish circles, 184 large selfish circles, 14 small circles with no origin of replication; the simu- lation with the circle has nine master circles, 275 small selfish circles, 36 large selfish circles.
0 50 100 150 200 250
Generations
in the number of cells that divide at each generation does not affect the final equilibrium (simulations 9- 13), but this equilibrium is reached faster. Probabilistic selection leads to higher values of cell fitnesses variance and to lower values of mean cell fitness (simulations 9-
14). Recombination rates also have an effect on cell fitness. Cell fitness decreases with an increase of the intramolecular recombinations (breakdown of mole- cules, simulation 9-1 1) and decreases or stays the same with an increase of the intermolecular recombination rate (fusion of molecules, simulations 9-10).
The average fitness of the molecules reaches an equi- librium when the average fitness of the cells stabilizes (Figure 4B). Cellular and molecular fitness stabilize at the same time (Figure 4).
Master circles and mt information maintenance: The total number of molecules within a cell has an important role for cell fitness. The average fitness of the cells is highly correlated with the average number of circles within a cell, whatever the parameters (Spearman corre- lation coefficient of 0.95, P
<
0.001). This is calculated from different simulations with various sets of parame-ters, an average value per simulation is used. The aver- age total number of circles within cells reflects the fit- ness of cells. Master circles are not essential for maintenance of the mt information. Indeed, even when master circles represent a few percent of the circles present in the cells, the mt information can be main- tained (Figure 5). When master circles are nearly ab- sent, circles 9 or 13 are present in high proportions. When the number of sequence needed to get a well- functioning mitochondrion ( N q t ) is lower, the number of selfish circles increases and the number of master circles decreases.
Equilibria of mitochondrial molecules with two or
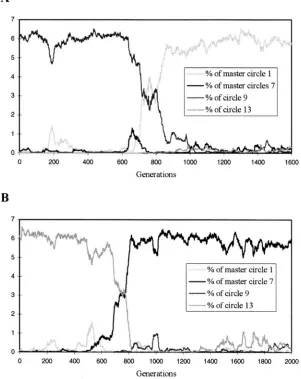
three levels of selection: An equilibrium of molecules is defined by a constant stoichiometry of the molecules over a large number of generations. Two situations can be observed concerning equilibria of molecules: either there is only one state (Figure 6B) or four different equilibria can be observed (Figures 5, A and B, and 6 ) .
Mitochondrial Genome Dynamics 377
A
7
6
5
4
3
2
1
0
I
B
7
6
5
4
3
2
1
0
-YO of master circles 7
-
% of circle 90 200 400 600 800 olo0 1200 1400 1600 Generations
-
% of master circle 7 YO of circle 9-I."-YO of circle 13
I t
0 X K ) 400 600 800 lo00 1200 1400 1600
Generations
characterized by the abundance of master circle 1 and a low frequency of master circle
7.
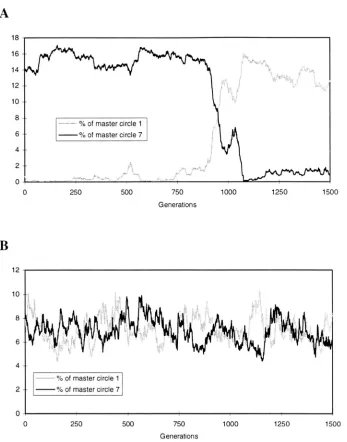
The second equilib- rium state is characterized by a high frequency of mas- ter circle 7 and a low frequency of master circle 1 (Fig- ure 6). The third and the fourth equilibria (Figure 5, A and B) are characterized by a low frequency of both master circles and a high frequency of circles 9 or 13. In all cases, the transitions from one equilibrium to another are not accompanied by a decrease of the fit- ness of the population of cells. The four different types of equilibria are reached randomly, not in a regular pattern.Influence of the paramten: The frequency of change of equilibrium depends on the recombination rates: the higher the recombination rates, the higher the tran- sition number from one equilibrium to another. When these transitions become very frequent ( R i n h and
entra
close to 0.2), equilibria can no longer be distinguished (Figure
7).
There is only a continuity of states, and one can go from one to another with high probabilities (Figure 6R). The type of equilibria do not depend on the type of cellular selection (truncated or probabilis-1800 2ooo
FIGURE 5.--Equilibria of molecules with a low frequency of master circles. The mt information can be maintained with few master circles in the
population. The percentage of master circles and
the percentage of circles 9 and 13 are represented
over the generations. (A) Two equilibrium states
are shown. In the first one master circles are
abundant and circles 9 not, in the second one
circles 9 are abundant and master circles are in
low frequency. A transition from these two equi-
libria is shown. ( R ) Two equilibrium states are shown. In the first one master circles are abun-
dant and circles 13 not, in the second one circles
13 are abundant and master circles are in low
frequency. A transition from these two equilibria is shown. The simulation parameters are as fol- lows: r = 2, R,,,m = 0.08, R,,,lro = 0.08, x = 5 , Nwl
= 1, mt selection and truncated cellular selection.
tic), the number of cells that divide ( x ) and of the replicative advantage of selfish molecules ( r ) . The mito- chondrial selection (A$,!) has an influence over the type
of equilibria. That is, if the mitochondrial selection is
low, some equilibria between the two master circles and
one another (circle 9 or 13) are possible, but if the mitochondrial selection is high, the equilibria of mole- cules concern only the two master circles. The value of the equilibria depends on the type of cellular selection and on the strength of the mitochondrial selection, but exactly the same equilibria values are obtained for different advantages of selfish molecules (when there are three levels of selection) and for various values of the number of cells that divide.
DISCUSSION
378 B. Albert et nl.
A
16
14
12
10
8
6
4
2 / "X" .."'P 2'
-
.I. %,... <*>a,.'
0 ^1 ">-
.
."
0 250 500 750 1000 1250 1500
Generations
B
13
.-
I
FIGURE 6.-Equilibria of mole- cules. (A) The average percentage of the two different master circles (cir- cles 1 and 7) of the cell population are represented over the generations
for low recombination rates (0.1). Two different equilibrium states are shown with one type of master circle abundant and the other one in low frequency. There is a transition from one equilibrium to the other one.
(B) The average percentage of the two master circles are represented over the generations for high recom- hination rates. There is only one state with equal proportions of both cir- cles. The simulation parameters are as follows: r = 2, R,,,,,, = R,,,,,,, = 0.1
N,,,,, = 3, mt selection and truncated cellular selection.
(A), R,rttm = R w r o = 0.6 ( B ) , X = 5,
0 - I I
0 250 500 750 1000 1250 1500
Generations
In the two-level selection model (with intermolecular and intercellular levels of selection), when there is a
significant advantage to selfish circles in intermolecular selection, the average fitness of cells is close to zero. In the model, we have assumed that recombinat.ion and replication of molecules occur only once per genera- tion. If they occur more than once, the advantage of selfish circles will probably be higher. When the average fitness of cells is close to zero, cells cannot divide, and thus the population of cells becomes extinct because information in molecules contained in the mitochon- dria is not sufficient to give a functional cell. Selfish circles invade the cell because the selection at intercel- lular level cannot compensate for the high advantage given to selfish sequences in intermolecular selection. Nevertheless, when the advantage of selfish circles is smaller than a threshold value ( r near 1.3, depending on the parameters), they cannot invade and the infor-
mation can be maintained. This does not seem plausi- ble since they are more than two times smaller and contain the same number of replication origin as mas- ter circles.
In the three-level selection model (with intermolecu- lar, intermitochondrial and intercellular selection), the maintenance of the entire mt information within cells is possible even for high values of the advantage for selfish circles ( r ) . This maintenance is possible without
a replicative advantage for the master circles, as as- sumed in ATIAN and COL'VET'S (1993) model. Although there are very few data on the way the molecules repli- cate, a replicative advantage for the master circle is controversial. With the exception of DE HAAS et al.
(1993) who suggest that only master circles replicate,
other authors have suggested that several molecules within mt genome can replicate (FOLKERTS and H A N -
Mitochondrial Genome Dynamics
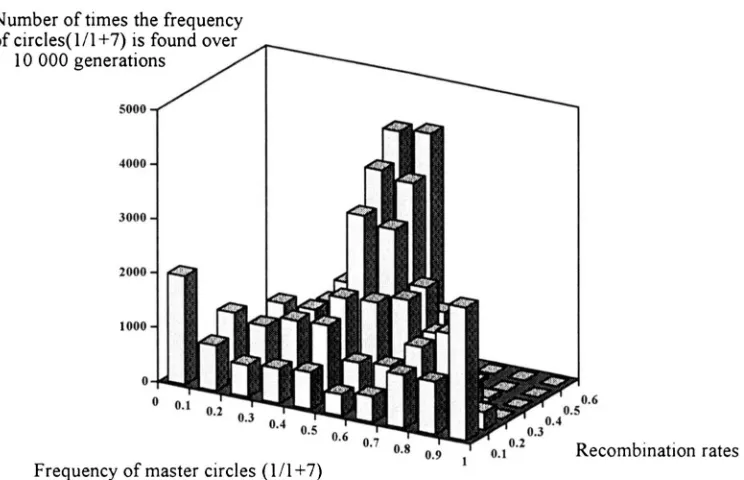
Number of times the freauencv
379
ofcirc1es(l/l+7) is found ov 10 000 generations
5000
/ I
rates Frequency of master circles (1/1+7)
_._
FIGURE 7.-Transitions between equilibria. The distribution of the frequencies of master circle 1 over master circles 1 and 7 are represented for 10,000 generations for different recombination rates (from 0.1 to 0.7). At high recombination rates, the
two equilibria of circles cannot be observed, the circles 1 and 7 are prcsent i n the same proportions. M%ereas at low recombination rates, the two equilibria of circles can be observed. This picture is quite similar to that obtained for frequency distribution at a neutral diallelic locus with different levels of drift mutation balance: when mutation is more important than drift, one observes the pattern corresponding IO high recombination rates, and when drift is more important than mutation, one observes the pattern corresponding to l o w recombination rates. The simulation parameters are as follows: r = 2, x = 5 , N,,,,, = 3, mt selection i n d tnlncated’cellula;‘ selection.
1993). There is some evidence as well in yeast for differ-
ential replication of the mitochondrial molecules where selfish molecules replicating faster than others invade the cell by this mechanism (BLANC and D U ~ N 1980;
DE ZAMAROCZY et nl. 1981). T h e replication mechanism
is still unknown. Nevertheless observations of RENDICI I
and SMITH (1990) on watermelon and cauliflower sug-
gest 2 rolling circle mechanism generating linear mole-
cules. Linear tails on circular molecules of all sizes has been observed, suggesting that the rolling circle mecha- nism is also valuable for subgenomic molecules. In o u r model all molecules are circular and then can replicate by a rolling circle mechanism. The mt genome is likely composed of linear and circular molecules, but linear molecules unable to become circular would not repli- cate with this process and thus have little effect on the dynamic of molecules.
T h e existence of an intermitochondrial level of selec- tion (corresponding to intracellular selection) was pointed out using antibiotics in different organism: yeast and Paramecium (see BIRKY 1994 for a review). Antibiotic-resistant mitochondrial mutants were se- lected in the presence of an antibiotic. As RIRKY inter- preted “when antibiotic-sensitive cells are exposed to
the antibiotic, [mt] chromosomes with rare spontane- ous resistant mutant genes continue to replicate until there are enough to make the cell phenotypically resis- tant. And when heteroplasmic cells with a mixture of
resistant and sensitive genes are produced by mating, artificial cell fusion, o r microinjection and are exposed
to an antibiotic, they produce only homoplasmic resis- tant progeny”. T h e resistant mitochondrion has repli- cated more than the others and has then produced a phenotypically resistant cell. That does not “prove” but is in favor of the existence of an intermitochondrial level of selection. The mutation for antibiotic resistance should not modify the replication rate of the molecule that carries it but should give an advantage to the mito- chondrion containing it.
T h e average fitness of the cells is higher when the recombination rates are low, therefore one would ex- pect selection at a cellular level to act for a decrease in the recombination rate. On the other hand, selection at the mitochondrial level would act for an increase of the intermolecular recombination rate. Indeed R,,,, and Rj,,/,,, the hvo recombination rates, have an im- portant effect on the stoichiometry of the molecules. When R,,,,.,, (breakdown of molecules) increases, the number of selfish molecules increases and the fre- quency of large selfish molecules (dimer of small selfish circles: circles 6 , 14, 12) decreases. In contrast, when
e,,,,,.
increases, the small selfish molecules decrease and the large selfish molecules increase in frequency. T h e average fitness of the cells decreases with an increase380 B. Albert et al.
crease of
&,,,
but increases with an increase of &.ntw.This is due to the cellular limitation of resources for replication, i.e., the efficiency of each replication origin. When Rzntp, increases the number of circles 6, 12, and
14 possessing two replication origins increases, there- fore the total number of molecules decreases and then
W,, decreases.
Role of master circles
and
stoichiometry of mitochon-drial molecules: Master circles contain all the mito- chondrial information and can generate all the other molecules by recombination. Therefore, they could play an essential role in maintaining mt information. Simulations show however that this not the case: the cell fitness is not affected when the number of master circles vary. For low mitochondrial selection they can be nearly totally replaced by some combinations of mol- ecules with a sufficient density of replication origins and a sufficient amount of coding sequences. For exam- ple, the circles 9 and 13 (Figure
2)
have one replication origin and three regions containing coding sequences (as master circles), but circle 9 bears two a regions and no c region, whereas circles 13 bears two c regions and no a region. The important thing is the amount of information present in the cell whatever its organiza- tion on the molecule. From experimental data, BEN-DICH (1985) deduced the same idea: “it is relatively unimportant how plant mt genomes are arranged physi- cally as long as essential sequence information is pres- ent”. There is a significant correlation between the total number of circles and the fitness of the cells. Neverthe- less, in our model, the proportion of master circles in cells increases with an increase of the amount of information needed for a mitochondrion to be func- tional. Since master circles contain the whole informa- tion in a linked state, this information remains linked from generation to generation. Therefore when the need of information to get a well-functioning mitochon- drion increases, master circles increase in fre- quency, As SZATHMARY and MAYNARD-SMITH (1993) and
MAYNARD-SMITH and SZATHMARY (1993) have demon- strated, cells with linked genes gain a large competitive advantage over the others because their offspring re- ceives a full set of genes. Another process that would keep the information linked would be a recombination process leading to intertwined molecules, as observed in Escherichia coli.
When Nopl decreases, i e . , mitochondria need less mt information to function well, the mt fitness increases for a given information content and the mtDNA will replicate more. Therefore, the less information mito- chondria need, the more mtDNA molecules are pres- ent. As a consequence, there is no direct relationship between the need for mt information and the amount of mtDNA. Our model suggests that the number of circles depends on the resources of the cell and not on the need mitochondria and cells have for circles. Such
a reason for the presence of high and variable numbers of mt molecules within cells is quite different from the functional explanations given by other authors. For ex- ample, BENDICH suggested in 1987 that the very high genome copy number in organelles must reflect an in- creasing need for organellar ribosomes that can only be satisfied by an increase in ribosomal RNA gene num- ber that results from genome multiplication. We argue that an increase in the need for mt sequences would have more complicated consequences: selection against selfish molecules would decrease mt molecule numbers and increase the quality of the molecules (higher pro- portion of master circles).
Equilibria of molecules: Concerning the stoichiome-
try of molecules, two situations can be observed. Either it is approximately constant, or different stable stoichi- ometries are found. An equilibria of molecules is defined by a constant stoichiometry of the molecules over a large number of generations. When there are different equi- libria, with the simple system of circles used in this study with only two master circles, four different molecular equilibria can be defined. These stable stoichiometries correspond to dynamic equilibria stable over a large number of generations. Two of them differ in the pro- portions of the two master circles, one being abundant and the other one in low frequency and vice versa. The other two equilibria have few master circles and a lot of circles 9 or 13 (Figure 2). The shift between equilibria is neutral (the fitness of cells is constant). The number of transition from one equilibrium to another is linked to the recombination rates. With low recombination rate, the three different equilibria defined above are well de- fined: the mt genome remains a long time in one state. An increase in recombination rates gwes rise to an in- crease in transition frequency, with only one state where the two master circles are in almost equal proportions (Figure
7).
As a consequence, the dynamics of the system can be understood as a drift-mutation equilibrium, muta- tion being the assimilating to recombination and drift corresponding to sampling fluctuations in circle num- bers. Selection only defines what types of combinations are possible but has no effect on the shift from one equilibrium to another, that occurs without variations in cell fitness. The two cases (either one stable state or four equilibria with low number of transition between each other) are then similar to what happens at a neutral diallelic locus submitted to recurrent mutation and drift (ROUGHGARDEN 1979). If mutation is high relative to drift, one observes only one state, with an intermediate allelic frequency. At the opposite, if mutation is low rela- tive to drift, one observes mainly one of the two mono- morphic equilibria, and sometimes transitions occur be- tween them (Figure 7).Mitochondrial Genome Dynamics 38 1
the model of ATLAN and C O ~ T (1993), where differ- ent equilibria depending on the recombination rates were observed as well. However, in their model, some recombining sequences recombine less than others and the switch from one equilibrium to another one induces lower fitness than in the equilibrium states.
Conclusion: The intermitochondrial level of selec-
tion plays an important role in maintaining the entire mitochondrial information in cells. Therefore mito- chondria should be relatively individualized during the cell cycle. Master circles are not essential for the mainte- nance of mt information. When the information is
maintained, several equilibria of molecules can be ob-
served. Usually the recombination rates and/or the rep- lication rates are considered to be the only parameters involved in the change of equilibria of molecules ob-
served experimentally. From our point of view, several processes may be responsible for the different equilibria observed. Some equilibria may be due to drift-mutation mechanisms when the effect of sampling fluctuations of circle number is more important than the effect of recombination. In addition to the role of replication and recombination rate, changes of equilibria can be due to a change in the selective pressure. This is proba- bly observed frequently in in vitro culture. One example is the reversible changes in the composition of the pop- ulation of mtDNA during dedifferentiation and regen- eration in tobacco observed by KANAZAWA et al. (1994). Other changes of equilibria observed experimentally may be due to a change of the possible circles of the system: deletion or addition of sequences, which have not yet been modeled.
We thank all the students who worked on this model: N. LAFAY, S. ROZENFELD and T. CLFROT. We thank particularly J. MAwm SMITH who gave a first project on this subject to B. ALBERT during an Euro- pean exchange supported by a n E m m u s grant. For helpful discus- sions and comments we thank M. HANSON, C. W. BIRKY, JR., I. SWL, C. SMALL-COLLAS DES ~ C SD. COUVET, , F. VEDEL and C. LELANDAIS.
LITERATURE CITED
ANDRE, C., A. LEW and V. WALBOT, 1992 Small repeated sequences and the structure of plant mitochondrial genomes. Trends Genet. 8: 128-132.
A U , A., and D. COLIVET, 1993 A model simulating the dynamics of plant mitochondrial genomes. Genetics 135 213-222. BELLIARD, G., F. VEDEL and G. PELLETIER, 1979 Mitochondrial re-
combination in cytoplasmic hybrids of Nicotiana tabacum by pro- toplast fusion. Nature 281: 401 -403.
BENDICH, A. J., 1985 Plant mitochondrial DNA unusual variation on a common theme, pp. 11 1 - 138 in Genetic Flux in Plants, edited by B. HOLN and E. S. DENNIS.
BENDICH, A. J., 1987 Why d o chloroplasts and mitochondria contain so many copies of their genome? BioEssays 6: 279-282. BENDICH, A. J., and L. P. GAURILOFF, 1984 Morphometric analysis
of cucurbit mitochondria: the relationship between chondriome volume and DNA content. Protoplasma 119: 1-7.
BENDICH, A.J., and S. B. SMITH, 1990 Moving pictures and pulsefield gel electrophoresis show linear DNA molecules from chloroplast and mitochondria. Curr. Genet. 17: 421-425.
BIRKY, JR., C. W., 1973 O n the origin of mitochondrial mutants: evidence for intracellular selection of mitochondria in the origin of antibiotic-resistant cells in yeast. Genetics 74: 421-432. BIRKY, JR., C. W., 1983 The partitioning of cytoplasmic organelles
at cell division. Int. Rev. Cytol. 1 5 49-89.
BIRKY, JR., C. W., 1994 Relaxed and stringent genomes: why cyto- plasmic genes don’t obey mendel’s laws? J. Heredity 85: 355- 365.
BIANC, H., and B. DUJON, 1980 Replicator regions of the yeast mito- chondrial DNA responsible for suppressiveness. Proc. Natl. Acad. Sci. USA 77: 3942-3946.
BRENDEL, V., and L. A. SEGEL, 1987 O n modes of recombination, replication, and segregation of the higher plant mitochondrial genome. J. Theor. Biol. 125: 163-176.
CONDIT, R., and B. R. LEVIN, 1990 The evolution of plasmids carrying multiple resistance genes: the role of segregation, transposition and homologous recombination. Am. Nat. 135:
573-597.
COSMIDES, L. M., and J. TOOBY, 1981 Cytoplasmic inheritance and intragenomic conflict. J. Theor. Biol. 8 9 83-129.
DOOLITTI.E, W. F., and C. SAPIENZA, 1980 Selfish genes, the pheno- type paradigm and genome evolution. Nature 284 601-603. FOLKERTS, O., and M. R. HANSON, 1991 The male sterility-associ-
ated pcfgene and the normal atp9-1 gene in Petunia are located on different mitochondrial DNA molecules. Genetics
DE W s , J. M., J. HILLE, F. KORS, B. VAN DER MEER, A. J. KOOL et al., 1991 Two potential Petunia hybrida mitochondrial replication origins show structural and in vitro functional homology with the animal mitochondrial DNA heavy and light strand replication origin. Curr. Genet. 20: 503-513.
HANSON, M. R., and 0. FOIXERTS, 1992 Structure and function of the higher plant mitochondrial genome. Int. Rev. Cytol. 141:
129-172.
JANSKA, H., and S. A. MACKENZIE, 1993 Unusual mitochondrial ge- nome organisation in cytoplasmic male sterile common bean and the nature of cytoplasmic reversion to fertility. Genetics 135: KANAZAWA, A., N. TSUTSUMI and A. HIRAI, 1994 Reversible changes in the composition of the population of mtDNAs dur- ing dedifferentiation and regeneration in Tobacco. Genetics
LEW, A. A., C. P. ANDRE and V. WALBOT, 1991 Analysis of a 120- kilobase mitochondrial chromosome in maize. Genetics 1 2 8
LONSDALE, D., M. T. BREARS, T. P. HODGE, S. E. MELVILLE and W. H. ROTTMANN, 1988 The plant mitochondrial genome: homolo- gous recombination as a mechanism for generating heterogene- ity. Phil. Trans. R. SOC. Lond. B 319: 149-163.
l
MAYNmSMITH, J., and E. SZATHMARY, 1993 The origin of chromo- somes I. Selection for linkage. J. Theor. Biol. 1 6 4 437-446. OLIVER, N. A., and D. C. WALLACE, 1992 Assignment of two mito-
chondrially synthesized polypeptides to human mitochondrial DNA and their use in the study of intracellular mitochondrial interaction. Mol. Cell. Biol. 2: 30-41.
ORCEL L. E., and F. H. CRICK 1980 Selfish DNA the ultimate para- site. Nature 284: 604-607.
PALMER, J. D., and L. A. HERBON, 1988 Plant mitochondrial DNA evolves rapidly in structure, but slowly in sequence. J. Mol. Evol.
QUETIER, F., B. LEJEUNE, S. DELORME andD. FALCONET, 1985 Molecu- lar organisation and expression of mitochondrial genome of higher plants, pp. 25-36 in Encyclopedia of Plant Physiology, New Series, Vol. 18, edited by R. DOUCE and D. A. DAY. Springer- Verlag, Berlin.
ROUGHGARDEN, J., 1979 Theory of Populutim Genetics and Evolutionary Ecotogy: An Introduction. Collier Macmillan, London.
S W L , I., P. ISAAC and J. LEAVER, 1987 Stoichiometric differences in DNA molecules containing the atpA gene suggest mechanisms for the mitochondrial genome diversity in maize. EMBO J. 6:
865-869.
SZATHMARY, E., and J. EvIAWm SMITH, 1993 The origin of chromo- somes 11. Molecular mechanisms. J. Theor. Biol. 164 447-454.
129: 885-895.
869-879.
138: 865-870.
417-424.
382 B. Albert et al.
TAKAHATA, N., and M. SLATKIN, 1983 Evolutionary dynamics of ex- substitution vary greatly among plant mitochondrial, chloro- tranuclear genes. Genet. Res. 42: 257-265. plast and nuclear DNAs. Proc. Natl. Acad. Sci. USA 84: 9054- VITART, V., R DE PAEPE, C. MATHIEU, P. CH~TRIT and F. VEDEL, 1992 9058.
Amplification of substoichiometric recombinant mitochondrial DE ZAMARoCZY, M.3 R. ~ O ~G. AFAUCERON-FOm, , R. ~ U ~ O T ,
DNA sequences in a nuclear, male sterile mutant regenerated M. MAUCIN et al., 1981 The origins of replication of yeast mito- from protoplast culture in Nicotiana sylue.stris. Mol. Cen. Genet. chondrial genome and the phenomenon of suppressivity. Nature
233 193-200. 2 9 2 75-78.