ABSTRACT
SHOUCHE, SURABHI. Supply Chain Operations Reference Model for U.S. Based Powder Bed Metal Additive Manufacturing Processes. (Under the direction of Dr. Richard A. Wysk).
This thesis focuses on modeling the supply chain of an additively manufactured product,
specifically a uniquely customized Total Hip Replacement implant. It explores how the
supply chain could be modeled for hip components which are customized for individual
patients and produced using additive manufacturing processes. The concept of the SCOR
(Supply Chain Operations Reference) model is used to create a formal model of this system
for analysis. It captures the basic structure for interactions between customers, products, and
the market. This model also provides valuable information about the new technology in
terms of procuring the raw materials or supplying components to the manufacturer or the
customer.
The parts built by the AM processes are rough and require finishing for effective functioning
of the part. The aggregate model is divided into finer sections dealing with: 1)
patient-diagnosis, 2) CAD modeling of the uniquely customized implant, 3) the AM-build process,
4) post-processing operations, which are followed by delivery of the implant to the desired
hospital. The SCOR model is used to compare the traditional and the AM supply chain on the
basis of different performance metrics. The formal supply chain model is used to extract
operational activities so that a computer simulation model of the system can be developed.
The simulation is used to model system performance so that bottleneck operations can be
identified and source needs determined along with a sensitivity analysis to analyze how
the device cost is higher, but there is a decrease in the surgical cost, mitigation cost and
© Copyright 2016 Surabhi Shouche
Supply Chain Operations Reference Model for U.S. Based Powder Bed Metal Additive Manufacturing Processes
by
Surabhi Shouche
A thesis submitted to the Graduate Faculty of North Carolina State University
in partial fulfillment of the requirements for the degree of
Master of Science
Industrial Engineering
Raleigh, North Carolina 2016
APPROVED BY:
_______________________________ _______________________________
Dr. Richard A. Wysk Dr. Russell E. King
DEDICATION
To my parents, Dr. Shobha and Sanjay Shouche, for their unconditional love
&
BIOGRAPHY
Surabhi Shouche was born in Ratlam (Madhya Pradesh), India. She spent her early years in
the holy city of Ujjain and went for college to Vellore Institute of Technology, VIT
University to study Mechanical Engineering. After an internship in the industrial sector, her
interests towards Industrial Engineering grew and she decided to pursue her Master’s studies
at North Carolina State University, Raleigh in the Department of Industrial & Systems
Engineering. She began working on her research in the field of Supply Chain and Additive
ACKNOWLEDGEMENTS
I am very thankful to my advisor, Dr. Richard A. Wysk for his constant support and
encouragement. It has been a big learning curve under his direction and this research would
not have been possible without his guidance and faith in me. I would also like to thank Dr.
Ola L. Harrysson and Dr. Russell E. King for their invaluable comments and time, which
helped shape this research.
I would also like to thank my wonderful parents for all the love and support from half way
across the world. Huge thanks to my brother, Sudeep and sister-in-law, Samiksha for always
reminding me that I can. A special mention to my grandfather, Ram Chandra Shouche who
has always showered his blessing on me.
I am very grateful to my friends at NCSU: Bhavya, Utsav, Poorva, Rohit, Vedant, and Rutuja
for sharing, caring and laughing together. Last but definitely not the least, a big thanks to my
friends in India: Paridhi, Utkarsh, and Paritosh for being available through all time zones and
TABLE OF CONTENTS
LIST OF TABLES LIST OF FIGURES
CHAPTER 1 ... 1
INTRODUCTION... 1
1.1 Background ... 1
1.2 Motivation ... 3
1.3 Objectives ... 5
1.4 Summary ... 6
CHAPTER 2 ... 8
RELEVANT WORK ... 8
2.1 Introduction ... 8
2.2 Medical Modeling of Uniquely Customized Devices ... 8
2.3 Statistics associated with Total Hip Replacements ... 14
2.4 Computer Simulation and SCOR Modeling ... 17
2.4.1 SCOR Model ... 17
2.4.2 SCOR Methodology ... 20
2.4.3 Automatic Simulation Model Generation ... 20
2.5 Summary ... 21
CHAPTER 3 ... 23
METHODOLOGY ... 23
3.1 Introduction ... 23
3.2 SCOR Model ... 23
3.2.1 The As-Is Model ... 26
3.2.2 The To-Be Model ... 31
3.3 Simulation Model ... 36
3.4 Summary ... 40
4.1 Introduction ... 41
4.2 Comparisons between ‘As-Is’ and ‘To-Be’ Model: Performance Metrics ... 42
4.3 Comparing the supply chain of “As-Is” and “To-Be” Models... 46
4.4 Simulation Results... 49
4.5 Sensitivity Analysis ... 51
4.6 Cost Analysis... 55
4.7 Summary ... 57
CHAPTER 5 ... 59
CONCLUSIONS AND SCOPE OF FUTURE WORK ... 59
5.1 Introduction ... 59
5.2 Limitations ... 59
5.3 Conclusions ... 60
5.4 Scope of Future Work ... 62
REFERENCES ... 63
APPENDICES ... 66
Appendix A: As-Is Model ... 67
LIST OF TABLES
Table 1 Error analysis report between the STL file and the RP model ... 13
Table 2 Error analysis report between human femur bone and RP model ... 13
Table 3 Reported sources of model inaccuracies at various stages of CT image production ... 14
Table 4 Complication rate % for selected outcomes within 90 days of primary and revision Total Hip Replacement ... 15
Table 5 Distribution of device cost and surgical cost for Total Hip Replacement surgery ... 17
Table 6 SCOR level 2 process categories ... 24
Table 7 Thirteen performance metrics for SCOR ... 25
Table 8 List of resources for "To-Be" model ... 31
Table 9 List of critical resources considered in this simulation ... 38
Table 10 List of performance measures which are improved in the AM "To-Be" model ... 44
Table 11 Resource capacities for the AM model... 50
Table 12 Resource capacities to meet 25% of the annual demand using AM methods ... 52
Table 13 Resource capacities to meet 75% of the annual demand using AM methods ... 53
Table 14 Resource capacities to meet 100% of the annual demand using AM methods ... 53
Table 15 Resource requirements for AM methods to meet 50% of the demand ... 54
LIST OF FIGURES
Figure 1 (Left) The individual components of a total hip replacement. (Center) The components merged into an
implant. (Right) The implant as it fits into the hip. ... 3
Figure 2 Procedure for design and manufacture of implants, surgical aid tools and medical devices ... 10
Figure 3 A framework of preparative planner for custom hip implant ... 12
Figure 4 Percentage of costs for a Total Hip Arthroplasty in which a patient is discharged to home ... 16
Figure 5 SCOR Process Framework ... 19
Figure 6 As-Is: SCOR model for current process for manufacturing hip stems ... 27
Figure 7 Traditional Make process for ‘As-Is’ Model ... 28
Figure 8 Various Levels of SCOR ‘As-Is’ Model ... 30
Figure 9 To-Be: SCOR model for additive manufacturing of hip stems ... 32
Figure 10 AM-build process ... 33
Figure 11 Levels of SCOR ‘To-Be’ Process ... 35
Figure 12 Simulation model for AM manufacturing of hip stems ... 39
Figure 13 Push system for ‘As-Is’ Model ... 41
Figure 14 Pull System for ‘To-Be’ Model ... 42
Figure 15 The “As-Is” supply chain ... 47
Figure 16 The “To-Be” Supply Chain ... 48
Figure 17 Number out in the simulation model ... 49
CHAPTER 1
INTRODUCTION
This chapter is intended to provide a brief overview of additive manufacturing (AM), and
then introduce one possible use of this technology (total hip replacements). The chapter then
moves toward the modeling and development of what the Supply Chain Model (SCM) for
this complex system might look like in the near future. The SCM is important because it can
be used to determine bottlenecks and constraints for the use of this new method of producing
highly customized medical parts. A detailed model of both the engineering and medical
portions of the total hip replacement process will be discussed along with the potential
benefits of using AM parts for joint replacement.
1.1Background
Additive manufacturing (AM), also known as 3D printing provides engineers the capability
of producing objects of virtually any shape or geometry by depositing successive layers of
suitable material using computer control. AM is currently being used for low volume
production and building prototypes; however, AM is slowly moving to commercial products
requiring personal customization. The industries which have been impacted the most by AM
technology are healthcare, aerospace and automotive. Considering the overall market size for
all the AM technology like printers, materials and printing services; the AM industry has
AM technology can have a huge impact on the manufacturing industry from design to
production. Transportation and storage could be significantly reduced and made less
expensive as the manufacturing could be done on-site. With the advent of additive
manufacturing, the future supply chain will be faster, cheaper and more compact. Parts
whose shipments are typically expedited will potentially be manufactured in-house,
eliminating delivery, inventory and order charges. The future supply chain will have fewer
completed parts in storage and product flow. One of the future supply chain foci will be to
move from part supply to material and machining supplies for additive manufacturing.
The enhanced product customization that comes with an additive manufacturing process suits
the best for the needs for the medical device segment. The devices can be uniquely
customized according to the patient’s needs, which results in better fit and lesser surgical
complications. This thesis focuses on creating a formal model of the supply chain for an AM
produced part, using a Total Hip Replacement (THR) implant as the example product. It also
evaluates how responsive is the entire supply chain from the patient’s diagnosis with a need
for an implant to the accomplishment of actual surgical procedure.
Total Hip Replacement surgery, also known as Total Hip Arthroplasty (THA), is the process
of removing damaged bone and cartilage and replacing it with prosthetic components [2].
The damaged femoral head is removed and a metal stem is substituted, which
is used to support a synthetic cortical head.
A metallic or ceramic cortical head is used at the top of this stem which takes
An acetabulum, which is the damaged pelvis component, is replaced by metal
socket.
A spacer which is made up of plastic, ceramic or metal is inserted between the
ball and the socket to allow smooth movement between the surfaces.
Figure 1 (Left) The individual components of a total hip replacement. (Center) The components merged into an implant. (Right) The implant as it fits into the hip. [2]
Source: http://orthoinfo.aaos.org/topic.cfm?topic=a00377
1.2 Motivation
Medical devices are viewed as one of the largest markets for AM parts because future
devices can potentially be customized specifically for individual patients. To demonstrate
formulation of a detailed production and medical implant simulation model. Approximately,
332,000 Total Hip Replacement surgeries are done per year in the United States alone [3].
Currently, the implants that are being used commercially are traditionally manufactured
which offer practically no customization according to the patient’s bone structure. For every
100 THR surgeries, about 18 revision surgeries have to be performed [4]. Some of the major
reasons for a revision surgery are:
Aseptic Loosening (75%)
Infection (8%)
Dislocation (6%)
Fracture (5%)
Technical errors (3%)
Other reasons (3%)
If an additively manufactured implant is used in place of a regular implant, following
improvements are anticipated, owing mostly to the better fit on the uniquely customized
implant:
Lesser chances of aseptic loosening and dislocations
Lesser surgical and post-discharge costs
Decrease in pain experienced by the patient
Enhanced life time of the implant
It has been observed that the revision surgeries have far worse functional outcomes than
primary surgeries. Surgeries that are performed using a traditionally manufactured implant
The mortality rate, which is defined as the risk of death in the first 90 days of the surgery, is
nearly 1% for a primary THR surgery as opposed to a 2.5% for a revision surgery [5]. A
uniquely customized implant built by AM processes are predicted to last much longer. This is
particularly beneficial for younger people who have to undergo this procedure.
It is our opinion that by customizing the hip stem, two major positive medical outcomes will
be realized: 1) the surgical time will be shortened as the prosthetic will better fit the patient’s
bone geometry (thus, reducing the risk of infection and the total cost of the procedure), and
2) aseptic loosening for patients will be significantly reduced as a function of the geometric
match with the femur medulla. This thesis will examine future manufacturing practices
assuming a shift from traditional to AM bases processes. A tool, called SCOR (Supply Chain
Operations Reference) is used to create a process reference model which explores how the
supply chain will react if half of the traditionally manufactured implants are produced using
AM processes.
1.3 Objectives
The objective of this research is to develop a SCOR based model for medical application and
production of a uniquely customized hip stems for Total Hip Replacement implants. A SCOR
model consists of five distinct management practices, namely Plan, Source, Make, Deliver,
and Return. It captures the ‘as-is’ state of a process and derives the desired ‘to-be’ future
state. The ‘as-is’ state is described by the traditional manufacturing process, while the ‘to-be’
its desired ‘to-be’ state. The utility of components such as a hip stem is highly increased if
they are made uniquely customized. As the future of this supply chain will move from
traditional to AM processes, it is crucial to have a formal model that can analyze the new
chain and extract important operational activities.
A simulation model is developed in Chapter 3 that uses the SCOR model to imitate the
operations of the AM based supply chain. The model is developed using Arena and
reasonable assumptions are made to identify resource capacities for the future. Resource
capacities include the amount of powder required to build these hip stems, number of
machines required to build these implants and number of medical engineers needed for the
design and engineering. The bottlenecks for manufacturing are also determined using this
simulation model.
A cost-analysis is performed to compare the costs of the traditional and uniquely customized
implants. As this cost-analysis is done, a trade-off is observed between cost and time for
manufacturing Vs ease and effectiveness of the surgery.
1.4 Summary
The first chapter in this thesis provided an introduction of what this research proposes to
accomplish. The chapter begins with an overview of the engineering impact of the AM
processes and its effect on the supply chain of the future. It explains the surgical procedure
for the medical operations involved in a Total Hip Arthroplasty. The chapter describes the
motivation behind the selection of a hip stem for building a SCOR and a simulation model.
in this thesis consists of the literature review, which will talk about the relevant work that has
CHAPTER 2
RELEVANT WORK
2.1 Introduction
In this chapter, the previous work that has been done in this field of research is presented.
This chapter begins with describing medical modeling of uniquely customized devices. A lot
of notable work has been done to develop patient-specific implants with the help of
technologies like Computed Tomography (CT) and Magnetic Resonance Imaging (MRI).
The techniques of computer simulation and SCOR modeling are also introduced in this
section.
2.2 Medical Modeling of Uniquely Customized Devices
‘Patient-Specific Instrumentation’ (PSI) have been gaining popularity in the recent years
because of its superior fit and design. Maniar and Singhi studied a lot of cases on PSI Total
Knee Arthroplasty (TKA) and compared the performance details of PSI as compared with
conventional and navigated TKA [6]. There were some intraoperative advantages for the use
of a patient-specific implant. The length of incision in a PSI surgery is much smaller than the
conventional surgery. The number of steps in the surgery were also reduced, which results in
lesser number of open trays. This results in a reduction in the theatre time, sterilization time
and personnel cost. The postoperative alignment was better for PSI jigs. These jigs were
placed for a better or comparable restoration of mechanical/kinematic axis and individual
a better restoration of the planned axis. There were improvements in the postoperative
rehabilitation in terms of length of the hospital stay and blood loss. Since the introduction of
PSI shortened the surgery with smaller incision and better alignment, it meant less blood loss
and faster postoperative rehabilitation. PSI also provided cost-effectiveness as there was a
decrease in total cost due to reduction in the number of trays, reduced number of personnel
engaged, and decrease in cost of maintenance of inventory of both implants and instruments.
Hieu et al investigated the rapid prototyping for medical applications (medical RP) and
reverse engineering (RE) methods based on medical imaging data. Their work suggested that
for the successful transfer of medical RP technology to hospitals, a good link between the
medical and engineering sites should be established [7]. One of the main applications of RP
technology was in the design and manufacturing of bio models, surgical aid tools and
implants. The four main steps that are involved in the medical RP processes are: data
acquisition, data registration and processing, geometrical modeling and design and medical
application development. To process CT/MRI images and perform manipulations of the STL
data, MIMICS and Magics RP software were used. To manipulate RE data (points, triangle
mesh) and geometrical modeling processes, software like CopyCAD & PowerShape (Delcam
Inc.), Pro Engineer (PTC), UG (Unigraphics Solutions), and Solidworks (SolidWorks Corp.)
are used. The model is tested using Finite Element Analysis (FEA) and other mechanical
testing methods by both the designers and the engineers. Thus, medical RP can help meet
both clinical and geometrical restraints. Figure 2 shows a flowchart for the procedure for
Figure 2 Procedure for design and manufacture of implants, surgical aid tools and medical devices [7]
Hosni and Harrysson worked on the design and manufacture of customized implants and
came up with a procedure that estimated a 40% decrease in bone removal [8]. The process
delivered minimized bone removal with maximum fit and usability. CT scans were used to
develop a CAD model which was further used to make castings for the implant. The paper
talked about the future scope of creating ‘clean models’ which could be directly used as
implants. Problems like muscle and joint stiffness along with rehabilitation period was
fractures were made overnight using CT based modern RP software (Materialise, Ann Arbor,
Michigan) and equipment (3D Systems, Valencia, California and Z-Corporation, Burlington,
Massachusetts) [9].
Medical application and rapid prototyping is possible for prosthetics application and was a
potential tool for the development of novel medical technologies. Rengier et al worked on the
medical application for prosthetics using imaging data in 3D printing [10]. One of the pivotal
roles was carried out by radiologists in the process chain of connecting engineering to the
health care RP applications. A close association and collaboration between radiologists,
computer scientists, material scientists and clinicians was expected to integrate the whole
workflow into a clinical routine.
Jun and Choi proposed a methodology for the manufacturing of a patient-specific implant,
specifically a Total Hip Replacement, from the patient’s medical data [11]. Figure 3 shows
the flowchart for the steps involved in this process. The first step in the methodology is to
reconstruct a 3D femur from the sets of CT images. The parameters of the 3D geometry of
the patient’s hip bone are extracted from the 3D femur model. An initial shape for the
implant is determined using these extracted parameters. A static/dynamic analysis is
performed on this model to see if any change is necessary. A final patient-specific implant is
determined after the required analysis. This model is evaluated using finite element analysis
to seek the advantages that could be provided by a patient-specific implant close to the
geometry of the hip joint. The main function of the patient-specific implant is to transmit the
results of the analysis show that there is excessive interface stresses or stress concentration at
the joint, the geometry of the initial implant is modified accordingly.
Figure 3 A framework of preparative planner for custom hip implant [11]
Truscott et al analyzed the errors in the process route from CT scan of the original bone to
the .stl data to RP model produced for elbow prototypes built on EOS P380. A touch probe
scanner was used to inspect 500,000 data point positions [12]. Table 1 presents the error
analysis report between the STL file and the RP model. 50% of the errors had a magnitude
below 0.2333mm, 85% of errors had a magnitude below 0.4152mm and 96% of the errors
had a magnitude below 0.5972mm. Table 2 presents the data for error analysis report
0.8324mm, 91% of the errors had a magnitude below 1.2097mm and 97% of the errors had a
magnitude below 1.5869mm, which was approved by the surgeon involved in the research.
Table 1 Error analysis report between the STL file and the RP model [12]
Mean Error 0.2333 mm
Max Error 1.5513 mm at point 113200
Standard Deviation 0.1820 mm
Table 2 Error analysis report between human femur bone and RP model [12]
Mean Error 0.8324 mm
Max Error 4.3380 mm at point 105592
Standard Deviation 0.3773 mm
Viceconti et al developed a new hybrid environment for the design of custom-made hip
prosthesis and names it HIDE (HIPCOM design environment) [13]. The system was
developed so that a custom-made hip prostheses could be developed from the CT scan data.
This paper evaluated the efficacy of the design by using variation of the time necessary to
design a custom-made implant. The average design time was recorded when using HIDE
system and compared with the conventional procedure. Custom-made prostheses provided
better primary stability and induced less stress shielding as compared to standard cementless
designs. The HIDE system has adopted a set of procedures that allow a certain amount of
automation in the design process. This helps in the reduction of the very high cost of the
custom-made solutions. The design phases which were directly affected by the program were
reduced by 50%. A total reduction of 23% was observed in the entire design process.
study was conducted to demonstrate that the accuracy and repeatability of HIDE-based
design procedure improved significantly as compared to previous procedures.
A study had been conducted by Krishnan et al for Total Knee Replacements which claimed
that up to 20 steps in the entire surgical process are reduced when PSI guides are used [14].
When PSI implants were used, there was a significant reduction in the number of instrument
trays (mean 4.3 Vs 7.5, p < 0.0001) and surgical time (mean 121.4 minutes Vs 128.1
minutes, p=0.048) as compared to the conventional technique. Table 3 displays the source of
model accuracies at various stages of CT image production.
Table 3 Reported sources of model inaccuracies at various stages of CT image production [14]
2.3 Statistics associated with Total Hip Replacements
Several studies have been conducted to determine the immediate and postoperative outcomes
of primary and revision total hip replacements. Mahomed et al used the Medicare claims
submitted by the hospitals or by physicians and outpatient facilities under Medicare Part A
replacement surgery [15]. Table 4 shows the crude risks of select outcomes within 90 days
after primary and revision total hip replacement surgery.
Table 4 Complication rate % for selected outcomes within 90 days of primary and revision Total Hip Replacement [5]
Complication Rate % Primary THR Revision THR
Death 0.97 2.6
Readmission to hospital 4.6 10 Pulmonary embolus 0.93 0.79
Wound infection 0.24 0.95 Hip dislocation 3.1 0.84
Mortality rate, i.e. the risk of death in the first 90 days of the surgery is nearly 1% for
primary surgeries and it grows up to 2.6% for revision surgeries. The data shows that
revision surgeries have worse functional outcomes as compared to primary surgeries. Figure
4 depicts the breakdown in percentage cost of a Total Hip Arthroplasty in which the patient is
discharged to home. The cost of a Total Hip Arthroplasty consists of the following
components [16]:
Hospital Cost
Device Cost
Surgeon Cost
Figure 4 Percentage of costs for a Total Hip Arthroplasty in which a patient is discharged to home
According to a report by BlueCross BlueShield on the study of cost variations for knee and
hip replacement surgeries in the U.S., the cost of a Total Hip Replacement surgery varies
from $16,398.95 in Montgomery, Alabama to $73,987 in Boston, Massachusetts [17]. The
average cost of a Total Hip Arthroplasty is $30,124. 60% of the cost is covered by CMS
(Centers for Medicare & Medicaid Services) which provides coverage to most citizens above
65 years of age.
A Total Hip Replacement surgery typically lasts for 15-20 years after which a patient has to
undergo a revision surgery. For every 100 replacements done, there are 18 revision surgeries
performed. There could be many reasons which could lead to the requirement of a revision
surgery, namely:
Aseptic loosening 75%
Infection 8%
Dislocation 6%
5%
26%
10% 59%
Fracture 5%
Technical Error 3%
Others 3%
About 75% of the revision surgeries are done because of aseptic loosening of the primary
THR. Table 5 represents the minimum, median and maximum cost of a THR surgery in
terms of device and surgical costs.
Table 5 Distribution of device cost and surgical cost for Total Hip Replacement surgery [18]
Device Cost Surgical Cost Minimum $2,392 $7,152 Median $6,072 $12,548 Maximum $12,651 $23,051
The minimum device cost was $2,392 and the maximum device cost was $12,651; while the
minimum surgical cost was $7,152 and the maximum surgical cost was $23,051 [19].
2.4 Computer Simulation and SCOR Modeling
A Supply Chain Operations Reference Model (SCOR) is a process reference model with
standardized terminology and processes which are developed and maintained by the Supply
Chain Council (SCC) [20]. A SCOR template is a simulation-based tool for analysis which is
used to capture the subtleties of the operations of a supply chain. Persson and Araldi
presented the first version of this template.
Process modeling and re-engineering
Performance measurements
Best practices
Process Modeling and re-engineering: Any supply chain can be described by using process modeling as the fundamental blocks. SCOR consists of five distinct management processes:
Plan, Source, Make, Deliver, and Return.
Plan: It is a process or a set of processes that balance the demand and supply to create
a path, which when followed satisfies the production, delivery and sourcing
requirements.
Source: These are the processes that procure goods and services to meet the demand.
Make: It refers to the processes that transform the product to a finished state to meet
the demand.
Deliver: It is the process that provide finished goods and services to meet the demand.
It includes order management, transportation management and distribution
management.
Return: It refers to the process associated with returning or receiving returned
products for any reason. Products can be returned certain reasons such as – defects in
products, MRO (Maintenance, Repair, Operations) required for the products, products
Figure 5 SCOR Process Framework [22]
Source: http://courses.ischool.berkeley.edu/i243/s06/lectures/20060206/243-20060206.htm
Performance Measurement: There are about 150 key indicators that could be used to evaluate the performance of a supply chain. There are three levels of metrics associated with
SCOR, namely Level 1, Level 2, Level 3. Level 1 metrics are the used so that the
performance of the total supply chain can be evaluated by the decision makers. Level 2
metrics are high level measures which are primarily used across various SCOR processes.
Level 3 metrics are the secondary attributes which do not necessarily relate with Level 1
processes.
2.4.2 SCOR Methodology
There are four main steps that are involved in the implementation of a SCOR-based working
environment: (i) Examine the basic competition, (ii) construct the supply chain, (iii) align
performane levels, practices and systems, and (iv) implement supply chain processes and
systems. The second step consists of modeling the chain using standardized processes using
level 1 and level 2 alone, whereas level 3 defines the tasks in level 2. Sometimes, a level 4 is
introduced which is unique for each business and defines the tasks in level 3. It is very
generic and usually left untouched. This tool has been developed by practioners to identify
and implement supply chain improvements, select and manage changes within organization
and provide a basis for education and training in the field of supply chain.
2.4.3 Automatic Simulation Model Generation
Son and Wysk worked on creating a methodology for automatic simulation model generation
that could be used to directly control a manufacturing system [23]. The static and dynamic
information for the simulation model is obtained from shop floor resource model and shop
level control model respectively. The simulation model created using traditional systems
analysis could be used to perform high-level control activities in the manufacturing system
using Ethernet communication. The simulation is generated in Arena and was validated using
six different manufacturing systems. The manufacturing systems considered here are
discrete-part manufacturing systems consisting of robots, automatic storage systems, CNC
machines and an automated transporter, e.g., a guided vehicle system or a programmable
Sprock et al worked on applying model-based systems engineering (MBSE) to create SCOR
based supply chain reference framework using OMG SysML™ [24]. The paper illustrated
the construction of a Domain Specific Language (DSL) from SCOR and then combining it
with a set of patterns to create a reference architecture. This reference architecture is used to
construct an Analysis Model in the discrete event simulation environment. The time required
to develop, validate and test system models is reduced because the single model of the
system of interest provided access to multiple analyses. Their research developed an
object-oriented, SCOR compliant reference architecture detailed in SysML.
The literature discussed in this section is beyond the scope of this thesis, but it be used in
future to extend the SCOR model developed here to construct tools that can automatically
build new systems for manufacturing.
2.5 Summary
This chapter provides: 1) an overview of the earlier work in medical modeling of implants, 2)
an introduction to SCOR 3) various facts related to Total Hip Arthroplasty as an example
product domain, and 4) using SCOR or formal state models to develop simulation models of
complex systems. As the AM technology becomes more affordable, it will be used in more
surgeries. There is evidence that this will provide advantages for using AM technology in
implant medicine, and that we will see tailor-made 3D printed implants become a standard
procedure. This research focuses on combining these areas together to create models (SCOR
resource capacities and related economics. The next chapter describes about the methodology
CHAPTER 3
METHODOLOGY
3.1 Introduction
This chapter explains the methodology of building a SCOR model for hip stems customized
for individual patients. It describes the various levels of process details for traditional as well
as additive method of manufacturing. The SCOR model is used to create a simulation model
to assess capacities for additive manufactured hip stems. The last section of the chapter deals
with cost-analysis for patient-specific hip stems and compares the economics with the
traditional method of manufacturing and implantation.
3.2 SCOR Model
This section will focus on building two states of SCOR model 1) ‘As-Is’, and 2) ‘To-Be’.
The As-Is state refers to the traditional method of manufacturing hip stems which consists of
a series of operation from forming to finishing. The To-Be state refers to the additive
manufacturing of patient-specific hip stems. SCOR helps in comparing the two states and
thereby, transferring from current to the desirable future state.
SCOR contains three levels of process detail. Level 1 defines the supply chain using five distinct management processes – Plan, Source, Make, Deliver, and Return.
enabling the relationship between them. A level 2 process is classified by each type of
product as follows:
1 – Make-to-Stock (MTS)
2 – Make-to-Order (MTO)
3 – Engineer-to-Order (ETO)
4 – Retail Product
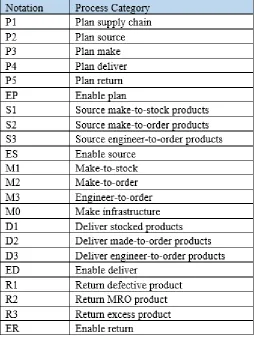
The SCOR model provides 22 process categories which are defined in Table 6. Any
configuration of a supply chain can be represented by using these process categories.
Level 3 is the process element level that decomposes the processes. It defines an organization’s ability to compete effectively in its selected market. It consists of process
element definitions, information about inputs and outputs, best practices and process
performance metrics. It provides detailed process element information for each Level 2
process category.
Level 4 provides a description of Level 3 tasks and is unique to each business and organization. It is required to manage the supply chain on a day-to-day basis.
In the next two section, the SCOR models are presented for traditional and additive method
of manufacturing.
There are thirteen performance metrics which are endorsed by the SCOR model. Table 7 lists
these metrics/parameters. A company cannot excel in all the 13 categories, and hence
companies usually focus on four to six performance parameters which are important for their
business. Usually companies focus on five defining categories: reliability, responsiveness,
flexibility, costs, and efficiency in managing assets.
In the following sections, SCOR models for the traditional as well as additive method of
manufacturing hip stems will be created and described.
3.2.1 The As-Is Model
Presently, the hip stems are being manufactured by the method of forming. Most hip
replacements are made from Cobalt or Chromium alloys, or Titanium. Metal billets are
heated in a furnace at 1200⁰C. Three stamps of different sizes are used successively for
forming to give the shape of a hip stem to the metal billet. This part is subjected to
post-processing finishing operations to achieve required dimensions and tolerances. Sand blasting
is done to polish the part. The part is then bathed in a water-based citric solution to remove
the powdered metal and clean the part. The quality control department inspects the hip stem
for functional accuracy. The hip stems are then shipped to the desired locations. Figure 6
Figure 6 As-Is: SCOR model for current process for manufacturing hip stems
Level 1
Plan: Level 1 consists of P1, P2, P3, P4 and P5 process categories.
P1 – Plan the Supply Chain: The entire process is reviewed and demand and supply factors
are taken into account to plan deliveries and source raw materials.
P2 – Plan Source: To manufacture a hip replacement, the important resources are –
Engineers
Heat furnace
Forging machine/Investment Casting machine
CNC machine
Machine tools
Sand blasting machine
Water-based citric solution
Engineers are foremost required for process planning, design and engineering, and to
maintain the equipment and quality of the product. Raw materials for hip stems have to be
procured. Other equipment as mentioned above like a heating furnace, forging machine
casting system with sand blasting, and CNC machines and tools for finishing have to be
acquired and maintained in working condition. Water-based citric solution is to be sourced in
for cleaning the part. P2 (Plan Source) plans for the sourcing in of these resources. The plans
for ordering the equipment and materials, and gathering the workforce are made in the Plan
Source Level 1. P3 – Plan Make: The process planning for manufacturing needs to be done
beforehand. Figure 7 shows the process plan for Make.
Figure 7 Traditional Make process for ‘As-Is’ Model
P4 – Plan Deliver: After the hip stems are built, they are packaged in appropriate packaging
methods depending upon the company policies. This could depend on cost factors, urgency
of the part and other related factors.
P5 – Plan Return: Returns could be made because of a variety of factors. It could be because
the material/product is defective, needs repair, or is purchased in excess. Returns could be
made at two points in the process. Once, at the source node, where the raw materials or
equipment that are brought it from different suppliers are defective, need MRO
(Maintenance, Repair and Operations) or are simply sourced in in excess. The other point
where returns could be made is at the customer-end. The hospitals or the purchasing
company could return the hip stem because of any of the above mentioned reasons. The
industry prepares a plan of action, in case returns have to be made from/to any of the nodes.
Level 2
This level classifies the processes as – Make-to-Stock (1), Make-to-Order (2),
Engineer-to-Order (3), and Retail Product (4). For the traditional method of building hip stems, the
manufacturing is governed by the forecasted demand. All the resources are kept in stock. The
hip stems are also manufactured as Stock. The delivery and return of these
Make-to-Stock components happen via the company’s logistic systems.
The Level 2 processes look as following:
S1: Source MTS parts
M1: Manufacture MTS parts
D1: Deliver MTS parts
The Level 3 and Level 4 process for Source, Make, Deliver and Return are described in
Appendix A.
Figure 8 Various Levels of SCOR ‘As-Is’ Model
This section presented the ‘as-is’ model, which is the model representing traditional method
of manufacturing a hip stem. The next section will talk about a similar kind of model for the
3.2.2 The To-Be Model
To additively manufacture a uniquely customized hip stem, a CT scan is taken of the
patient’s hip and femur. These CT scans are essentially 2D images which are converted into a
CAD model using specialized software. These CAD models are subjected to FEA analysis to
determine faults in the model. When the model passes the FEA tests, it is fed into an EBM
machine to be built. This is followed by support removal and other post-processing and
finishing operations. Figure 9 shows the SCOR model for this ‘to-be’ state.
Level 1
Plan: Level 1 consists of P1, P2, P3, P4 and P5 process categories.
P1 – Plan the Supply Chain: The entire process is reviewed and demand and supply factors
are taken into account to plan deliveries and source raw materials.
P2 – Plan Source: To additively manufacture a hip replacement, the important resources are
listed in Table 8.
Table 8 List of resources for "To-Be" model
Resources
Medical Engineers (CAD and FEA) CNC Machine CT Scanner Machine Tools Medical grade Cr and Cu alloy
powder or Ti powder EBM and CNC operators
Figure 9 To-Be: SCOR model for additive manufacturing of hip stems
Specialized medical engineers are required for the process planning, design and engineering,
and to maintain the equipment and quality of the product. Raw materials for hip stems have
to be procured. Other equipment as mentioned above like a CT scanner, machine for sand
blasting, and CNC machine and tools for finishing have to be acquired and maintained in
working condition. Water-based citric solution is to be sourced in for cleaning the part.
P2 (Plan Source) plans for the sourcing in of these resources. The plans for ordering the
equipment and materials, and gathering the workforce are made in the Plan Source Level 1.
P3 – Plan Make: The process planning for the manufacturing needs to be done beforehand.
Figure 10 AM-build process
P4 – Plan Deliver and P5 – Plan Return sections are the same as the ‘As-Is’ model. The
probability of R3 (Return excess product) from the buyer is very low. The probability that the
hip stem was ordered and manufactured but is no longer required happens in the event when
the patient dies during the manufacturing process.
Level 2
This level classifies the processes as – Make-to-Stock (1), Make-to-Order (2),
Engineer-to-Order (3), and Retail Product (4). For the additive manufacturing of hip stems, the
manufacturing is governed by the actual demand. The manufacturing is not initiated unless
an order is received. Since, the manufacturers cannot estimate the exact demand at any time,
all the resources are kept in stock. The components are manufactured as Engineer-to-Order.
This creates a “pull system” for all product orders. It also means that there is only one
customer for each customized product. The delivery and return of these Engineer-to-Order
components happen via the company’s logistic systems.
M1: Manufacture ETO parts
D1: Deliver ETO parts
R1, R2, R3 represent Return defective product, return MRO, and return excess product
respectively.
Level 3 and Level 4 process for Source, Make, Deliver and Return processes are listed in
Figure 11 Levels of SCOR ‘To-Be’ Process
This is a comprehensive model of the ‘To-Be’ desirable state of the chain. To move from
‘As-Is’ to ‘To-Be’, SCOR helps in describing supply chain configurations and thus enables
3.3 Simulation Model
In the above sections, SCOR provided a fundamental composition of building an analytical
model from the supply chain information. Now, a simulation is described that will evaluate
the system for its efficiencies and capacities. A simulation model is manually built using the
information from the SCOR model. Arena is chosen as the software of choice as it translates
the activities of SCOR into a network based simulation system. There are about 332,000 hip
replacement surgeries that happen every year in the U.S. Revision surgeries are primarily
performed due to aseptic loosening of the hip stem. This section builds a simulation model to
determine resource requirements if half of the original capacity, i.e. 166,000 hip stems are
manufactured using AM methods.
For this research, a single central AM facility that will produce all uniquely custom hip stems
is assumed to model the MAKE portion of the SCOR model. This facility receives orders
from hospitals that will include a CT scan and the style of stem that will be used. The facility
will complete the design of the hip stems using the CT scans for each patient. The hip stems
will then be 3D printed and finished at this facility. Finally the hip stems will be inspected
and autoclaved for packaging into aseptic transport containers.
To build this simulation, following assumptions were made:
1. The processing times for each operation has been assumed to have a triangular
distribution.
2. The arrival rate of patients into the system has been assumed to be random exponential.
3. A success rate of 95% has been assumed for the FEA analysis of the part.
5. The hip stems are not built in the 3D printer one by one. The parts get batched (5 parts per
batch) before the build, so that the machine is not run for just one part alone (efficiency).
10 hip stems could be placed in a single build for optimum results, but considering the
stochastic nature of the demand, a batching of 5 parts is used on average, and during
higher demand periods the build can be increased to up to 10 hips stems per build.
6. The part can be built using any powder bed metal 3D printer, but this simulation assumes
that an EBM (Electron Beam Melting) machine for the build. A DMLS printer could be
used instead of an EBM, but a DMLS printer often faces the issue of part-warping. This
increases the need of a lot of sacrificial supports on the base, attaching a considerable
portion of the part to the base plate. Hence, it is reasonable to assume that an EBM would
be a preferable choice over a DMLS.
7. The EBM is a warm-bed machine. The heat treatment of the part is “heat treated” in the
machine during its cool down. An overnight cool-down period is introduced. For longer
build times, this cool down time becomes even longer. This cool-down period has also
been included in the simulation to accommodate the heat treatment part.
8. 332,000 hip replacement surgeries are performed in a year in the USA. This simulation
was aimed at manufacturing half of this quantity (166,000) per year. It was assumed that
the EBM machines ran 24 hours, 7 days a week while the activities like CT scanning,
CAD modeling, FEA analysis and finishing operations take place on 5 days of the week, 8
hours per day. It is a reasonable assumption since the EBM machines do not require an
9. The 3D printing EBM process in the simulation is sub modeled such that only the
preparatory processes and the removal process require and EBM operator.
10.Typically a hip stem weighs ~1.5 pounds. Keeping in mind, the material for stem and the
supports, one hip stem would require ~2 pounds of metal powder. It is assumed that the
metal powders provide a utilization of 85%.
The model created here is only simulated to determine resource capacities. The cost
component for these resources are not utilized to do a cost simulation. A rough cost-analysis
is done in the next section to represent how the changes in device cost, surgery cost,
post-discharge costs etc. affect the total cost of THA.
The structure of a simulation model is shown in Figure 12. The resources that are being
considered for this system are listed in Table 9.
Table 9 List of critical resources considered in this simulation
Resources Medical Engineers (CAD
and FEA) EBM Machine CT Scanner CNC Machine Medical grade Chromium
and Copper alloy powder or Titanium powder
Technicians or Operators for CT
Figure 12 Simulation model for AM manufacturing of hip stems
The simulation model was created using Arena software. The processing time for each
operation was taken as a triangular distribution with liberal assumptions. As this simulation
was built, we realized that the main bottlenecks in this operation are the powder capacities
and the number of EBM machines for the build. Skilled medical engineers and EBM/CNC
operators are also required. The metal powder were used with ~85% efficiency. The other
resources were run at ~60-65% utilization. The simulation was run many times, adjusting the
capacities of resources each time to produce approximately 166,000 hip stems in a year. The
aim of this simulation model is to determine the resource requirements for the future and
determine bottlenecks in the system. A detailed discussion about the results and conclusions
3.4 Summary
This chapter presented a methodology for building simulation model from a SCOR-based
model for the hip stems. The ‘As-Is’ and ‘To-Be’ models were created and detailed. A
simulation model was also built which would assist in determining resource requirements for
the future. In the next chapter (Chapter 4), the traditional and additive models will be
compared to discuss about the shift of manufacturing from ‘As-Is’ to the desirable ‘To-Be’
state. The results of the simulation model will be used to discuss about the resources in the
future. A cost-analysis will also be presented to compare the two methods of manufacturing
CHAPTER 4
RESULTS AND DISCUSSIONS
4.1 Introduction
The previous chapter discussed the methodology for building the SCOR model of a THR
system and the simulation around it. In this chapter, we will discuss the significance of these
models and try to understand how the simulation might be used in order to investigate the
supply chain performance and resource requirements. By making comparisons between the
SCOR models, it becomes easier to determine the pros and cons of each manufacturing
method. The simulation results also tell us about the capacities of different resources. A
cost-analysis is done to compare the costs of both the manufacturing methods and determine
various trade-offs. The main difference between the two models is in terms of the inventory
model it uses. The ‘As-Is’ system is a push inventory model while the ‘To-Be’ system is a
pull inventory model. Figure 13 and 14 illustrates this difference.
Figure 14 Pull System for ‘To-Be’ Model
In the following sections, we compare the two models on different performance measures
and prepare simulation model for sensitivity analysis related to resource capacities and cost
analysis related to feasibility.
4.2 Comparisons between ‘As-Is’ and ‘To-Be’ Model: Performance Metrics
The Level 2 of the SCOR model identifies 13 major performance attributes that the
companies focus on. These attributes are divided into five categories: Reliability,
Responsiveness, Flexibility, Cost, and Assets. Not each metric out of these thirteen are
relevant for these models. The relevant metrics are discussed below and some new metrics
are devised to compare the two models more appropriately.
Order Fulfillment Lead Times: It is defined as the average lead time that is reliably attained
from customer’s approval of purchase order to the order completion at the customer’s end.
The ‘To-Be’ supply chain prepares ETO (Engineer-to-Order) products, hence the order
fulfillment lead times for this model is higher than the ‘To-Be’ model.
Production Flexibility: It can be categorized into – Upside flexibility and Downside
flexibility. Upside flexibility is defined as the number of days it takes to sustain an unplanned
sustainable at 30 days prior to delivery with no inventory or cost penalties. For the ‘As-Is’
supply chain, the upside flexibility is better as the manufacturing process is faster. For the
‘To-Be’ supply chain, the downside flexibility is better as there is no inventory. The
production process starts only after an order is placed.
Cost of Goods Sold: This is the sum of the direct and the indirect costs. The cost related with
purchasing of the raw materials and manufacturing of the finished goods. The ‘To-Be’ model
uses additive manufacturing method for the production of hip stems, hence the cost goes up.
Warranty Costs/Returns Processing Cost: It is defined as the cost required for materials,
problem diagnosis, labor and other resources to discard/repair defective products. The
number of defects/returns for an AM based supply chain (‘To-Be’ model) is significantly
smaller than the ‘As-Is’ model. Hence, the warranty/ returns processing cost for ‘To-Be’
model is lesser than ‘As-Is’ model.
The above mentioned performance metrics indicate that the AM based supply chain is not
very flexible. However, there are some metrics other than the above 13, which suggests the
benefits of the AM ‘To-Be’ Model. Table 10 lists the parameters which make the AM supply
Table 10 List of performance measures which are improved in the AM "To-Be" model
Performance Measure Product performance Inventory: Push Vs Pull
CODP Product life Cash tied up in inventory
Material wastage Mechanical properties
Returns
Time: surgery, post-discharge, rehab
Obsolescence
Product performance: The AM implant is uniquely customized for each patient’s geometry
which increases its performance. The better fit of the hip stems will reduce the pain
experienced by the patient and provide better mobility.
Inventory (Push Vs Pull): The traditional method of manufacturing a hip stem is a push
system where the inventory depends on demand forecasting. The AM supply chain is based
on a pull inventory strategy because each hip has a unique geometry. A pull inventory model
refers to a system where the orders to make products are requested by the customer. The AM
model contains no inventory of finished goods as the hip stems are sold even before they are
manufactured.
Customer Order Decoupling Point (CODP): CODP is the point in the supply chain of a
product, where the product will be linked to a particular customer. The CODP for an AM
implant is very high up in the supply chain. The product is designed and manufactured for a
specific customer. While this brings variability in the supply chain, it improves performance
especially people with different geometries, are able to take advantage of the technology and
get better results.
Product life: The need for a revision surgery arises 10-15 years after the primary surgery.
The need for a revision surgery arises due to aseptic loosening of the implant. The AM
implant is uniquely customized and hence, provides better fit. The probability of aseptic
loosening can be reasonably assumed to decrease by a 50%. This increase the product life on
an average.
Cash tied up in inventory: The AM supply chain does not keep inventories for the
manufactured hip stems. The orders are delivered as soon as they are manufactured. Hence,
there is no cash tied up in the inventory of finished goods. However, an AM facility would
require other inventories like metal powder and the surgical facilities would require
specialized surgical sets for trials. The inventory costs of these items might be significant.
Material wastage: The metal powder used in the additive manufacturing of the hip stem can
be recycled. There is less material waste as compared to traditional manufacturing methods.
Mechanical properties: Several experiments have been conducted to test the material
properties of metal AM parts. It has been shown that the metal additive process produce
superior properties as compared to their traditional manufacturing counterparts [25]. It is
expected that the AM hip stems will have better mechanical properties (tensile strength, yield
strength, hardness, and elongation) as compared to the traditionally manufactured hip stems.
Returns: The AM implants are manufactured with reference to a patient’s hip geometry.
rare event in the “ToBe” system, where the patient would likely die or become severely
diminished because of a disease or trauma during the manufacturing process.
Time (Surgery, post-discharge and rehabilitation): The fit and functionality of a uniquely
customized implant made by AM processes decrease the surgical time, post-discharge time
and the average rehabilitation time for the patient. It makes the process relatively painless for
the patient.
Obsolescence: The manufacturing of an AM hip stem is initiated only after an order is
placed. Hence, there is no question of the product being obsolete.
As we look at the above performance measures, it is evident that the AM model comes with
its own set of advantages. It is however, limited by the resource capacities, flexibility and the
cost factors. In the next part, we use a simulation model to determine our resource
requirements for the future. A cost analysis will be performed in the later section to compare
the costs of both the models and determine the feasibility.
4.3 Comparing the supply chain of “As-Is” and “To-Be” Models
In the current “As-Is” manufacturing, the ‘few sizes for many’ rule is the service model. The
hip replacements are manufactured in certain sizes and shapes and the surgeons use their
better judgement to identify the suitable hip stem for their patients. Most of the hip
replacements that are manufactured in the U.S. come from Warsaw, Indiana. It is also
referred as The Orthopedic Capital of the World. One third of the $32 billion Global
subsidiary of Johnson & Johnson), Biomet are the three major companies in this market in
Indiana. Figure 15 shows a map of the general idea of how the “As-Is” supply chain looks
like.
Figure 15 The “As-Is” supply chain
The hip replacements are manufactured in certain sizes and shapes and shipped to the
surgical centers across the U.S. During the surgery, the surgeon identifies the correct hip
stem according the patient’s geometry, completely relying on experience and judgement.
For the “To-Be” supply chain, this thesis discusses about a vision where a centralized
Additive Manufacturing facility fulfills the entire demand. At present, there is no
infrastructure developed for commercial AM produced medical device industry. Figure 16
represents how the “To-Be” supply chain will generally look like.
Figure 16 The “To-Be” Supply Chain
In Figure 16, the orange arrows represents that the CT scan, order and other patient
information that is sent to the AM device modeling facility from the hospitals. The blue
arrows represent the hip stem being shipped to the concerned facilities. Since the majority of
orthopedic implants are manufactured in Warsaw, it is not be a bad assumption to centralize
the AM based supply chain in Warsaw, IN as well. In both the “As-Is” and “To-Be” models,
there will be occasional arrows for the returns. For optimum results for capacities and
resource utilization, the EBM machines should be kept running
The “As-Is” supply chain is essentially a push system, while the “To-Be” supply chain is a
pull system. The “To-Be” supply chain for uniquely customized hip stems waits for patient
information about geometry and physical condition before manufacturing and thus, produces
implants with better fit and functionality.
4.4 Simulation Results
In Chapter 3, a simulation model was built for the AM based manufacturing of hip stems.
The EBM machines were run 24*7 around the year, while the other machines and processes
were 5 days a week and 9 hours per day, considering 200 working days. The aim of this
simulation is to find out resource capacities to meet half of the yearly requirement (166,000)
using AM uniquely customized process.
A hit and trial approach was used to find resource capacities which generate approximately
166,000 hip stems in a year. Figure 17 shows the Arena screenshot for the number of hip
stems dispatched for a year.
Figure 17 Number out in the simulation model
A utilization of 60-65% has been assumed for all other resources. After several hit and trials,
the resource capacities were able to produce the desirable number of hip stems. Table 11
Table 11 Resource capacities for the AM model
Type Capacity
1 Technicians 585
2 Medical Engineers CAD 1190
3 Medical Engineers FEA 585
4 EBM Operator 50
5 EBM Machine 110
6 CNC Operator 440
7 QC Inspector 145
8 CNC Machine 440
For this model to be successful, about 585 technicians, 1190 medical CAD engineers and 585
medical FEA engineers who are skilled in the medical modeling field will be required. 110
EBM machines and 50 operators solely dedicated to producing hip stems so that we are able
to hit our demand would be required. 440 CNC machines and operators are required who are
able to carefully machine the devices. There must be a quality department which check for
the quality of the device before dispatching it to the hospitals, but it does not seem to be a
Each hip stem requires ~2 pounds of metal powder for the build. Considering 85% utilization
of the powder, approximately 390,896 pounds of metal powder is required each year to meet
50% of the present demand by uniquely customized AM hip stems.
The AM hip stems have better functionality but there is a trade-off with the manufacturing
time. Figure 19 shows the screenshot for total time spent by the entity in the system. On an
average, it takes about ~39 hours to build a hip stem from scratch. This is significantly higher
than the time required by the traditional manufacturing processes.
Figure 188 Total time spent by the hip stem in the system
The resources have been utilized at ~60-65% which is a reasonable assumption based on the
industrial experience.
In this section, the simulation results related to time constraints, output, resource capacities
and their utilization are examined. At present, there are a few facilities which produce
uniquely customized hip stems. This simulation explains the demands of the future if a focus
is set on the AM methods for patient specific implants.
4.5 Sensitivity Analysis
The above section discussed the results of the simulation model when the production quantity

![Figure 2 Procedure for design and manufacture of implants, surgical aid tools and medical devices [7]](https://thumb-us.123doks.com/thumbv2/123dok_us/1737103.1222153/21.612.134.496.80.396/figure-procedure-design-manufacture-implants-surgical-medical-devices.webp)
![Figure 3 A framework of preparative planner for custom hip implant [11]](https://thumb-us.123doks.com/thumbv2/123dok_us/1737103.1222153/23.612.125.502.134.416/figure-framework-preparative-planner-custom-hip-implant.webp)
![Table 2 Error analysis report between human femur bone and RP model [12]](https://thumb-us.123doks.com/thumbv2/123dok_us/1737103.1222153/24.612.189.446.237.288/table-error-analysis-report-human-femur-bone-model.webp)
![Table 3 Reported sources of model inaccuracies at various stages of CT image production [14]](https://thumb-us.123doks.com/thumbv2/123dok_us/1737103.1222153/25.612.94.535.337.488/table-reported-sources-model-inaccuracies-various-stages-production.webp)
![Table 4 Complication rate % for selected outcomes within 90 days of primary and revision Total Hip Replacement [5]](https://thumb-us.123doks.com/thumbv2/123dok_us/1737103.1222153/26.612.166.465.177.282/table-complication-selected-outcomes-primary-revision-total-replacement.webp)

![Table 5 Distribution of device cost and surgical cost for Total Hip Replacement surgery [18]](https://thumb-us.123doks.com/thumbv2/123dok_us/1737103.1222153/28.612.197.426.260.322/table-distribution-device-cost-surgical-total-replacement-surgery.webp)
![Figure 5 SCOR Process Framework [22]](https://thumb-us.123doks.com/thumbv2/123dok_us/1737103.1222153/30.612.109.557.72.331/figure-scor-process-framework.webp)