A Population Genetic Study
of
the Evolution of SINEs. 11. Sequence
Evolution Under the
Master
Copy Model
Hidenori Tachida
Department of Biology, Faculty of Science, Kyushu University 33, Fukuoka 812, Japan Manuscript received January 5 , 1996
Accepted for publication February 29, 1996
ABSTRACT
A transient population genetic model of SINE (short interspersed repetitive element) evolution assum- ing the master copy model is theoretically investigated. Means and variances of consensus frequency of nucleotides, nucleotide homozygosity, and the number of shared differences that are considered to have caused by mutations occurring in the master copy lineages are computed. All quantities investigated are shown to be monotone functions of the duration of the expansion period. Thus, they can be used to estimate the expansion period although their sampling variances are generally large. Using the theoreti- cal results, the Sb subfamily of human Alu sequences is analyzed. First, the expansion period is estimated from the observed mean and variance of homozygosity. The expansion period is shown to be short compared to the time since the end of the expansion of the subfamily. However, the observed number of the shared differences is more than twice that expected under the master copy model with the estimated expansion period. Alternative models including that with multiple master copy loci to explain this observation are discussed.
S
HORT interspersed repetitive elements (SINEs) are found in many eukaryotes and considered to transpose to other locations of the genome through RNA intermediates (for review, see DEININCER 1989;OKADA 1992). One of the most studied SINE families
is the primate Alu family whose copy number in human genome is considered to be around a million. There are basically two types of models concerning the expan- sion of SINEs. One extreme is the master copy model in which one or a few elements in the genome have capacity to duplicate and all other elements are pseu- dogenes ( SHEN et al. 1991; DEININGER et al. 1992). The other extreme is the transposon model in which all elements have capacity to duplicate. Intermediate mod- els between these two extremes are also proposed ( MATERA et al. 1990; BROOKFIELD 1993). Although dif- ference in the mode of duplication results in difference of the shape of SINE genealogies and thus would be reflected in sequence divergence among SINE ele- ments, discrimination among models is difficult be- cause ( l ) SINE sequences are short and thus it is diffi- cult to infer genealogies due to stochastic errors and
( 2 )
population polymorphisms blur the distinctions among the models. Thus, to judge which model is ap- propriate for the evolution of a SINE family taking into account these factors, we need to develop population genetic models in which modes of duplication are speci- fied.A pioneering work in this direction was done by BROOKFIELD ( 1986) assuming the equilibrium trans- poson model. He applied his theoretical results to the
Author e-mail: htachscb@?mbox.nc.kyushu-u.ac.jp
Genetics 143 1033-1042 (June, 1996)
analysis of the whole Alu family and showed that the sequence divergence estimated from the data is incom- patible with the theoretical expectation of the transpo- son model. OHTA (1986) developed a transient trans- poson model and showed that her model can explain the sequence divergence among A h . On the other hand, ULAN and HUDSON ( 1989) developed an equi- librium master copy model in which the number of copies is kept constant by the balance between duplica- tion and deletion and showed that this model also is compatible with the Alu divergence data. However, recent advances in the studies of Alu and other SINE families showed that SINE families take subfamily structures resulting from successive waves of expan- sions ( BRITTEN 1 9 8 8 ; J u ~ ~ ~ and SMITH 1988;
QUENTIN
1988; KIDO et al. 1994). This leads us to consider tran- sient models in which expansion periods are specified. Moreover, the amount of sequence data of SINE ele- ments increased, and it allows us to examine quantities beyond simple sequence divergence and contrast these with their expected values under different model pa- rameters.
1034 H. Tachida
MODEL
Assumptions and parametem We assume the WRIGHT-
FISHER model. The population has a constant size N through time and we measure time in unit of 2Ngenera- tions. Complete linkage within an element and free recombination between elements are also assumed. In our model, all genes of the master copy locus become capable of retroposition at the beginning of the expan- sion period. We assume that the expansion period per- sisted for t b units with a constant rate of duplication
and t, units time elapsed since the cessation of the expansion. The model is the same as that of TACHIDA
and IIZUKA (1993) in which the polymorphism with
regard to the presence or absence of an element was investigated except that t b there was t b
+
t, in the present paper. Because the number of elements in a SINE fam- ily is usually very large, we assume that infinitely many pseudogene elements were created during the expan- sion period. All retroposed elements are assumed to be inserted into different locations (loci) of the genome and their insertions are selectively neutral. The muta- tions occur at a rate of u per site per 2N generations and they are assumed to be neutral ( KIMURA 1968) .Moments of gene frequencies: First we investigate
the homozygosity per site,
b,
defined as the probability of two elements having the same nucleotide at a posi- tion. Suppose that we sampled n elements each of which has m nucleotide sites. Then,b
is estimated bywhere Xlil takes one if the lth sites of ith- and jth-sam- pled elements have the same nucleotide and zero other- wise. If we assume the JUKES-CANTOR mutation model
( JUKES and CANTOR 1968) in which mutation to any other nucleotides occur at the same rate of u / 4 per 2N generations, then
h,,
is expressed by the probability 8 that the sites of the two elements are identical by descent (IBD ) as= d
+
Y4(1 -e )
= I/q(l+ 38).
( 1 ) Now we compute 8. Because the number of elements is assumed to be infinite, the two random elements taken from the present population are from different loci. Also the probability of sampling an element from the master copy locus is low and negligible. In the com- putation, first note that 8 is expressed using the coales- cence time T of the two genes as= E [ e-2uT], (2)
where E denotes the expectation. The coalescence time Tis divided into three independent parts as
T = TI
+
T2+
T3, ( 3 )where TI is the time between the present and the end of the expansion ( T I = t,) , T2 is the time between the
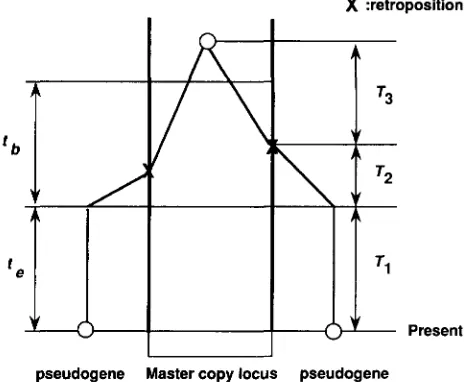
X :retroposition
Present
pseudogene Master copy locus pseudogene
FIGURE 1.-Genealogy of two sampled SINE elements. X
indicates the event of retroposition. Retroposition started t,,
+
t, ago and ended t, ago.end of the expansion and the older transposition event of the two elements from the master copy, and T3 is the coalescence time of two random genes at the master copy locus (see Figure 1 )
.
Since the three T ' s are all independent,0 = E [ e-2 UTl ] E [ e - 2 UT2 ] E [ e - 2 UT3
I .
( 4 )The first term is e-2U'+. The third term is 1
/
( 1+
2u) ( KIMURA and CROW 1964). To compute the second term, we need the density of T2. Since the rate of dupli- cation is constant through the expansion period, the time between the end of the expansion and the transpo- sition event is distributed uniformly in (0, t b ).
Thus, Prob [ T2<
t ] = ( t / t b ) ( 0 5 t 5 t h ) and this leads ton
Putting all these terms into Equation 4, we obtain
0
For small u, tbu and t p , 8 is approximately expressed as
8
*
1 - y s ( u t b ) - 2 (ut,) - 2u.( 7 )
Thus, 0 decays with a rate of 4 / 3 and 2 per unit in- creases of u t b and ut,, respectively.
Higher order IBD probabilities can be obtained, in principle, in a similar manner. For example, the proba- bility y that three random genes are identical by de- scent is expressed as
[ ( 8
+
6tb~)e-3'b" - 9e-"bU+
l]e-'e." 3 ( t b u ) ' ( 1+
2 u ) ( l+
u)Y =
.
( 8 )that three elements have the same nucleotide at a posi- tion is
m3 = YI6(6y
+ 96'
+ 1 ) .
( 9 ) The probability m3 is the sum of the third moments of the nucleotide frequencies at a site. For small u , tbu and t p , y is approximately expressed asy 1 - 2(utb) - 3(ut,) - 3u. (10) Note that the approximate expressions ( 7 ) and (10) for 6' and y have the same form 1 -
ax,
where X = ( 2 t b+
3te+
3 ) u , a = 2/3 for 0 and a = 1 for y . Therefore, the relationship between 6' and y is the same as that in the one locus random mating model, that is,1 - 6' = Y3(1 - y ) . (11) Also, since t b and t, enter in the expressions for 6' and
y through the parameter X , it is not possible to estimate them separately from two statistics related to the two IBD measures, such as homozygosity and the third mo- ments of nucleotide frequencies when u , tbu and t,u are small compared to one. Computations of IBD measures for more than three genes become very complex. Thus, we will compute quantities involving fourth moments by simulations described later.
Consensus frequency: Another quantity of interest
is the consensus nucleotide frequency that is defined as the frequency of the most frequent nucleotide at a site. Although the exact treatment of this quantity is difficult, we can calculate the average consensus fre- quency approximately when E = ( t,,
+
te) u is much smaller than one. In this approximation, the popula- tion polymorphism is ignored and the master copy is assumed to have a single lineage (the monomorphic approximation) . We also assume the Jukes-Cantor mu- tation scheme for simplicity. Since E<
1, we can as- sume that at most one mutation occurs on each lin- eage. Under the Jukes-Cantor mutation model, the probability of no mutation in a lineage with length t is approximately 1 - 3 u t / 4 from this assumption. Let X,,,, be the consensus frequency at the site. The con- sensus frequency depends on the time, t , when a nucle- otide change occurs on the master copy lineage. Here, the time is measured from the start of the expansion and master copy lineages are lineages of genes at the master copy locus. The density of t is 3 u / 4 for 0 5 t5 t b and the probability of no change on the master
copy lineage is approximately 1 - 3tbu/4. We need to consider three cases, 0 5 t 5 tb/2, t b / 2 5 t 5 tb and
t = m . In the last case, the consensus nucleotide is the original one and the conditional expected consensus frequency is
Thus, the contribution to the expected consensus fre- quency from this event is
where 0 ( x ) represents a term of the same order as that of x. For 0 5 t 5 t b / 2 , the consensus nucleotide is
the changed nucleotide and the conditional expected consensus frequency is ( t b - t )
/
tb+
O ( E ) . Therefore, the contribution from this event islyz
[
1 -+
O ( E ) udt = -+
O ( E ' ) . (13)t 9 tbu
32
Incidentally, this is the only case where the consensus nucleotide does not coincide with the original nucleo- tide (incongruence) and its probability is
r 2
/4udt = 3tbu/ 8. (14)
For t b / 2 I t 5 tb, the consensus nucleotide is the origi-
nal nucleotide and the conditional expectation is t / t b
+
O( E ) . Thus, the contribution is[rI2
[i
+ O ( E ) ] udt
= - 9 Qu+
O ( c 2 ) . (15) 32Combining ( 1 2 ) , ( 1 3 ) , and ( 1 5 ) , we obtain
EIXonsl
= 1 - g/lsbu- 744u+
o(E).
(16) In analyses of SINE sequences, the divergence, D,, from the consensus and the divergence, Db, between two sequences are often computed. The expected value of D, is one minus the average consensus frequency. Thus, if tbu and t,u are small compared to one, it is approximately expressed asE [ D,] M 3/qUt,
+
g/lsUtb. (17)The expected value of Db is the heterozygosity and from ( 1 ) and
( 7 )
and if we ignore the population polymor- phism, it is approximately expressed asE [Ob] y>Ut,
+
U t b . (18)From these two equations, the relationship between the two divergences is
E 1/2E [ob]
+
%LiUtb. (19)RRITTEN ( 1988)
,
analyzing subfamilies of the primate Alu sequences, showed that 0, is a bit larger than twice the value of Db, and this suggests that the expansion period tb is not zero.SIMULATION
1036 H. Tachida
quency analytically. In addition, quantities of another interest related to shared differences whose definition is explained later are determined by the whole sample
of elements and it is impractical to compute such quan- tities analytically. Therefore, I conducted simulations.
Method: The method of simulation is a modification
of that described in HUDSON (1990). Consider a situa- tion where we sample n elements each with m nucleo- tide sites from a population. First, a genealogical tree is generated for the n elements. In the construction of the genealogical tree, the time is measured in unit of 2N generations and backward from the present (time 0 ) . A genealogical tree consists of 2n
-
1 nodes. The first n nodes correspond to n sampled elements and the latter n - 1 nodes correspond to respective coalescence events, i.e., coancestors of the sampled elements. Each node records the time of coalescence, the two descen- dant nodes that coalesced to yield the node and the ancestral node that is the next coalescence event for the current node. In the period (0, t e ),
no coalescences of elements occur. Respective elements start to partici- pate in the coalescence process in the master copy locus from t,+
according to the algorithm described in HUDSON (1990) where is an uniform random vari- able in [ 0, t b ].
Thus, after t, a coalescence occurs at a rate of n,( n, - 1 )/ 2 ,
where n, is the number of the ancestral elements of the sample that were at the master copy locus at the time. In the end, all elements coalesce to a common ancestor (designated as node A) and the genealogy is complete. Next, mutations are assigned to branches of the genealogical tree with mutation rate u.The nucleotides of the sampled elements at a site are determined according to the JUKES-CANTOR mutation model starting from node A and going down the tree to respective sampled elements. This is repeated m times with the same tree to determine the nucleotide sequence of the sampled n elements. From the gener- ated sequences, quantities of interests are computed. The whole process is repeated 1000 times to compute the mean and variance of the quantities. Mutation rates used are u = 0.002667 and u = 0.000667 that, under the JUKES-CANTOR model, give nucleotide diversities of
0.004 and 0.001, respectively, typical values found in primates ( TAKAHATA 1993).
Variance of homozygosity: The first quantity exam-
ined is the variance of estimated homozygosity among sites. Since mutations that occur in the ancestral ele- ments at the master copy locus result in changes of nucleotide in present multiple elements, such muta- tions affect nucleotide frequencies more than those that occurred after the retroposition. Thus, the variance is expected to increase as t b increases because the num-
ber of such mutations increases. This is indeed the case as shown in Figure 2 where t b is changed keeping t b
+
t, = 30. By changing tb from zero to 30, the variance of
homozygosity is almost tripled. In the figure, the stan- dard deviations of the estimated variances of homozy-
l o
1
o u = 0.002667 B$ 6
E
z
= 4u = 0.000667 B
B
0 0
0
0
0 0
0 0
0 0
0
0 0
0 0
2 j 0
0
0 0.01 0.02 0.03 0.04 0.05 0.06 0.07 0.08
u!b
FIGURE 2.-Variance of homozygosity among sites. th and t, are changed keeping tb
+
t, = 30. The mutation rate is u =0.002667. The error bars represent one standard deviation when n = 100 (sample size) and m = 200 (number of sites).
gosity when the sample size is n = 100 and the number of sites is m = 200 are also indicated by error bars. The standard deviations are generally large and this limits the utility of the variance of homozygosity as a statistics to estimate t,,.
Consensus frequency: Next we examined the aver-
age consensus frequency and compared it with the approximate result ( 1 6 ) obtained above. I also com- puted the congruence probability that the consensus nucleotide frequency, X,,, is the frequency,
&,
of the original nucleotide of the common ancestral element (Prob [ X(,, =& ]
) and the approximate value 1 -( 1 4 ) . Table 1 shows the result when th is changed, keeping t b
+
t, = 30.As
th increases, the average con- sensus frequency decreases and the congruence prob- ability decreases. As shown in the table, values com- puted from (16) and (14) are fairly close to those obtained by simulations. Slight overestimations of the approximate expressions are probably due to the pop- ulation polymorphism that will increase variation at each site. In addition to these quantities, the variance of the consensus frequency among sites is computed. The variance is computed for each sample set ( n sam- ples each with m sites) and its mean and standard deviation are shown. As the variance of homozygosity, the variance of consensus frequency increases as th increases. Again its standard deviation is very large even when m is 200.Shared difference: In the analysis of SINE elements,
TABLE 1
Expected consensus frequencies and probabilities of congruence
E [ Xofisl Prob[&, =
%I
tb t, Simulated Approximate Var[XonsI Simulated Approximate
0 30 0.939 ? 0.004 0.942 0.00115 2 0.00074 0.997 ? 0.004 1
6 24 0.943 -+ 0.003 0.945 0.00155 C 0.00087 0.992 -+ 0.007 0.994
12 18 0.946 i 0.003 0.948 0.00225 ? 0.00110 0.987 i 0.009 0.988
18 12 0.949
-+
0.004 0.951 0.00307 C 0.00130 0.981-+
0.010 0.98224 6 0.952 i 0.005 0.954 0.00386 ? 0.00148 0.974 ? 0.012 0.976
30 0 0.955
-+
0.005 0.957 0.00464 C 0.00164 0.970 -C 0.013 0.971Other parameters are n = 100 (sample size), m = 200 (number of sites) and u = 0.002667 (mutation rate). One standard
a The variance of estimated X,,, among sites is shown.
deviation is also shown for quantities obtained by simulation.
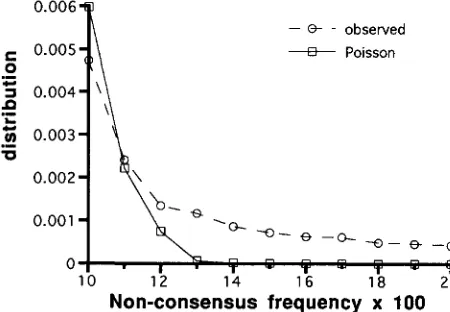
occurred on the master copy lineages. Therefore, if ( tb + t e ) u is small so that the expected nonconsensus frequency is not high (say, less than several percents), some of master copy mutations result in exceptionally higher frequencies of nonconsensus nucleotides. This is observed in our simulation. Figure 3 shows the fre- quency spectrum of the nonconsensus nucleotide for
tbu = 0.011, tpu = 0.045. If all mutations are indepen- dent, the distribution is expected to be approximately Poisson with the same mean and it is also shown for comparison. Apparently, some master copy mutations contribute to higher nonconsensus frequencies. Here, I find SD by examining whether the nonconsensus fre- quency at a site is significantly different from those at the remaining sites. More concretely, for each site, I use the
x'
to test whether the ratio of the nonconsensus frequency to the consensus frequency at the site is sig- nificantly different from that averaged over all other sites. If the test gives significance, the site is regarded as a SD-carrying site, and the second frequent nucleo- tide at the site is considered as a SD. Since there are m sites, the critical value ofx'
should be modified ac-- - observed
+ Poisson
10 12 14 16 18 20
Non-consensus frequency x 100
FIGURE 3.-Frequency spectrum of nonconsensus fre- quency. Observed values are from simulations with tb = 4, t, = 16.9, u = 0.002667, n = 100. In total 200,000 sites are examined. A Poisson distribution with the same mean, 4.10, as
that of the observed distribution is also shown for comparison.
cording to the Bonferoni procedure to avoid falsely finding SDs. By this procedure, if there is no mutation on the master copy lineage, we will find a SD site with the specified significance level. Note that this proce- dure is conservative in finding SDs because the Bonfer- oni procedure gives the critical value for the largest nonconsensus frequency among the whole sites. The number of SDs is expected to increase if the expansion period, to, increases because then the number of muta- tions on the master copy lineage increases.
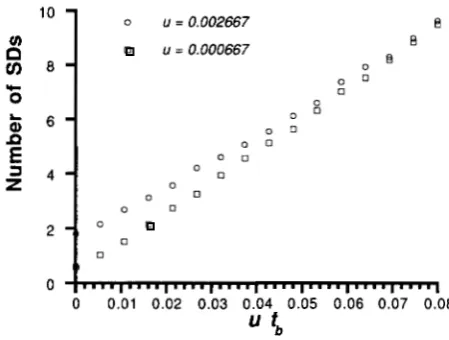
The average numbers of SDs are computed by simula- tions and they are shown as functions of utb for u = 0.00267 and u = 0.00067 in Figure 4 when ( t b
+
t e ) u = 0.08 and the number of sites is 200. They increase almost linearly as functions of utb. If we use the mono- morphic approximation, the expected number of muta- tions in the lineage of the master copy is m X u t b andlinearly increases. The average number of SDs would differ from this expected value for two reasons. First, not all master copy mutations are detected because of statistical noise from mutations after retroposition. Sec- ond, the sum of the master copy lineages that is esti-
c
>I 0.01CD
$
0.0088
E"
c
0
0
Q) 0.004
C
tu
'Z 0.002 0.006
c
3
0
I....
....
....
....
.>..
. " . T0
!
1b
1'52b
$5 30C J
1038 H. Tachida
mated as tb in the monomorphic approximation is actu- ally larger because there are multiple lineages of the master copy and mutations that occurred before the expansion begins also contribute to SDs (see values for
to = 0 in Figure 4 ) . Although relative effects of these two factors are difficult to evaluate theoretically, the average number of SDs is less than the expected num- ber of master copy mutations (200 X utb), and the former is about one-half the latter except for small val- ues of utb in this example. The standard deviations of the average number of SDs are also estimated and they are again fairly large (data not shown)
.
Correlated change: In the master copy model, if
there is no population polymorphism (or if 2Nis one) as considered in the monomorphic approximation, there is only a single lineage of the master copy. Thus, elements that have a mutation that occurred later in the master copy lineage are expected to have all the mutations that occurred before that mutation in the lineage. In the sampled sequences, this is observed as correlated changes of SD-carrying sites. Correlated changes are often used to determine subfamilies of a SINE family. In such cases, the SDcarrying sites are called diagnostic sites ( BRITTEN 1988)
.
To quantify the successive occurrences of SDs, I computed a new quan- tity, r. Consider a pair of SD-carrying sites, A and B. In the calculation of r, it is important to discriminate SDs and shared changes ( SCs ).
SCs are defined as the varia- tion that occurred later in the master copy lineages. They are not necessarily the second frequent nucleo- tides at SD-carrying sites because if mutations occur early in the master copy lineages, SC is the most fre- quent nucleotide at the site. Note that SCs are not rec- ognizable by just looking at the frequencies of nucleo- tides at the site in a subfamily. However, we may be able to determine them by inferring the nucleotide of the common ancestor of the subfamily, for example, from the sequences of older subfamilies. Let X ( A ) ,X
( B ) andX(
AB) be the numbers of elements that have SC at the site A , site B and at both A and B sites, respectively. Then, rAH is defined asThe average, r, of TAB over all pairs of SD-carrying sites
is calculated to evaluate the successiveness of SD muta- tions on the master copy lineages. If there is no poly- morphism in the master copy locus and mutations after retroposition is ignored, r is expected to become one. However, in real situations, neither condition holds true. If there are multiple lineage of the master copy, mutations do not necessarily occur successively in one lineage. If mutations occur after retroposition, SC in some elements may be changed. Both contribute to reduce r a n d thus E [ r ] is always < l .
In the simulation, the number of SD-carrying sites are not always
>
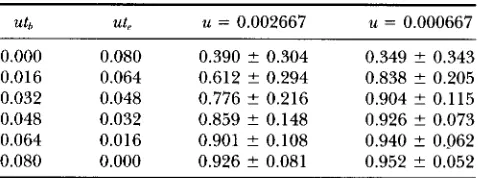
1, especially for small utb. In these cases,TABLE 2
Measure of correlated change, r
u k ut, u = 0.002667 u = 0.000667
0.000 0.080 0.390 ? 0.304 0.349 ? 0.343 0.016 0.064 0.612 ? 0.294 0.838 ? 0.205 0.032 0.048 0.776 2 0.216 0.904 2 0.115 0.048 0.032 0.859 ? 0.148 0.926 ? 0.073 0.064 0.016 0.901 ? 0.108 0.940 5 0.062 0.080 0.000 0.926 ? 0.081 0.952 ? 0.052
Other parameters are n = 100 (sample size) and m = 200 (number of sites). One standard deviation is also shown.
r was not computed and the averages were calculated excluding these cases. Table 2 shows the expected val- ues and standard deviations of r for two different values of u when to and t, are changed keeping ( to + t?) u =
0.08. E [ r ] rapidly approaches one as utb is increased from zero. This is especially evident in the case with small u . Thus, the reduction of r is largely caused by the initial polymorphism of the master copy locus, and most SC mutations that occurred in the master copy lineages after the start of retroposition are considered to be successive. Standard deviation of T is rather large
when E [ r ] is small but is small for E [ r ] 2 0.9. Thus,
if we obtain r 2 0.9, this would be a good indicator
showing large utb.
ANALYSIS OF ALU SB SUBFAMILY
Based on the theoretical result of the previous sec- tions, I analyzed the Sb subfamily of Alu sequences
(JURKA and MILOSAVLJEVIC 1991). The reasons for choosing this subfamily is that its size is not small and that it is fairly young and thus noise due to mutation is considered to be small ( JURKA and MILOSAVLJEVIC
1991; BRITTEN 199413). Sequence data are taken from the human Alu database compiled byJuRKA and main- tained in the National Center for Biotechnology Infor- mation. From this database, sequences with the subfam- ily name Sb and whose lengths are 2250 were extracted and aligned without including identical sequences. A
complete Alu element has 281 bases. A very young sub- family Sbl was not included. For the multiple align- ment, the malign program developed by HEIN in the package ODEN (INA 1994) was used with manual ad- justments. From this alignment, consensus nucleotides
TABLE 3
Estimates of averages and variances of homozygosity and
consensus frequency in the human A h Sb subfamily
Site Number - h,, Var [
Lo]
Var[&,,]AT 103 0.957 0.000884 0.978 0.000246
GC 128 0.922 0.002314 0.959 0.000721
those elements that are separated by >14 differences from the consensus. Thus, I analyzed 153 elements of the Sb subfamily at 231 sites. Only nucleotide changes were considered and changes due to indels were ex- cluded from the analysis. In the following, first, I esti- mate t,, and t, using statistics related to moments of frequencies. Then, from this information, I examine the validity of the master copy model for this data set utilizing the number of SD and the measure of corre- lated change, r.
In the analysis of data, sites whose consensus nucleo- tide are G or C (GC sites) and sites whose consensus are A or T (AT sites) should be discriminated since mutation rates at the two types of sites in noncoding regions of primates are known to differ (BAILEY et nl. 1992; BLAKE et nl. 1992; BRITTEN 1994a). Table 3 shows the estimates of the average heterozygosity (&,) , vari- ance of heterozygosity among sites (Var [
$1
),
average consensus frequency ( it,",) and variance of consensus frequency (Var [ X c , , , ] ) separately for the GC and ATsites. Because GC sites have more mutations and thus contain more information, I use the data for GC sites ( m = 128) in the following analysis. There are four statistics available and the number of parameters to be estimated is three ( tb, t, and u )
.
Therefore, we can, in principle, estimate them by methods of moments or the maximum likelihood method. Here, I do not take this approach because some of the statistics are corre- lated and there is a better estimate of u from other regions of genomes. LI and SADLER (1991) compared alleles of 49 loci in human and estimated the nucleotide diversity, T , in noncoding regions of the nuclear ge-nome to be 0.001. Expected value of T is 3 u / 2 in our
notation. TAKAHATA (1993) estimated the ratio of T in
chimpanzee to that in human to be about four. I regard
7r of chimpanzee to be typical in primate evolution and
use u = 4 X 0.001 X 2 / 3 = 0.002667. Next, I obtained
the relationship between tb and t, from the average ho- mozygosity since an analytical expression of the average homozygosity is available. From ( 1 ) and ( 6 ) , t, is ex- pressed in terms of th and u as
I calculated t, from this formula changing t,, and used them to compute means of various statistics and their standard deviations by simulation. The standard devi- ations are those when the number of sites is 128 and
the sample size is 153. The result is shown in Table 4. Because t, is adjusted so that E [
$1
equals t h e ob- served value, other three statistics, Var [ $] ,x,,,,
and Var [ can be used for the estimation of t, and t,,. Although the expected values of all these three statis- tics are monotone functions of t,,, Par [$ 1
seems to be best for estimating tb because the ratio of its one standard deviation to the difference between the two extreme values, 0.0019 and 0.0052, when t,3 are 0 and 20, respectively, is the smallest. Since the observed value of Var [b ]
is 0.00231, t,, and t, are estimated to be 4 and 16.9, respectively. The observed values ofx,,,,
and Var [ X , , , , ] are also close to the expected val- ues with these t,, and t,. However, note that since the standard deviations are all very large reliability of the estimate is not very high.Next, I examined the validity of the master copy model. The SD-carrying sites were determined by the procedure described in the previous section. The 5% critical value of the
x 2
is 12.53 when the number of sites is 128. Six SD-carrying sites were found in the GC sites. From the consensus sequence of the older families ( JURKA and MILOSAVLJEVIC 1991 ) , the original nucleo-tide at these sites are inferred and SCs were determined. All six SD-carrying sites have C or G as original nucleo- tides and the measure of correlated change, r, in these GC sites was estimated to be 0.30. The theoretical expec- tation of the number of SD and r are also shown in Table 4. With t,, = 4 and t, = 16.9, the number of SD-carrying sites and r a r e 2.18 and 0.49, respectively. Although the observed rwas within one standard devia- tion from the theoretical expectation, the observed number of SD-carrying sites was much larger than the expected value. Indeed the observed number of cases where the number of SD sites is larger than 5 was 33 out of 1000 replications in the simulation ( P = 0.033) when tb = 4, t, = 16.9 (data not shown). This suggests that the present single master copy model may not be appropriate for the Sb subfamily, although there are uncertainties, for example, in the estimation of t,, and t?, and the basis of the suggestion might not be very strong.
DISCUSSION
Assumptions of the model: In our model, mutations
are assumed to be all selectively neutral ( KIMURA
1040 H. Tachida
TABLE 4
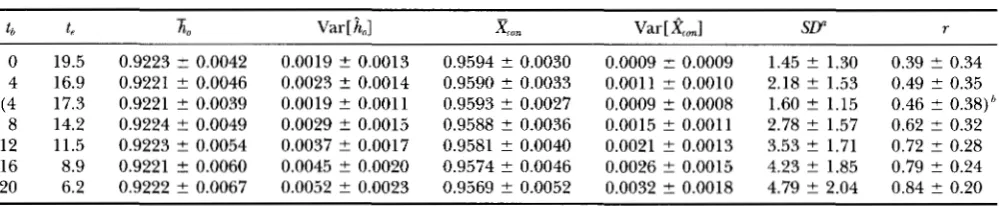
Expected values of various statistics when the homozygosity per site in 0.9222
t b
-
t, ho ~ a r [
Lo]
Z", Var [X m I
SLY r0 19.5 0.9223 2 0.0042 0.0019 t- 0.0013 0.9594 ? 0.0030 0.0009 t 0.0009 1.45 ? 1.30 0.39 ? 0.34 4 16.9 0.9221 ? 0.0046 0.0023 t 0.0014 0.9590 t- 0.0033 0.0011 ? 0.0010 2.18 ? 1.53 0.49 ? 0.35 (4 17.3 0.9221 t- 0.0039 0.0019 ? 0.0011 0.9593 ? 0.0027 0.0009 t 0.0008 1.60 2 1.15 0.46 i- 0.38)h
8 14.2 0.9224 ? 0.0049 0.0029 t 0.0015 0.9588 ? 0.0036 0.0015 ? 0.0011 2.78 2 1.57 0.62 2 0.32 12 11.5 0.9223 t- 0.0054 0.0037 ? 0.0017 0.9581 ? 0.0040 0.0021 ? 0.0013 3.53 ? 1.71 0.72 2 0.28 16 8.9 0.9221 t 0.0060 0.0045 t- 0.0020 0.9574 ? 0.0046 0.0026 ? 0.0015 4.23 ? 1.85 0.79 ? 0.24 20 6.2 0.9222 ? 0.0067 0.0052 ? 0.0023 0.9569 ? 0.0052 0.0032 2 0.0018 4.79 2 2.04 0.84 2 0.20
tb and t, are changed so that the homozygosity per site becomes 0.9222 with u = 0.002667. Other parameters are n = 153
(sample size), m = 128 (number of sites). One standard deviation is also shown. Number of SD-carrying sites.
"The values from the model in which the master copy locus is monomorphic when the expansion starts. t, is adjusted to have the same homozygosity. See text for more detail.
_I
Var [
a],
Var [X,,,] and the number of SD-carrying sites, which are affected by the number of mutations in the master copy lineage, will be reduced greatly. How- ever, the relative magnitudes of reductions in these quantities are not known and thus differential con- straints in sites may affect consequences of tests such as the one used in the previous section that utilize rela- tionships among these quantities. The method of de- tecting SD-carrying sites will still find them correctly.The mutation rate may not be constant through time. Especially, since retroposition is thought to involve re- verse transcription that is prone to cause mutation ( DEI-
NINGER 1989), the mutation rate must be high when retroposition occurs. For example, the error rate of reverse transcriptase is per reverse transcription ( LEWIN 1990, p. 349). Assuming that the number of sites is 300, this means that -3% ( 1 - exp [ -300 X ) of all new elements have at least one mutation just after retroposition. Mutations occurring at retropo-
sition can be easily incorporated into the model by in- creasing t, because such mutation affects only one ele- ment. Generally, effects of changing t, by one-tenth or less on the statistics examined are not very large.
I assumed that recombination does not occur within an element but this is not always true. Indeed, illegiti- mate recombinations ( HORSTHEMKE et al. 1987; LEHR-
MAN et al. 1987) and gene conversion (KASS et al. 1995) involving Alu elements located at different locations of the genome are known. Illegitimate recombinations usually result in large insertions or deletions and are thus harmful. Therefore, those elements that experi- ence illegitimate recombinations will be eliminated from the population and do not contribute to the pres- ent array of SINE elements. On the other hand, gene conversion affects only SINE elements and converted elements are considered to be selectively neutral. Thus, we must asses effect of gene conversion in the model in future studies though the effect may be small because gene conversion is thought to be very rare among Alu
elements ( KASS et al. 1995)
.
The retroposition rate per genome is assumed to be constant through the expansion period. There is no biological justification of this assumption except that if the rate is constant per master copy, the rate per ge- nome is constant because the number of master copy locus is one throughout time. If changes of the rate are small, the behavior may be approximated by the constant rate model. However, if the rate drastically changes, somewhat different behavior may be observed. For example, consider an extreme case where a propor- tion
p
of the elements retroposed at time tl instantane- ously and the rest ( a proportion 1 -p )
retroposed at time h . In this case, most of the master copy mutations occur between tl and and thus there would be a peak at min( p ,
1 -p )
in the spectrum of the nonconsensus frequencies. This spectrum is quite different from that of the constant rate model where a flat pattern is ob- served (see Figure 3 ) . Such a drastic change of the retroposition rate may provide an explanation for the discrepancy between the Alu Sb subfamily data and the expectations from the single master copy model as dis- cussed later.The population size is assumed to be constant through time in our analysis. Human populations are suggested to have experienced expansions, extinctions and recolonization ( TAKAHATA 1994), and such fluc- tuation of the population size is expected in the primate evolution. However, in our model, only the population size during the expansion period ( t b ) influences the results. The effect of the population size is most evident on the number of SD-carrying sites when tb is small (see Figure 4 ) . So unless the size changes occur in a short period, the result will not change much. Even if changes occur rapidly, arguments relying on the notion of effec- tive size may be applied but further studies are necessary to ascertain this conjecture.
Master Copy Model
for example, if some external agent makes the master copy locus capable of retroposition. However, the ex- pansion may start because a mutant capable of retropo- sition by itself appears at the master copy locus. A mu- tant may be neutral or selectively advantageous. If the mutant is neutral, it takes about 4Ngenerations for the mutant gene to be fixed and retroposition occurs in this period with the rate proportional to the contemporary gene frequency. Since the average sojourn time in one frequency class of a mutant gene to be fixed is about two ( " A 1972 ) , roughly 1
/
( t b+
1 ) of the pseu-dogenes retroposed in this period and this portion makes the genealogy of the elements different from that of our model. Since tb is estimated to be small, it is worthwhile to investigate this model in future studies. If the mutant is selectively favored and quickly fixed in the population, the master copy locus would be almost monomorphic when the expansion starts. This model can be simulated by a simple modification of the simula- tion program of our model by setting the largest coales- cence time to tb
+ t,.
The result for tb = 4 is shown in Table 4 (see the parenthesized row). Generally speak- ing, the statistics become smaller compared to those of the original model but differences are not so large. The largest decrease is found in the number of SD-carrying sites. Thus, this model can not explain the larger num- ber of SD-carrying sites observed in the Sb subfamily.Expansion period Based on the theoretical results,
I estimated the expansion period of the A h Sb subfam- ily and obtained tb = 4 and t, = 16.9, assuming u =
0.002667 per 2N generations. Recall that t6 and t, are measured in units of 2N generations. To estimate the expansion period in terms of years, we need to know 2Ng where g is the generation time. Note that 3/4 X u
= 2 N w , where q, is the mutation rate to the other nucleotides per year ( 3/4 is the correction factor for the Jukes-Cantor mutation scheme )
.
Thus, if we assume that mutation rate is 0.16% per million years (BAILEY et al. 1991 ),
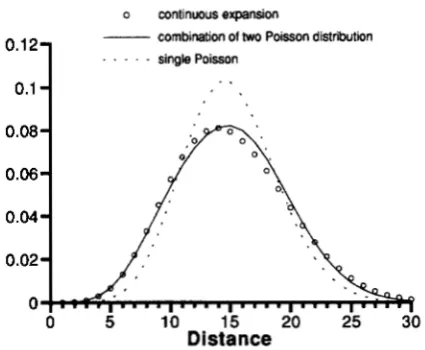
2Ng is estimated to be 1.25 million years.So the beginning and end of the expansion of the Sb subfamily are estimated to be 26 and 21 million years ago, respectively. BRITTEN (199413) obtained estimates of the expansion periods for Alu subfamilies fitting a linear combination of two Poisson distributions to the distribution of the number of differences from the con- sensus sequence, and his estimates for the Sb subfamily are 11 and 24 million years. Considering large statistical errors expected in the two estimation methods, the dif- ference between his and the present estimates is not surprising. In addition, there are two other reasons that may have caused differences of estimates due to differ- ences of the models adopted. First, BRITTEN (1994b) used sites that are considered to be conserved in the master copy lineage throughout the AZu evolution (the CONSBI positions). Thus, nucleotide differences from the consensus at the CONSBI positions are assumed to have occurred after retropositions. In our model, all
o continwus expansion
combination of two Poisson distribution
single Poisson
O . O 8 1
0.06 0.08
0.06
0.04
0.02
0
0 5 15 10 20 25 30
Distance
0
0 5 15 10 20 25 30
Distance
FIGURE 5.-The distribution of distance between SINE ele-
ment and the master copy at the CONSBI sites. 0, distribution under the continuous expansion model ( tbu = 10, teu = 10). The straight curve is obtained by fitting a linear combination of two Poisson distributions to that of the continuous expan- sion. The dotted curve is the Poisson distribution with the mean 15.
differences are assumed to be neutral and free to change driven by mutation. In fact, some of the SD- carrying sites (sites 1, 144,217) detected in the present analysis are CONSBI sites, suggesting that mutations occurred at these sites before retroposition. Second, BRITTEN (1994b) fitted a linear combination of two Poisson distributions and thus the two estimates corre- spond to the times of two instantaneous expansion events each with a duration zero. In our model, continu- ous expansion with a duration of t6 is assumed. It is difficult to discriminate these two modes of expansion. This is illustrated in Figure 5 where the distribution (circle) expected from a continuous expansion ( tbu = 10 and t,u = 10) is fitted by a combination (straight line) of two Poisson distributions with means 11.1 and 16.7, respectively. For comparison, a Poisson distribu- tion with the same mean ( 15) as the other two distribu- tions is shown. Evidently, the Poisson distribution is different from the two other distributions, but the distri- bution of continuous expansion and that of the linear combination are similar. To discriminate the two modes of expansion, measures other than the difference from the consensus might be necessary to be examined.
Validity of the model and alternatives: If the expan-
sion period is short compared to the time since the expansion started ( t,
>
t b ) as estimated here, the num-1042 H. Tachida
quencies are higher than the critical values of the
x'
test to find SD but lower than those expected from the single master copy model. In the single master copy model, the nonconsensus frequency spectrum is rather flat (Figure 3 ).
Some alternative models may produce larger numbers of SD-carrying sites with the same amount of the variance of homozygosity. For example, if balancing selection keeps several alleles at the master copy locus for a long time, separate lineages are created and the nonconsensus frequencies at SD-carrying sites will be decreased. Similarly if there are multiple master copy loci, the probability of the nonconsensus fre- quency being in the middle range will decrease. The existence of multiple master copies is suggested in the youngest Sbl subfamily (MATERA et al. 1990; LEEFLANGet al. 1992; HAMMER 1994). Also drastic changes of the retroposition rate result in a nonflat spectrum of the nonconsensus frequency as discussed earlier. Although these models seem to explain the phenomenon qualita- tively, we need to investigate these and other models in a similar manner as has been done in the present paper to know whether the data fit to the values ex- pected from respective models or not and to estimate relevant parameters.
I thank B. WAI.SH and two anonymous reviewers for valuable com- ments. This research was partially supported by a grant-in-aid from the Ministry of Education, Science and Culture of Japan.
LITERATURE CITED
BATLER, M. A., G. E. KILROY, P. E. RICHARD, T. H. SHAIKH, T. D. DESSEILE et al., 1990 Structure and variability of recently in- serted Alu family members. Nucleic Acids Res. 18: 6793-6798. BAII.EY, W. J., D. H. A. FITCtf, D. .4. TA(;I.E, J. CZELUSNIAK, J. L.
SLICHTOM et al., 1991 Molecular evolution of the psi eta-globin gene locus: gibbon phylogeny and the hominoid slowdown. Mol. Biol. Evol. 8: 155-184.
BAILEY, W. J., K. HAYAWKA, C. G. SKINNER, S . KEHOE, L. C. SIEU P I
aL, 1992 Reexamination of the African hominoid trichotomy with additional sequences from the primate beta-globin gene cluster. Mol. Phylogenet. Evol. 1: 97-135.
BLAKE, R. D., S . T. H ~ s s and J. Nr(:HOiSON-TUEI.l., 1992 The influ- ence of nearest neighbors on the rate and pattern of spontaneous point mutations.,J. Mol. Evol. 34: 189-200.
BRITTEN, R. J., 1994a Evolutionary selection against change in many Alu repeat sequences interspersed through primate genomes. Proc. Natl. Acad. Sci. USA 91: 5992-5996.
BRITTEN, R. J., 1994b Evidence that mast human Alu sequences were inserted in a process that ceased about 30 million years ago. Proc. Natl. Acad. Sci. USA 91: 6148-6150.
BRITTEN, R. J., W. F. BARON, D. STOUT and E. H. DAVIDSON, 1988 Sources and evolution of human Alu repeated sequences. Proc. Natl. Acad. Sci. USA 85: 4770-4774.
BROOKFIEID, J. F. Y., 1986 A model for DNA sequence evolution within a transposable element family. Genetics 112: 393-408. BROOKFIELD, J. F. Y., I993 The generation of sequence similarity in
SINEs and LINES. Trends Genet. 9: 38.
DEININGER, P. L , 1989 SINEs: short interspersed repeated DNA ele- men& in higher eukaryotes, pp. 619-636 in Mobile DNA, edited by M. HOWL and D. BERG. ASM Press, Washington, DC.
Encm.~., 19Y2 Master genes in mammalian repetitive DNA am- plification. Trends Genet. 9: 307-311.
DEININGER, P. L., M. A. BATZER, C. A. HUTCHISON 111 and M. H.
HAMMER, M. F., 1994 A recent insertion of an alu element on the Y chromosome is a useful marker for human population studies.
Mol. B i d . Evol. 11: 749-761.
HORSTHEMKE, B., U. BEISIEGEL, A. DUNNING, J. R. HAVINGA, R. WI1,
1.IAMSOK et al., 1987 Unequal crossing-over between two a h - repetitive DNA sequences in the low-density-lipoprotein-receptor gene. A possible mechanism for the defect in a patient with familial hypercholesterolaemia. Eur. J. Biochem. 164: 77-81. HUDSON, R. R., 1990 Gene genealogies and the coalescent process.
Oxf. Suw. Evol. Biol. 7: 1-44.
IN& Y., 1994 ODEN: a program package for molecular evolutionaty analysis and database search of DNA and amino acid sequences. CABIOS 10: 11-12.
JLKES, T. H., and C. R. CANTOR, 1968 Evolntjon of protein mole- cules, pp. 21-132 in Mammalian Protein Metabolism, edited by H. N. MCNRO. Academic Press, New York.
JURKA, J., and A. MII.OSA~JEVIC:, 1991 Reconstruction and analysis of human Alu genes.J. Mol. Evol. 32: 105-121.
JURKA, J., and T. SMITH, 1988 A f~mdamental division in the Alu family of repeated sequences. Proc. Natl. Acad. Sci. USA 85: 4775-4778.
KASS, D. H., M. A. BA-~LER and P. L. DEININGER, 1995 Gene conver- sion as a secondary mechanism of short interspersed element (SINE) evolution. Mol. Cell. Biol. 15: 19-25.
KAPiAN, N. L., and R. R. HUDSON, 1989 An evolutionary model for highly repeated interspersed DNA sequences, pp. 301-314 in
Mathematical Evolutionaly Theoly, edited by M. W. FELDMAN.
Princeton University Press, Princeton, NJ.
KIDO, Y., M. HIMBERG, N. TAKASAKI and N. OKADA, 1994 Amplifica- tion of distinct subfamilies of short interspersed elements during evolution of the Salmonidae. J . Mol. Biol. 241: 633-644.
KIMURA, M., 1968 Evolutionaty rate at the molecular level. Nature
217: 624-626.
KIMLJRA, M., 1983 The Neutral T h e q of Mobcular Evolution. Cam- bridge University Press, Cambridge.
KIMURA, M., and J. F. CROW, 1964 The number of alleles that can be maintained in a finite population. Genetics 49: 725-738. LABUIM, D., and G. STRIKER, 1989 Sequence conservation in Alu
evolution. Nucleic Acids Res. 17: 2477-2491.
LEEFIANG, E. P., W.-M. LIU, C. HASHIMOTO, P. V. CHOUDARY and C. W.
ScHMln, 1992 Phylogenetic evidence for multiple A u source genes. J. Mol. Evol. 35: 7-16.
LEHRMAN, M. A,, .J. L. GOLDSTEIN, D. W. RUSSEL and M. S. BROWN, 1987 Duplication of seven exons of I.DL receptor gene caused by Alu-ah1 recombination in a subject with familial hypercholes- terolemia. Cell 48: 827-835.
LEWK, B., 1990 GENES W. Oxford University Press, Oxford. Lr, W.-H., and L. A SADLER, 1991 Low nucleotide diversity in man.
Genetics 129: 513-523.
MATEM, A. G., U. Hkx.i.M,w, M. F. HINTZ and C. W. SCHMID, 1990 Recently transposed Alu repeats result from multiple source genes. Nucleic Acids Res. 18: 6019-6023.
MARWAMA, T., 1972 The average number and the variance of gener- ations at particular gene frequency in the course of fixation of a mutant gene in a finite population. Genet. Res. 19: 109-113. OHTA, T., 1986 Population genetics of an expanding family of mo-
bile genetic elements. Genetics 113: 145-159.
OKADA, N., 1991 SINEs. Curr. Opin. Genet. Dev. 1: 498-504. QUENTIN, Y., 1988 The Alu family developed through successive
waves of a fixation closely connected with primate lineage histoty.
J. Mol. Evol. 27: 194-202.
SHEN, M. R., M . A. BAXXR and P. L. DKNNGER, 1991 Evolution of the master Alu genes. J. Mol. Evol. 33: 311-320.
TACIIIDA, H., and M. IIZC'KA, 1993 A population genetic study of the evolution of SINEs. I. Polymorphistn with regard to the pres- ence or absence of an element. Genetics 133: 1023-1030. TAKAHATA, N., 1993 Relaxed natural selection in human popula-
tions during Pleistocene. Jpn. J. Genet. 68: 539-547.
TAKAHATA, N., 1994 Repeated Failures that led to the eventual suc-
C ~ S S in human evolution. Mol. Biol. Evol. 11: 803-805.