Division VII
SEISMIC RISK ASSESSMENT FOR ISOLATED NUCLEAR POWER
PLANTS: THE IMPLICATIONS OF A STOP
Manish Kumar1, and Andrew S. Whittaker2
1
Assistant Professor, Department of Civil Engineering, Indian Institute of Technology Gandhinagar, India; formerly graduate student, University at Buffalo, Buffalo, NY, USA.
2
Professor, Department of Civil, Structural and Environmental Engineering, University at Buffalo, Buffalo, NY, USA; Director, MCEER.
ABSTRACT
Nuclear power plants (NPPs) are designed and assessed for severe earthquake shaking, which can pose significant demands on the structural system and internal equipment. Base isolation is a viable means to substantially reduce seismic risk. In the United States, isolation systems will comprise seismic bearings designed and tested to maintain the axial load carrying capacity with a 90+% confidence at the 90th percentile displacement for beyond design basis (BDB) shaking, where BDB shaking is linked to a uniform hazard response spectrum with a return period of 100,000 years. The earthquake risk is conservatively quantified herein in terms of annual frequency of unacceptable performance of an individual isolator, which provides a metric to compare the three risk-reduction strategies, namely, 1) testing prototype isolators to achieve higher confidence than 90%, 2) testing isolators to a greater
displacement and corresponding axial load, and 3) providing a stop at the 90th percentile displacement for
BDB shaking. Testing the isolators to 90% confidence at the 90th percentile BDB displacement results in
a risk significantly smaller than 1×10⁻⁶ if the isolation system is complemented by a stop. Increasing either the confidence level and/or the displacement for prototype testing may not reduce risk to less than 1×10⁻⁶.
INTRODUCTION
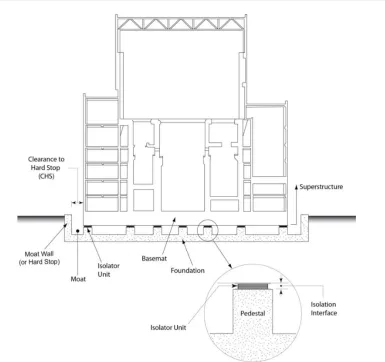
Figure 1 is a cross section through an isolated generic nuclear power plant (NPP), identifying the isolation system, the (hard) stop, and the isolated superstructure. Although there have been more than 10,000 applications of seismic isolation technology in the world to buildings, bridges and infrastructure, the applications to nuclear facilities are few in number. In the United States, the main impediments to the use of seismic isolation in nuclear facilities have been: 1) the small number of new build NPPs, and 2) a lack of regulatory guidance. The forthcoming NUREG entitled “Technical considerations for seismic isolation of nuclear facilities” (Kammerer et al. (forthcoming)) and Chapter 12 of ASCE 4-16 (ASCE 2016) address the second impediment by providing guidance on analysis and design of seismically isolated NPPs (NUREG) and Department of Energy facilities (ASCE 4-16), and on testing of prototype and production isolators.
Figure 1. Schematic of a seismically isolated nuclear power plant (adopted from Kammerer et al. (forthcoming)).
SEISMIC HAZARD AT THE SITES OF NUCLEAR FACILITIES IN THE UNITED STATES
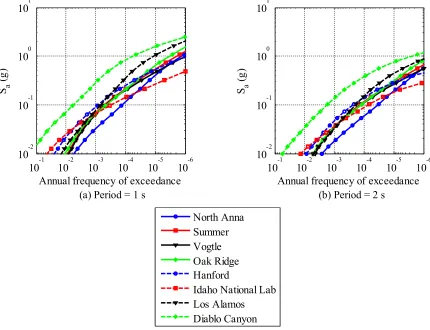
Figure 2 presents the seismic hazard (spectral acceleration plotted against annual frequency of exceedance) at eight sites of nuclear facilities in the United States (see Figure 3) for two periods, 1 s and
2 s1, 5% damping, and a shear wave velocity in the upper 30 m of the soil column of 760 m/s. The data
are obtained from http://geohazards.usgs.gov/hazardtool/application.php (accessed, December 30, 2014).
SEISMIC HAZARD DEFINITION FOR ISOLATED NUCLEAR POWER PLANTS
Two levels of seismic hazard are defined for seismically isolated NPPs per Kammerer et al. (forthcoming): 1) ground motion response spectrum+ (GMRS+), and 2) beyond design basis (BDB) GMRS. Ground motion response spectrum is the product of a design factor and a uniform hazard response spectrum (UHRS) with a mean annual frequency of exceedance (MAFE) of 10-4. The design factor can be set equal to 1.0 for isolated NPPs (see Kumar et al. (2015, 2017)). The GMRS+ is the envelope of the GMRS and a regulator-specific minimum response spectrum (e.g., an appropriate spectral
shape anchored to a peak ground acceleration of 0.1 g). The proposed beyond design basis GMRS is the
greater of the UHRS with an MAFE of 10-5 and 167% of the GMRS+.
10
-6
10
-5
10
-4
10
-3
10
-2
10
-1
10-2 10
-1
100 101
Annual frequency of exceedance
S a
(
g
)
10
-6
10
-5
10
-4
10
-3
10
-2
10
-1
10-2 10
-1
100 101
Annual frequency of exceedance
Sa
(
g
)
(a) Period = 1 s (b) Period = 2 s
North Anna Summer Vogtle Oak Ridge Hanford
Idaho National Lab Los Alamos Diablo Canyon
Figure 2. Seismic hazard curves for eight sites of nuclear facilities in the United States and 5% damping (adopted from Kumar et al. (2015)).
PERFORMANCE OBJECTIVES FOR ISOLATED NUCLEAR POWER PLANTS
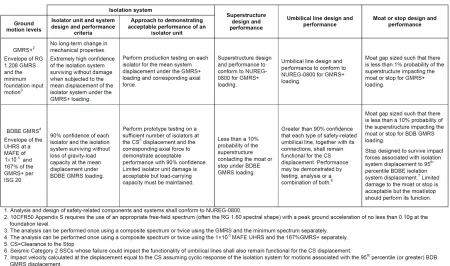
Performance goals related to the isolation system outlined in Kammerer et al. (forthcoming) are: 1) the probability of the isolated superstructure striking the stop should be 1% (10%) or less for the GMRS+ (BDB GMRS) shaking, and 2) the probability of loss of axial load carrying capacity of the bearings should be 10% or less at a displacement equal to the clearance to the stop (CS). Assuming the stop is placed at the 90th percentile displacement for BDB GMRS shaking2, these performance goals can be achieved by testing the bearings with 90+% confidence at the displacement equal to the CS and corresponding axial load. Table 1 presents the proposed performance and design expectations for isolated NPP structures.
Table 1: Performance objectives for seismically isolated nuclear power plant structures1 (adapted from Kammerer et al. (forthcoming))
ANNUAL FREQUENCY OF UNACCEPTABLE PERFORMANCE OF ISOLATION SYSTEM
Hazard Definition
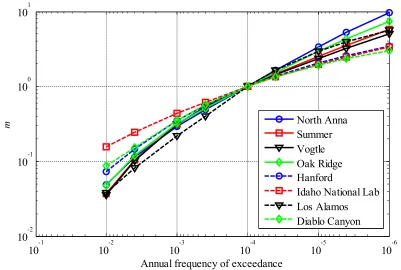
For the calculations presented here, seismic hazard is defined in terms of the average of multiples, m, of
the 1 s and 2 s UHRS ordinates3, 4 at MAFE of 10-4. The seismic hazard curves for the eight sites of Figure 3 are plotted in Figure 4.
2 The 90th percentile displacement for BDB GMRS shaking is greater than the 99th percentile displacement for GMRS+ shaking (e.g., Kumar and Whittaker (2015), Kumar et al. (2015)).
3 The ratio of the 1 s UHRS ordinates with an MAFE of 10-5 to 10-4 differs from that for the 2 s UHRS ordinates by 10% or less for the sites considered in this study (e.g., Kumar et al. (2015, 2017)).
10
-6
10
-5
10
-4
10
-3
10
-2
10
-1
10-2 10
-1
100 101
m
Annual frequency of exceedance
North Anna Summer Vogtle Oak Ridge Hanford
Idaho National Lab Los Alamos Diablo Canyon
Figure 4. Annual frequency of exceedance of multiples, m, of UHRS with MAFE of 10-4 (adopted from
Kumar et al. (2015)).
Fragility Curves
The failure of one isolator is assumed to trigger the failure of the isolation system: a very conservative assumption that considers demands and capacities of all the isolators in a system are fully correlated. The fragility curve for an isolator (and thus the isolation system) can be defined as follows
log
p
θ X β m (1)
where θ is the median and βis the logarithmic standard deviation , Xp corresponds to a probability of
exceedance of p for a normally distributed data set, and m was defined previously. The value of β is set equal to 0.02 in this study because stringent quality control will be imposed on isolator production. (Results for other values of β are presented in Kumar et al. (2015, 2017).)
Per Table 1, isolators are prototype tested to confirm their axial load carrying capacity at a 90th percentile BDB GMRS displacement (the assumed location of the stop) and corresponding axial load with a 90+% confidence. The 90th percentile BDB GMRS displacement is approximately equal to the median 110% BDB GMRS displacement (see Kumar et al. (2015)): a transformation that enables the use of a consistent demand parameter for the risk calculations. Equation (1) can now be rewritten as
log AR
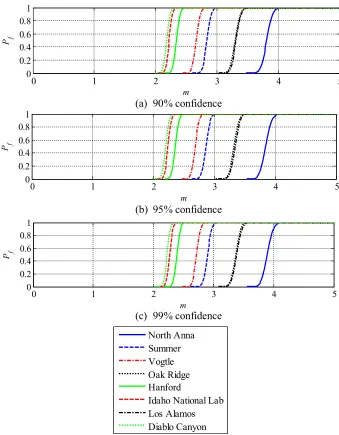
where α is 1.28, 1.64, and 2.33, respectively, for confidence levels on the isolator performance of 90% (1 failure in 10), 95% (1 failure in 20), and 99% (1 failure in 100), and fAR is 1.1. Figure 5 presents the
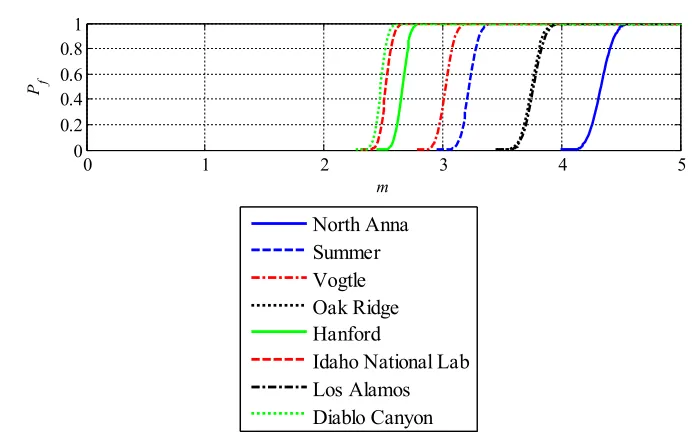
median fragility curves for the three confidence levels, fAR 1.1, and the eight sites of Figure 3. The isolators can be tested at displacements greater than the 90th percentile BDB GMRS (or median 110% BDB GMRS) displacement and corresponding axial load to reduce the risk (likelihood of failure). Figure 7 presents the fragility curve for 90% confidence of isolator performance tested at the median
125% BDB GMRS displacement
fAR1.25
.
0 1 2 3 4 5
0 0.2 0.4 0.6 0.8 1
m
P f
(a) 90% confidence
0 1 2 3 4 5
0 0.2 0.4 0.6 0.8 1
m
P f
(b) 95% confidence
0 1 2 3 4 5
0 0.2 0.4 0.6 0.8 1
m
Pf
(c) 99% confidence
North Anna Summer Vogtle Oak Ridge Hanford
Idaho National Lab Los Alamos Diablo Canyon
Figure 5. Probability of unacceptable performance, Pf, of individual isolator units for the three confidence
levels on isolator performance at median displacement for 110% BDB GMRS shaking plotted against
0 1 2 3 4 5 0
0.2 0.4 0.6 0.8 1
m Pf
North Anna Summer Vogtle Oak Ridge Hanford
Idaho National Lab Los Alamos Diablo Canyon
Figure 6. Probability of unacceptable performance, Pf, of individual isolator units for 90% confidence at
median displacement for 125% BDB GMRS shaking plotted against multiples, m, of UHRS shaking with
MAFE of 10-4, without a stop (adopted from Kumar et al. (2015)).
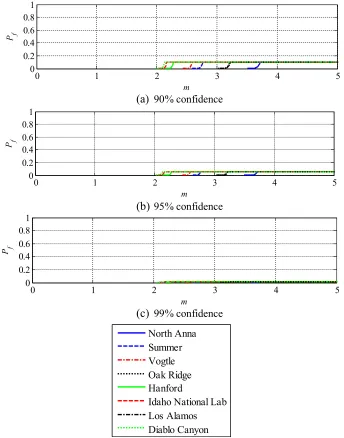
The fragility curves of Figures 5 and 6 are for the isolation systems without a stop. These curves are truncated if a stop is present. Figure 7 presents the fragility curves for the cases considered in Figure 5,
but with a stop installed at the 90th percentile BDB GMRS (or median 110% BDB GMRS) displacement.
Risk Calculations
The total annual frequency of unacceptable performance of the isolation system, PF i, solation, is given by ASCE (2005):
, solation 0
|
F i D f
d
P H P GM m dm
dm
(3)
where HD is the mean annual exceedance frequency of seismic hazard,
P GMf | m
is the annualfrequency of unacceptable performance for the m times UHRS shaking with an MAFE of 10-4, and other
parameters were defined previously.
Tables 2, 3 and 4 present the annual frequencies of unacceptable performance of the isolation system corresponding to the fragility curves of Figures 5, 6 and 7, respectively. The risk is reduced if the isolators are tested with either greater confidence to a given lateral displacement, or at a greater displacement and corresponding axial loads, for a specified level of confidence. For example, the annual frequency of unacceptable performance of the isolation system is reduced from 5.5×10⁻⁶ to 5.0×10⁻⁶ for the site of Diablo Canyon as the confidence of isolator performance is increased from 90% to 99% at the median 110% BDB GMRS displacements (see Table 2), and to 2.9×10⁻⁶ if the bearings are tested with 90% confidence at median 125% BDB GMRS displacement (see Tables 2 and 3). The annual frequency of
of the NUREG for the seismic isolation system) for the confidence levels and displacements considered in this study, if a stop is not provided (Kumar et al. 2015, 2017).
0 1 2 3 4 5
0 0.2 0.4 0.6 0.8 1
m
P f
(a) 90% confidence
0 1 2 3 4 5
0 0.2 0.4 0.6 0.8 1
m
Pf
(b)95% confidence
0 1 2 3 4 5
0 0.2 0.4 0.6 0.8 1
m
P f
(c) 99% confidence
North Anna Summer Vogtle Oak Ridge Hanford
Idaho National Lab Los Alamos Diablo Canyon
Figure 7. Probability of unacceptable performance, Pf, of individual isolator units for the three confidence
levels on isolator performance at median displacement for 110% BDB GMRS shaking plotted against
multiples, m, of UHRS shaking with MAFE of 10-4, with a stop (adopted from Kumar et al. (2015)).
Table 2: Annual frequency of unacceptable performance (10-6) of individual isolator units tested at median displacement for 110% BDB GMRS shaking, without a stop.
Confidence
Site North
Anna Summer Vogtle
Oak
Ridge Hanford Idaho
Los Alamos
Diablo Canyon
90% 7.8 7.2 7.0 7.5 6.2 6.2 6.9 5.5
95% 7.7 7.1 6.8 7.4 6.0 6.0 6.7 5.4
99% 7.5 6.8 6.6 7.2 5.6 5.7 6.4 5.0
Table 3: Annual frequency of unacceptable performance (10-6) of individual isolator units tested at median displacement for 125% BDB GMRS shaking, without a stop.
Site North
Anna Summer Vogtle
Oak
Ridge Hanford Idaho
Los Alamos
Diablo Canyon
6.0 5.1 4.7 5.6 3.6 3.6 4.6 2.9
Table 4: Annual frequency of unacceptable performance (10-6) of individual isolator units tested at median displacement for 110% BDB GMRS shaking, with a stop.
Confidence
Site North
Anna Summer Vogtle
Oak
Ridge Hanford Idaho
Los Alamos
Diablo Canyon
90% 0.8 0.8 0.8 0.8 0.7 0.7 0.8 0.7
95% 0.4 0.4 0.4 0.4 0.4 0.4 0.4 0.3
99% 0.08 0.08 0.08 0.08 0.07 0.07 0.08 0.07
SUMMARY AND CONCLUSIONS
This paper summarizes a study on the seismic risk associated with the failure of an isolation system designed and tested in accordance with the forthcoming NUREG entitled “Technical considerations for seismic isolation of nuclear facilities”. Seismic hazard at sites of eight nuclear facilities across the United
States are defined in terms of multiples of UHRS with an MAFE of 10-4. Fragility curves for the isolation
system are developed conservatively assuming that a single isolator represents the isolation system of an NPP, implying that the loss of axial load carrying capacity of an isolator constitutes the unacceptable performance of the isolation system. The risk is quantified in terms of mean annual frequency of unacceptable performance of the isolation system. Effects of testing the isolators to achieve a greater confidence and/or at a greater displacement, and installing a stop, are studied. A stop at the 90th percentile BDB GMRS (linked to the return period of 100,000 years) displacement is recommended for NPPs. Testing isolators to achieve a greater confidence or to horizontal displacements greater than the 90th percentile BDB displacement substantially reduces risk if a stop is provided.
ACKNOWLEDGEMENTS
Financial support for this research project was provided by the United States Nuclear Regulatory Commission (USNRC) through a grant to MCEER via a contract led by Dr. Robert Budnitz at the Lawrence Berkeley National Laboratory (LBNL). The authors acknowledge the important technical contributions of the Dr. Budnitz and the LBNL review panel to this research endeavour.
REFERENCES
American Society of Civil Engineers (ASCE) (2005). “Seismic design criteria for structures, systems and components in nuclear facilities,” ASCE/SEI Standard 43-05, Reston, Virginia.
American Society of Civil Engineers (ASCE) (2016). “Seismic analysis of safety-related nuclear structures,” ASCE/SEI Standard 4-16, Reston, Virginia.
Kammerer, A., Whittaker, A. S., and Constantinou, M. (forthcoming). “Technical considerations for seismic isolation of nuclear facilities,” Report NUREG-****, United States Nuclear Regulatory Commission, Washington, D.C.
Kumar, M., and Whittaker, A. S. (2015). “On the calculation of the clearance to the hard stop for seismically isolated nuclear power plants,” Proc., 23rd Conference on Structural Mechanics in Reactor Technology (SMiRT23), Paper No. 249, Manchester, UK.
Kumar, M., Whittaker, A. S., and Constantinou, M. C. (2015). “Seismic isolation of nuclear power plants using sliding bearings,” Report MCEER-15-0006, University at Buffalo, The State University of New York, Buffalo, NY.