Abstract
SHAH, ADITYA NARESH. Speeding Changeover in Pharmaceutical Packaging. (Under the direction of Dr. Wilbur L. Meier Jr.)
Pharmaceutical companies increasingly are working to improve productivity and reduce costs in their manufacturing and packaging operations. Expanding markets and innovative marketing strategies have lead to an increased demand in pharmaceutical packaging products. To achieve goals of lower costs, greater flexibility, and increased capacity without substantial investment, pharmaceutical packaging plants are working to streamline their operations by application of lean production and management techniques.
Speeding Changeover in Pharmaceutical Packaging
By
Aditya N. Shah
A thesis submitted to the Graduate Faculty of North Carolina State University
in partial fulfillment of the requirements for the Degree of
Master of Science in
INDUSTRIAL ENGINEERING
Raleigh, North Carolina
2004
APPROVED BY:
________________________________
Biography
Aditya Shah was born on 3rd November, 1980 in the vibrant city of Bombay (Mumbai), India. He received his Bachelors degree in Production Engineering (B.E.) from D. J. Sanghvi College of Engineering, affiliated to the University of Mumbai, India.
Acknowledgements
I would like to express my deepest and heartfelt gratitude to my graduate advisor, Dr. Wilbur Meier for his advice, guidance and sincere motivation. His constant encouragement and support were critical for the timely completion of my thesis.
I am grateful to my committee members, Dr. Thom Hodgson and Dr. Cecil Bozarth for their cooperation and support. I would like to thank Dr. Henry Nuttle for his guidance and support. I would like to thank everyone at Merck Manufacturing Division, Wilson NC (especially David Lohr, Jennifer Cone, Brent Holloman and Raheel Valiani) for their invaluable help and guidance during the course of this project.
Table of Contents
List of Figures ... vi
List of Tables ... vii
INTRODUCTION ... 1
1.1 Overview... 1
1.2 Research... 2
LITERATURE REVIEW ... 3
2.1 Lean
Manufacturing... 3
2.2 Pharmaceutical
Industry... 4
PROBLEM STATEMENT... 7
3.1 Current
Scenario ... 7
3.2 Proposed
Solution ... 9
PROCESS DESCRIPTION ... 13
4.1
Pharmaceutical Changeover... 13
4.2
FDA’s Impact on the Changeover Process ... 14
4.3
Cleanup - Major Part of the Changeover ... 16
METHODOLOGY to REDESIGN THE CHANGEOVER PROCESS... 19
5.1
Methodology... 19
5.2 Project
Startup... 21
5.3 Measurement
phase... 24
5.4 Classification
phase ... 28
5.5 Schedule
Building... 31
5.7 Training... 35
RESULTS ... 36
6.1 Results
Achieved ... 36
6.2 Expected
Benefits ... 38
CONCLUSION & FUTURE WORK... 40
7.1 Conclusion ... 40
7.2 Future
Work... 42
Bibliography ... 44
Appendix A... 46
Appendix B ... 47
List of Figures
Figure 1 - Variation in Packaging Demand Forecasts and Actual Volumes ... 8
Figure 2- Alternatives in Meeting Packaging Requirements... 9
Figure 3- Packaging Operation Process Map... 10
Figure 4- Evaluation of Value-added and Non Value-added Time in Packaging ... 10
Figure 5- Evaluation of Planned Downtime ... 11
Figure 6– Disadvantages Due to Excessive Changeover Time ... 14
Figure 7– Pharmaceutical Changeover ... 18
Figure 8- Setup Reduction Process... 20
Figure 9- Team Structure ... 22
Figure 10- Classification by Nature of Activity ... 27
Figure 11– Redesigned Changeover ... 36
Figure 12– Results of Changeover Improvement ... 37
Figure 13– Classification of Activities After Improvement ... 38
Figure 14– Relationship between Volume and Cost Per Package... 39
Figure 15– Importance of Process Controls... 41
List of Tables
Table 1– Sample Summary Task List... 26
Table 2 – Six Questions of Kipling... 28
Table 3– Application of the Task list During the Classification Meetings... 29
Table 4 - Sample Schedule ... 32
Chapter 1
INTRODUCTION
1.1
Overview
In recent years, pharmaceutical manufacturing and packaging operations have struggled to respond quickly to market demand while overcoming operational inefficiencies. An increase in the number and complexity of product configurations, coupled with the demands of compliance with regulations in a time of growing market pressure, has made it a challenge to maintain a stable performance in the marketplace.
Lean production aims to develop a robust operation that is responsive, flexible, predictable and consistent. It creates a manufacturing operation which focuses on continuous improvements through minimizing non-value added activities while performing the critical activities efficiently. Setup time reduction is a widely used lean manufacturing tool and is a cornerstone of any lean operation. Smaller setup times can produce many benefits, including added flexibility, lower inventory costs, improved quality, increased equipment utilization, and faster production turnaround (Leschke, 1998). This study describes techniques used to reduce the planned changeover time on a pharmaceutical packaging line, thereby increasing existing capacity, reducing standard cost and adding flexibility to the packaging operation.
1.2 Research
This research is concerned with reducing changeover time and subsequent costs for a multinational pharmaceutical company. Production for this company takes place at different sites in Europe, the Americas, Australia and Asia where a broad range of innovative products are discovered, developed, manufactured and marketed. The site at the focus of this lean production application is a pharmaceutical packaging facility in the USA.
Chapter 2
LITERATURE REVIEW
2.1 Lean
Manufacturing
The concept of lean manufacturing originated in Japan after World War II. In response to declining resources, Japanese manufacturers started to embrace new, lower cost, manufacturing practices. In the 1950s, automobile manufacturer Toyota started to develop the process of developing and refining manufacturing processes to minimize waste in all aspects of their operations (Thompson and Mintz, 1999). Lean production aims to do more with less – less time, less space, less human effort, less machinery, and less material while meeting customer requirements (Womack, 1990). Lean manufacturing is aimed at the identification and elimination of “waste” in every area of production including human effort, inventory, processes, time and space which makes the manufacturer more responsive to customer demand while producing world-class quality products in the most efficient and economical manner (Todd, 2000). Russell and Taylor (1999) define “waste” as ‘anything other than the minimum amount of equipment, materials, parts, space and time that are essential to add value to the product’.
production, and increased flexibility. Lean manufacturing uses tools such as one-piece flow, cellular manufacturing, total productive maintenance (TPM), workplace organization - 5S, pokayoke- mistake proofing, and single minute exchange of dies (SMED) – quick setups. These tools improve the business efficiency by making improvements and reducing non-value added activities in different areas of business.
Manufacturing organizations are under continual pressure to increase productivity and improve their flexibility and responsiveness to meet customer demands (McIntosh et al., 1996). Lean production systems have the ability to be responsive and flexible, producing small batches and meeting constantly changing customer requirements. The option of setup or changeover reduction as the means of improving system performance complements the notion of using lean manufacturing techniques to create a more flexible manufacturing environment. Smaller setup times can produce many benefits, including lower inventory costs, improved quality, increased equipment utilization, and faster production turnaround (Leschke, 1997). Rapid setups were pioneered by Toyota in the 1960s (Cusumano, 1986), and many studies of Japanese manufacturing techniques (Golhar and Stamm, 1991) have noted the importance of setup time reductions. Shingo (1985), one of the key figures in the introduction of rapid setups at Toyota developed the single minute exchange of dies (SMED) technique over a period of 19 years. SMED refers to the theory and technique for simplifying and improving operational activities to complete a setup operation in less than ten minutes. Although not every setup can literally be completed such short time, this is the goal for the technique which can be met in surprisingly high number of cases.
disparity. To the FDA, with its mission of protecting patient safety, it has appeared more important to manufacture medicines precisely to specification, using tried-and-true systems rather than following the latest trends in manufacturing. As emphasized by Haystead (2003) manufacturing has not been given the same level of attention as other segments of the industry. However the rapidly changing realities of the pharmaceutical industry are forcing pharmaceutical manufacturers to adopt manufacturing innovations.
The top 16 U.S. pharmaceutical companies spend more than $90 billion on manufacturing each year, according to a recent Wall Street Journal article (Abboud and Hensley, 2003). This total expenditure that includes materials, labor, operations, and depreciation of investments is estimated to account for more than 36 percent of the industry's overall expenditures, and is more than double the annual spending on research and development. Since prescription drugs are so profitable, the industry for years has not been motivated to improve efficiency. Now however, the payoff from investing in drug discovery is diminishing due to fewer new products coming out of research laboratories. Therefore, savings from improving manufacturing processes are now looked upon as key sources to help establish profits.
As discussed in earlier sections, lean production aims to minimize or eliminate the non-value added activities while focusing on performing the value added activities efficiently. For reasons discussed in later sections, the focus of this investigation is to reducing changeover time through application of lean manufacturing techniques. As emphasized in the article by Forcinio (2001), one of the most significant problems affecting productivity on a pharmaceutical packaging line is downtime as a result of changeover between products or packaging configurations. Shortening changeover time adds flexibility and reduces costs while offering more capacity to produce additional product. Previous investigations (McIntosh et al., 1996) in this area have applied setup reduction techniques in pharmaceutical manufacturing. However their research focused on reducing setup times using automated and specialized equipment. Their research also discussed issues observed in sustaining improvements.
Chapter 3
PROBLEM STATEMENT
3.1 Current
Scenario
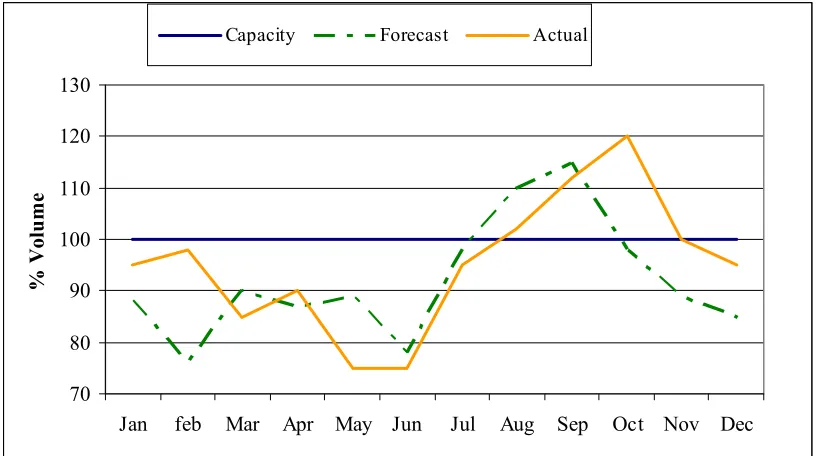
Following the trend in pharmaceutical marketing, companies are targeting specific customers, leading to the development of many new product configurations. These new product configurations have led to changes in packaging complexity including variation in components, packaging technique, packaging design, labeling and marketing features. From a packaging point of view, these new products are being introduced at a much faster rate. This increased product mix requires the packaging facility to be more responsive by handling smaller orders at more frequent intervals. Smaller orders at more frequent intervals will lead to more frequent changeovers between production runs on certain lines.
compliance with contract obligations. Figure 2 depicts the alternatives to meeting capacity requirements that the company has before it. The company sites outside the USA are comprised of slow manual lines that mass produce products at low costs. The tax benefits in other countries provide the cost advantage for operating on slower manual lines. Thus to be able to compete in this environment a packaging facility in the U. S. needs to produce packages at lower costs.
70 80 90 100 110 120 130
Jan feb Mar Apr May Jun Jul Aug Sep Oct Nov Dec
% V
ol
u
m
e
Capacity Forecast Actual
Figure 1 - Variation in Packaging Demand Forecasts and Actual Volumes
Figure 2- Alternatives in Meeting Packaging Requirements
3.2 Proposed
Solution
The impact of such changing competitive conditions on the packaging site has been gradual but by early 2003 serious problems could be observed. Packaging volumes were increasing as were the variations in package type. Faced with increasing packaging volumes and a desire to increase capacity, reduce unit packaging cost and increase the flexibility to meet changing requirements for packaging, the company began evaluating actions it could take to address these issues. Although the company was eager to tackle the problem of insufficient capacity, it was reluctant to invest in more machines to provide an immediate increase in the production capacity. Large capital investment in new equipment appeared risky at a point when the competitive environment was becoming more uncertain. Thus, a solution was sought that would add capacity without having to make a substantial capital investment. In an effort to find an acceptable solution, an evaluation of the plant performance parameters was conducted. In considering opportunities for
External Suppliers
External Suppliers
-- Semi-automated Equipment -- Slower Lines
-- Lower Overhead Costs -- Minimum Volume Contracts -- Regular audits
--Not very reliable -- LOW COSTS
Contract Packaging Company 2 Contract Packaging Company 1
PACKAGING FACILITY (US) *
Internal Suppliers (US)
-- Highly automated Equip. -- High Speed Lines -- Very reliable & flexible -- High quality standards -- High Overhead Costs -- HIGHER COSTS
PACKAGING FACILITY (outside US)
Internal Suppliers (outside US)
-- Manual lines -- Slow Speed Lines -- High quality standards -- High Overhead Costs -- Tax benefits MANUFACTURING
DIVISION PLANNING
improvement in the packaging facility process map as shown in Figure 3, it was observed that the packaging lines were not being utilized to their complete potential.
Figure 3- Packaging Operation Process Map
Further investigations suggested as shown in Figure 4, that the packaging facility operated productively less than 50 percent of the time. The packaging lines were producing at this level because of excessive planned and unplanned downtime.
RunTime 49% Planned Downtime
(PDT) 30%
Unplanned Downtime (UPDT)
21%
Figure 4- Evaluation of Line Productivity
Unplanned downtime entails unscheduled stoppages during production in the form of breakdown and repair, adjustment delays, minor stoppages, waiting on equipment or stoppages due to uncertain events like injuries. Planned downtime consists of planned breaks and lunches,
Warehouse – Finished Product Packaging
Lines Delivery
Warehouse – Raw Materials
Planning
Maintenanc Engineering
Quality Manufactured
3.3 Lean Manufacturing Approach to Resolve the Problem
Lean manufacturing tools can be employed at the packaging facility to reduce the incurred downtime. It was observed that unplanned downtime in the form of equipment breakdowns can be reduced by implementing a Total Productive Maintenance (TPM) program. TPM aims to improve the equipment effectiveness by eliminating equipment downtime and reducing defects. A TPM program concentrates on improving equipment availability thereby reducing waiting times.
43% 29%
8% 5%
15%
0% 5% 10% 15% 20% 25% 30% 35% 40% 45%
Cleanup & Changeover Breaks & Lunches Meetings Training Support Functions
Figure 5- Evaluation of Planned Downtime
A further evaluation of the planned downtime as shown in Figure 5 indicated that more than 70 percent of planned time was involved with breaks, lunches and cleanup and changeover. Breaks and lunches were taken by all packaging personnel at the same time. Staggering breaks and lunches resulted in dramatically reducing their impact from 29 percent to 12 percent of planned downtime. Further reduction of planned downtime can be achieved by focusing on the reduction of changeover time in pharmaceutical packaging. Reducing changeover or set-up times is a common approach to gain uptime in lean production applications. Application of single minute exchange of dies (SMED) methodology (Shingo, 1985) to reduce setup time has been a well known technique in the manufacturing industry.
Chapter 4
PROCESS DESCRIPTION
4.1 Pharmaceutical Changeover
Changeover is the process used to prepare the line to run the next product after completing a packaging run. Like setup times in other manufacturing operations, it is defined as the time between the last good product produced in the previous production run and the first good product produced at the start of the next production operation.
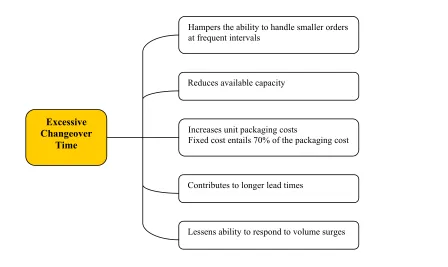
Excessive changeover times affect the plant performance in several ways as shown in Figure 5. For example, it was estimated that a 50 percent reduction in time taken to perform a changeover would result in an increase of 10 percent overall capacity of the packaging line. Changeover in pharmaceutical packaging operations possesses unique characteristics when compared with the general manufacturing setup or changeover process.
The two most important characteristics are:
Figure 6– Disadvantages Due to Excessive Changeover Time
4.2 FDA’s Impact on the Changeover Process
In most industries, manufacturers are constantly working with their production lines to improve their effectiveness. Due to the perception of stringent FDA regulations, there is little motivation to introduce changes to improve the efficiency of pharmaceutical processes. As part of the drug approval process, a company's detailed manufacturing plan and even the factory itself must gain FDA approval. After approval, even a small change in how a drug is made requires another round of FDA reviews and authorizations, requiring time and effort on the part of the company. The process discourages updating by the companies, who worry they will face a production delay that could cost them heavily. A similar pattern is seen in pharmaceutical packaging operations.
Every pharmaceutical site is made to follow a set of “Code of Federal Regulations” governed by
Excessive Changeover
Time
Hampers the ability to handle smaller orders at frequent intervals
Reduces available capacity
Increases unit packaging costs
Fixed cost entails 70% of the packaging cost
manufacture, processing, and packaging of a drug. These methods ensure that the drug meets the safety requirements, and has the identity and strength which meets the quality and purity characteristics that it is supposed to possess. The FDA requires that a quality control unit be established in each facility. This unit has the authority to approve or reject all components, drug product containers, closures, in-process materials, packaging material, labeling, and drug products. It also has the authority to review production records to assure that no errors have occurred or, if errors have occurred, that they have been fully investigated.
The following section is quoted from 21CFR Part 210/211 – Current Good Manufacturing Practice (2001): Section § 211.22- Responsibilities of quality control unit. (21CFR Part 210/211) “The quality control unit is responsible for approving or rejecting all procedures or specifications impacting the identity, strength, quality, and purity of the drug product. The responsibilities and procedures applicable to the quality control unit must be in writing; such written procedures shall be followed. Standard Operating Procedures (SOP) for processes that can impact the drug product are controlled by the quality control unit.”
Unlike other industries, the quality control unit’s responsibilities extend beyond monitoring product quality to controlling the quality of the packaging processes. Changeover standard operating procedures (SOP) are developed by operations and quality control under FDA guidelines and company regulations. The SOP’s developed are based largely on the interpretation of the FDA guidelines listed in 21 CFR Parts 210 and 211. Interpretations of FDA regulations are more subjective than objective and are largely dependent upon the quality personnel’s evaluation and experience. These interpretations change with the quality personnel changing and are often inconsistent.
similar event does not occur on other lines. The accumulation of these corrective measures over a period of years has created an inflated process during which many redundant tasks are performed. Changes made to the process need quality approval and have to be reflected in the standard operating procedures before being implemented. Thus any change in the process demands effective communication with the quality control unit and corresponding paper work. The quality control unit thus has a firm hold over packaging processes. The redundant activities are not challenged to avoid confrontation with the quality department. Often, checks are added during the changeover to complement supporting systems in the plant. The systems requiring the checks keep changing but corresponding activities performed in the changeover remain. The process ends up being designed around these additional activities. Often, a stage is reached when operators do not know why certain tasks are performed. They do it that way because it has always been done that way.
4.3 Cleanup - Major Part of the Changeover
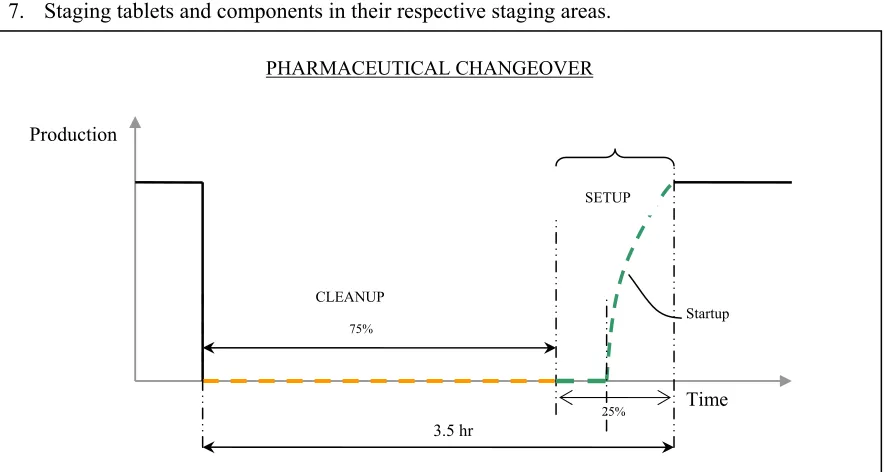
An evaluation of the changeover process indicated that cleanup operations between packaging runs mandated for maintaining quality and product integrity comprise as much as 75 percent of the time required to perform the changeover. Thus one of the unusual characteristics of a changeover in a pharmaceutical packaging is the fact that cleanup takes significantly more time than the actual setup. Based upon the dominant role of cleanup in pharmaceutical changeover activities, these cleanup activities were targeted to determine ways to reduce the time taken to complete them.
down” the packaging area between production runs on different pharmaceutical products, even those of the same product but differing strength or delivery mechanism – i.e. tablet, caplet, gel cap, or liquid. Furthermore, all packaging materials and remnants of the pharmaceutical products from the previous packaging run must be identified, counted and removed from the packaging area.
The following section is quoted from 21CFR Part 210/211 – Current Good Manufacturing Practice (2003): Section § 211.67 - Equipment Cleaning and maintenance
“Equipment and utensils shall be cleaned, maintained, and sanitized at appropriate intervals to prevent malfunctions or contamination that would alter the safety, identity, strength, quality, or purity of the drug product beyond the official or other established requirements.
Written procedures shall be established and followed for cleaning and maintenance of equipment, including utensils, used in the manufacture, processing, packing, or holding of a drug product. These procedures shall include, but are not necessarily limited to, the following:
1. Assignment of responsibility for cleaning and maintaining equipment;
2. Maintenance and cleaning schedules, including, where appropriate, sanitizing schedules; and description in sufficient detail of the methods, equipment, and materials used in cleaning and maintenance operations, and the methods of disassembling and reassembling equipment as necessary to assure proper cleaning and maintenance;
3. Removal or obliteration of previous batch identification; 4. Protection of clean equipment from contamination prior to use; 5. Inspection of equipment for cleanliness immediately before use.”
It was recognized that the activities performed during the changeover can be classified into two categories. i.e. cleanup and setup. As shown in Figure 7, it was identified that cleanup comprises 75 percent of the activities performed during the changeover.
Cleanup activities included:
Startup
25%
Production
Time
75%
CLEANUP
PHARMACEUTICAL CHANGEOVER
3.5 hr
SETUP 2. Removing the remaining tablets from the line,
3. Clearing printed material related to the current batch (rejects, trash) from the line,
4. Cleaning (Wipe/ Vacuum/ Blow) the equipment, fill room and backend area to ensure there are no tablets or printed material remaining on the equipment,
5. Performing calculations to account for blister and tablet rejects, 6. Removing batch information from printers, and
7. Staging tablets and components in their respective staging areas.
Figure 7– Pharmaceutical Changeover
Setup which forms a smaller part of the changeover includes: 1. Changing equipment on the line,
2. Aligning the print mat with the lid foil,
3. Setting up the printer to print on blister cards/cartons/packers, 4. Preparing and performing sampling tests,
Chapter 5
METHODOLOGY to REDESIGN THE
CHANGEOVER PROCESS
5.1 Methodology
Pharmaceutical manufacturers intending to implement lean production must have the ability to be responsive and flexible to produce small batches to meet constantly changing customer requirements. The option of set-up reduction to gain uptime to create additional capacity complements the concept of lean manufacturing that focuses on creating a flexible manufacturing environment. Smaller setup times can produce many benefits such as additional uptime, lower inventory costs, improved quality, increased equipment utilization, and faster production turnaround.
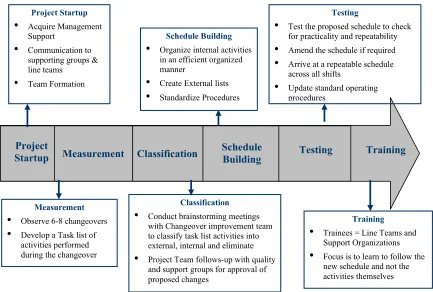
The setup reduction process as applied in this investigation was composed of six phases as shown in Figure 8. The process was designed to identify and assist production associates to reduce the non-value added activities performed during the changeover. The activities performed during the changeover were observed and measured to establish an actual baseline. Every task in the changeover process was challenged in a brainstorming and task evaluation activity to identify activities into the following categories:
2. Necessary activities that can be performed external to the changeover process, either before or after the changeover while the line is running, and
3. Redundant and unnecessary activities that could be eliminated altogether.
As the activities were subdivided into these three categories, each process change was discussed with the quality team to ensure that the change would not impact quality in a negative way. Standardized activity schedules were developed to train production associates so that the new method would be followed by personnel on all shifts. Tests were conducted to investigate the schedule and to ensure a standardized, achievable process was developed.
Figure 8- Setup Reduction Process
Training Project
Startup Measurement Schedule Building Testing
Classification
•
Conduct brainstorming meetings with Changeover improvement team to classify task list activities into external, internal and eliminate•
Project Team follows-up with qualityand support groups for approval of proposed changes
Schedule Building
•
Organize internal activitiesin an efficient organized manner
•
Create External lists•
Standardize ProceduresTesting
•
Test the proposed schedule to check for practicality and repeatability•
Amend the schedule if required•
Arrive at a repeatable scheduleacross all shifts
•
Update standard operating proceduresTraining
•
Trainees = Line Teams and Support Organizations•
Focus is to learn to follow thenew schedule and not the activities themselves
Classification
Project Startup
•
Acquire Management Support•
Communication to supporting groups & line teams•
Team FormationMeasurement
•
Observe 6-8 changeovers•
Develop a Task list of5.2 Project
Startup
A study by Moxham and Greatbanks (2001) suggests that there are a number of prerequisites that need to be in place prior to the setup reduction implementation. The tasks performed prior to implementation would differ for different industries and would also vary according to the plant or factory culture. For example, the packaging facility where the process was implemented has a strong employee involvement and empowerment initiative. According to Forcinio (2001), projects like setup reduction require a cultural focus and commitment from the organization’s key players, beginning with senior management and extending through to other departments like purchasing, packaging, marketing, engineering and quality control and validation.
In order to facilitate and implement a setup reduction project, there must be a strong level of management attention and support. The project challenges current business practices which may require the management personnel to change their current way of thinking. Management must be ready to take acceptable risks and change systems that have been in place for many years. Resources required include operators and mechanics and may require the line to be shutdown to conduct meetings. This demands a strong commitment from management because the area of focus is already operating in a capacity constrained environment. The management personnel need to realize that the setup reduction process is not a quick fix and it will take time before positive results are observed on the shop floor. To achieve success, management, operators, quality groups, and other support functions must be prepared to challenge and change their habits. Training sessions have to be conducted to communicate the following:
1. The need for redesigning the changeover process,
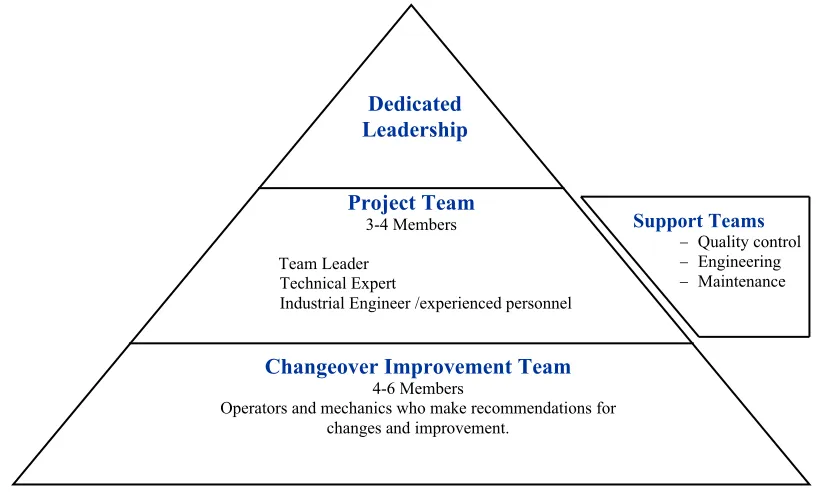
Cooperation on behalf of the support groups is an important aspect for the smooth progress of the project. An organized team structure as shown in Figure 9 is required to manage the setup reduction process.
Figure 9- Team Structure
A project team consisting of the in-house stakeholders for the overall project was responsible for the facilitation of the six phases of the redesign process. The project team was comprised of a team leader, an industrial engineer and a line supervisor who had comprehensive knowledge about the line. The project team gathered the changeover data and organized it for analysis. The project team then conducted brainstorming meetings with a changeover improvement team on a weekly basis to analyze the data collected and classified the data into:
1. Internal activities which are critical activities required to be performed while the line is down, 2. External activities which are necessary activities that can be performed before or after the
changeover while the line is running, and
Project Team
3-4 Members
Team Leader Technical Expert
Industrial Engineer /experienced personnel
Changeover Improvement Team
4-6 Members
Operators and mechanics who make recommendations for changes and improvement.
Support Teams
− Quality control
− Engineering
− Maintenance
provided the technical support during meetings which was helpful in equipment related discussions.
5.3 Measurement
phase
The purpose of the measurement phase was to observe the tasks performed during the changeover and measure the time taken to complete these activities. This phase helped establish a baseline of activities performed during the changeover.
5.3.1 Introduction to Measurement
Prior to the measurement the line team was introduced to the setup reduction process. The project team held training sessions to acquaint the line team about their involvement in the process. Benefits from the improvement process and the need for additional line productivity were addressed during these sessions. It was important to help them to realize that the developed changeover process would help them perform their activities in a more efficient manner. Insecurities about their jobs needed to be addressed in a positive and honest manner. It was made clear that the focus of the measurement was on WHAT was being done and NOT ON HOW it was
being done. Developing trusting relationships with operators was critical for gaining their active participation in the improvement process. The project team reviewed the line with a member of the line team before starting measurement. This assisted the project team in learning the line terminology which helped to facilitate the classification phase since it ensured that everyone talked about the same piece of equipment during meetings.
5.3.2 Measurement
personnel, mechanics, and line supervisors) in the changeover process. Measurements were carried out over all shifts to collect a reliable set of activities. After measurements the average times and standard deviation were calculated to analyze the reliability of the process. It was necessary to ensure that the operators were comfortable when the process was being recorded. As a best practice, operators in the changeover improvement team should participate in the measurement phase themselves. This will help the operators to recognize the redundant activities and best practices implemented by co-workers during the changeover. This results in more operator participation encourages them to come up with optimization ideas.
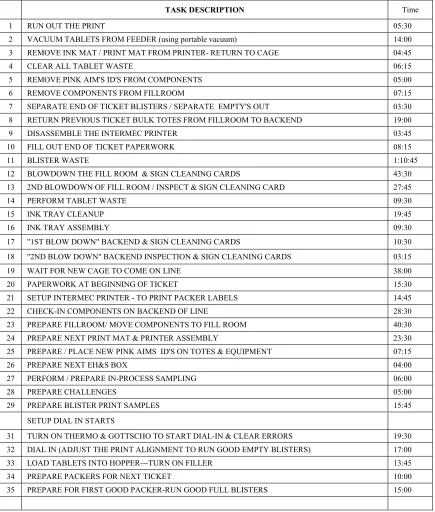
5.3.3 Task List Preparation
TASK DESCRIPTION Time
1 RUN OUT THE PRINT 05:30
2 VACUUM TABLETS FROM FEEDER (using portable vacuum) 14:00 3 REMOVE INK MAT / PRINT MAT FROM PRINTER- RETURN TO CAGE 04:45
4 CLEAR ALL TABLET WASTE 06:15
5 REMOVE PINK AIM'S ID'S FROM COMPONENTS 05:00
6 REMOVE COMPONENTS FROM FILLROOM 07:15
7 SEPARATE END OF TICKET BLISTERS / SEPARATE EMPTY'S OUT 03:30 8 RETURN PREVIOUS TICKET BULK TOTES FROM FILLROOM TO BACKEND 19:00
9 DISASSEMBLE THE INTERMEC PRINTER 03:45
10 FILL OUT END OF TICKET PAPERWORK 08:15
11 BLISTER WASTE 1:10:45
12 BLOWDOWN THE FILL ROOM & SIGN CLEANING CARDS 43:30 13 2ND BLOWDOWN OF FILL ROOM / INSPECT & SIGN CLEANING CARD 27:45
14 PERFORM TABLET WASTE 09:30
15 INK TRAY CLEANUP 19:45
16 INK TRAY ASSEMBLY 09:30
17 "1ST BLOW DOWN" BACKEND & SIGN CLEANING CARDS 10:30
18 "2ND BLOW DOWN" BACKEND INSPECTION & SIGN CLEANING CARDS 03:15
19 WAIT FOR NEW CAGE TO COME ON LINE 38:00
20 PAPERWORK AT BEGINNING OF TICKET 15:30
21 SETUP INTERMEC PRINTER - TO PRINT PACKER LABELS 14:45 22 CHECK-IN COMPONENTS ON BACKEND OF LINE 28:30 23 PREPARE FILLROOM/ MOVE COMPONENTS TO FILL ROOM 40:30 24 PREPARE NEXT PRINT MAT & PRINTER ASSEMBLY 23:30 25 PREPARE / PLACE NEW PINK AIMS ID'S ON TOTES & EQUIPMENT 07:15
26 PREPARE NEXT EH&S BOX 04:00
27 PERFORM / PREPARE IN-PROCESS SAMPLING 06:00
28 PREPARE CHALLENGES 05:00
29 PREPARE BLISTER PRINT SAMPLES 15:45
SETUP DIAL IN STARTS
31 TURN ON THERMO & GOTTSCHO TO START DIAL-IN & CLEAR ERRORS 19:30 32 DIAL IN (ADJUST THE PRINT ALIGNMENT TO RUN GOOD EMPTY BLISTERS) 17:00 33 LOAD TABLETS INTO HOPPER---TURN ON FILLER 13:45
34 PREPARE PACKERS FOR NEXT TICKET 10:00
35 PREPARE FOR FIRST GOOD PACKER-RUN GOOD FULL BLISTERS 15:00
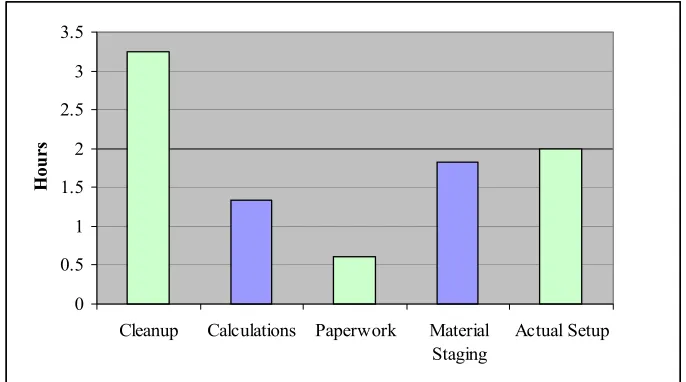
5.3.4
Assessment
After preparation of the Task list, the tasks were further categorized to study the activities performed with regard to the source and nature of the activity. The activities were categorized by the nature of their function i.e. cleanup, calculations, paperwork, material handling, and actual setup. The results are as shown in Figure 10. It was observed that the majority of the time was consumed in cleaning the line while actual setup activities comprised just 25 percent of the activities.
0 0.5 1 1.5 2 2.5 3 3.5
Cleanup Calculations Paperwork Material
Staging
Actual Setup
Hou
rs
Figure 10- Classification by Nature of Activity
5.4 Classification
phase
During the classification phase, the changeover improvement team consisting of operators and mechanics met with the project team on a weekly basis to review the activities that were recorded in the task lists. In the observed changeover 400 activities were performed by three operators in 3.5 hours. Every task in the changeover process was challenged in a brainstorming and task evaluation activity to categorize them into one of the following categories:
1. Internal activities are those critical activities which are required to be completed during the changeover and require the line to be shut down.
2. External activities are necessary activities that can be performed external to the changeover process i.e. either before or after the changeover, while the line is running,
3. Eliminated activities are identified redundant activities that could be eliminated altogether. This includes activities where small changes can be made to eliminate a step.
Each activity was audited to understand why it was done, who should perform it, and when it should be performed. The six questions of Kipling as shown in Table 2 were used as a guide to help identify whether an activity should be performed externally, internally, or should be eliminated.
Primary Questions Secondary Questions Decision
What is the goal of this activity? Why is it needed? Operators cannot answer >> Eliminate Where will it be performed?
When will it be performed? Who will do it?
Why is it performed there? Why does it happen then? Why does this person do it?
If the operators agree these things can be reorganized >> Externalize
How will it be done? Why do we do it this way? If Operator can provide answers >> Internalize
The role of the changeover improvement team was to brainstorm about the current process and propose new ideas for improvements. The operators were asked to think beyond their current methods to come up with innovative improvement ideas for the process. The project team was responsible for working in collaboration with support groups to determine how these new ideas could be implemented. This process was an operator based approach that required their active participation and input.
Table 3– Application of the Task list During the Classification Meetings
Facilitating the classification phase was a challenging task which required patience and active listening. Often, operators became uncomfortable with the changes that were being proposed. When certain tasks were placed in the eliminate category, they questioned the value those tasks had added to the organization over time. Their responses suggested that they performed these tasks on the basis that they had always been done that way. It took several meetings to change their traditional mind sets and push them to think beyond their current work habits.
After an idea was proposed, the project team would seek approval from quality, operations or required support groups. The proposed changes were investigated by the project team and discussed with the quality team. The changes included eliminating redundant steps or moving
TASK DESCRIPTION Time E L I E X T I N T REMARKS 1 RUN OUT THE PRINT
a. Turn Fill room line status indicator to RED 00:30 X Necessary as a visual aid for support groups
b. Turn off the Gottscho printer using the Pac controller 00:30 X Not required
c. Keep punching until all print is gone 02:30 X
d. Cut and pull of forming film from the thermoformer 00:30 X Not required
e. Clear blister waste in grey bin to trash 01:00 X
f. Clear Waste from scrap accumulation area 02:00 X Housekeeping
g. Turn off thermoformer 00:30 X Not required – Takes 5 mins to restart
h. Turn off Air supply 00:30 X Not required- Maintenance feedback required
i. Open Punch Station, pull punch station out , blow down 2:00 X Important- Critical area
2 VACUUM TABLETS FROM FEEDER (using portable vacuum)
a. Put on latex gloves 00:40 X
b. Remove remaining tablets from hopper, put in tote 00:40 X Run ticket will empty
5.5 Schedule
Building
After completing the classification phase, it was necessary to develop changeover standards to train production associates so that the new process would be executed in the same manner by personnel on all shifts. The primary purpose of the schedule building phase was to develop a standardized method for performing the changeover. This led to the development of activity schedules. The schedule reduced the changeover time by strategically organizing the internal activities among the changeover personnel. External tasks lists were designed to aid in performing external activities.
The first draft of the schedule was designed in a meeting with the changeover improvement team. The emphasis while designing the schedule was placed on the critical path. The critical path entails those internal tasks that have to be done in order for the line to be back up and producing product in the shortest possible time. The approach requires one operator to concentrate on the critical activities while the other two perform activities to support the critical path. The project team then analyzed the developed schedule and made changes to reduce waiting times. The changes in the schedule were shared in the changeover improvement team after which testing was done.
Table 4 - Sample Schedule
The external tasks were performed either prior-to or after the changeover by operators and line supervisors. Some external tasks needed to be performed at a certain time before or after the changeover by a specific resource. The successful execution of the external activities would ensure a planned reduction in changeover time. The external task lists enumerate the steps to be performed while the line is running. Two task lists were designed to assist operators to perform external activities before and after the changeover. A separate task list was created for the line supervisor to help perform activities at required times. The following task lists were designed:
− External list for activities performed by operators prior to the changeover.
− External list for activities performed by operators after the changeover.
− External list for tasks to be performed by the line supervisor at required times.
5.6 Testing
Phase
The primary purpose of the testing phase was to investigate the schedule and to ensure that a standardized, achievable process was developed. The testing phase was conducted to finalize the activity schedule. This phase helped the operators to get familiar with the new method for performing the changeover. The operators were given instructions to follow the guidelines provided by the project team. Members of the project team shadowed the operators and the line supervisor while they performed external and internal activities. The project team measured the times required to complete activities and checked the sequence to ensure the comfort level for the operators. Brief meetings were held after each test to provide operators with the opportunity to give feedback about the new process. Changes were made to the schedule as required during the testing phase. Testing was performed until a fairly repeatable schedule was achieved over all shifts.
5.7 Training
A training phase was completed next with the focus on creating a standard routine to be followed by all personnel on the line. The purpose was to ensure that the line teams perform activities as listed in the activity schedules and the external task lists. The focus was not on the time taken, since there was an expected learning curve for the operators. The training was focused on the understanding and coordination of the activities and the reduced time was a result of experience. The training phase allowed the operators to gradually move from their old method of working to adopting the new sequence while performing the changeover.
Startup
Production
65%
CLEANUP
REDESIGNED CHANGEOVER
SETUP
Chapter 6
RESULTS
6.1 Results
Achieved
The new activity schedules were tested and the line team was trained to execute the changeover using the new methodology.
It was observed that only 32 percent of the activities involved in the changeover process were required to be performed while the line was down. Redundant and unnecessary activities were eliminated while 37 percent of the changeover activities were categorized as external activities to be performed either before or after the changeover. The results of the classification phase are depicted in Figure 12.
Figure 12– Results of Changeover Improvement
Cleanup activities were reduced by more than 60 percent as shown in Figure13. Critical areas were identified on the line. Activities to clean these identified critical areas on the line were retained whereas unnecessary cleanup activities were eliminated. Housekeeping activities were added to the external tasks lists to reduce the line downtime. Furthermore, calculations and required paperwork were moved to the external task lists to be performed by operators and the line supervisor while the line was running. The setup activities were better organized and operators were trained to perform best practices to ensure a reliable and repeatable setup process.
124 activities-1.1 hr
•
redundantcomponent verification
•
batch Id’s on equipment•
waiting times148 activities-1.5 hr
•
blister & tablet waste•
print mat preparation•
housekeeping•
ink tray cleanup•
paperwork128 activities-0.9 hr
0 0.5 1 1.5 2 2.5 3 3.5
Cleanup Calculations Paperwork Material Staging Actual Setup
Ho
u
rs Before Improvement
After Improvement
Figure 13– Classification of Activities After Improvement
6.2 Expected
Benefits
Given that there are approximately 100 changeover processes performed per year, there is a total time savings of more than 200 hours per year. Thus, the available time on the line was increased by approximately 25 eight-hour shifts without adding any additional capital equipment to the facility. Given that there are 16 packaging line in this facility and applying a 70 percent success factor, an estimated increase of 3000 hours of packaging capacity can be achieved. This will translate into a significant increase in production capacity, cost savings, production flexibility and profit. The additional capacity will help the plant site handle the additional volume which in turn will result in higher turnover. The reduced changeover time will provide the needed flexibility which will enable the packaging facility to accept smaller more frequent batch orders.
The total cost of packaging a product is divided into 2 parts. i.e. Fixed and Variable. Packaging Costs = Fixed Cost + Variable Cost
Variable costs are costs which vary with the volume produced. Raw materials used in production are considered variable costs.
Variable Cost = material and component costs
Standard cost per package is calculated as the packaging costs divided by the volume produced. Standard cost per package = Packaging Cost
Volume
At the concerned packaging facility, fixed cost comprises 70 percent of the cost per package. Thus, the cost per package decreases with increase in packaging volume. The reduced cost will help the packaging facility to contend with lower costs offered by the other competitors. Thus adding capacity by means of changeover reduction helps the packaging facility to attract more volume at competitive prices with the needed flexibility.
Volume v/s Cost
0 0.05 0.1 0.15 0.2 0.25 0.3 0.35 0.4
0 100000 200000 300000 400000 500000 600000 700000
Volume C o st p e r p ackag e
Figure 14– Relationship between Volume and Cost Per Package
Chapter 7
CONCLUSION & FUTURE WORK
7.1 Conclusion
Lean production processes can certainly be applied productively in pharmaceutical packaging. The problems faced by the packaging facility were successfully addressed by the application of the setup reduction process. Capacity on one line was added without having to invest in new equipment and personnel on the lines. The additional capacity provided the needed flexibility and reduced the cost per package of products produced on that line. Given that there are 16 packaging line in this facility, a large amount of capacity can be added through implementation of setup reduction processes on all lines. This will translate into significant increase in production capacity, cost savings, production flexibility and profit. The additional capacity will help the facility handle the additional volume and enable the packaging facility to accept smaller more frequent batch orders.
Regularly, required tasks need to be reviewed to see if they are still relevant and needed. Furthermore, applying lean production tools like setup reduction can greatly reduce the number of tasks performed during planned downtime.
It was observed that it is important to be able to sustain an improvement made to a process. The potential problem is that the operators have the tendency to drift back to the traditional way of working as shown in Figure 13. Evaluations and audits have to be conducted to control these processes and prevent them from going back to the way they were done until the new process becomes a habit. It is a continuous improvement process which requires monitoring to ensure that planned results are obtained. An organizational structure must be in place to track any deviations in the process to ensure all groups are performing their part in the process.
Figure 15– Importance of Process Controls
Leadership at every level is critical to the success of a lean production program. The program challenges and seeks to change many production processes that are intertwined with traditional practices. This requires strong leadership and understanding from senior management. This leadership needs to be shared at every level in the entire operation. All quality functions within the organization must be committed to the project and be open to questioning every task for a project like his one to succeed. This project serves as the beginning of a cultural change of what is possible not only in packaging but also in other pharmaceutical manufacturing operations.
Improvements
Period of time
7.2 Future
Work
This investigation reduces the changeover time by mainly reducing the time required to perform cleanup activities. As seen in Figure 10, setup comprises 42 percent of the activities performed in the redesigned changeover. The setup activities did not utilize a majority of the original changeover time and hence were not the major focus of this study. Setup activities were organized better while operators were trained to perform these activities in a standard manner. However, it was observed that while performing the changeover using the new method, the time required to perform setup was variable and often the cause of the changeover time being more than expected. As a potential opportunity, an investigation needs to be focused on developing a more reliable setup process. Adjustment pointers can be standardized and operators can be trained to trouble shoot during breakdowns.
The improvement on the packaging lines has had a big impact on the way other departments performed their functions. As shown in Figure 16, the packaging lines are one part of the plant supply chain.
Figure 16 – Packaging Supply Chain
The supporting departments particularly the warehouse and planning department, were finding it Warehouse
Finished Product Packaging
Lines Delivery
Warehouse Raw materials
Planning
Maintenanc Engineering
Quality Manufactured
changeovers now had to schedule times and work during breaks or meetings to complete their tasks. The packaging lines were no longer the constraint in the supply chain and the supporting groups had to make extra efforts to maintain the smooth flow of products. The focus was now moved to making the warehouse and planning operations more efficient. Effective pull systems can be implemented in the warehouse to create a well-organized material transfer system. This would enable the lines to receive products as planned in a repeatable manner.
Bibliography
Abboud, L., Hensley, S., 2003, Factory Shift: New Prescription for Drug Makers: Update the Plants; After Years of Neglect, Industry Focuses on Manufacturing; FDA Acts as a Catalyst; The Three-Story Blender, Wall Street Journal, New York, NY: p A1
Anonymous, 2002, Pharmaceutical packaging demands increasing, Official Board Markets, Vol.78, Iss.20, p10
Food and Drug Administration, 2001, Code of Federal Regulations – Part 210 & 210 and Part 11,
Current Good Manufacturing Practice
Forcinio, H., 2001, Tricks of the change, Pharmaceutical Technology, Vol.25, Iss.5, p26
Gilmore, M., Smith, D.J., 1996, Set-up reduction in pharmaceutical manufacturing: an action research study, International Journal of Operations & Production Management, Vol.16, Iss.3, p4
Haystead, J. S., 2003, Manufacturing a future, Pharmaceutical Technology, Vol.27, Iss.7, p106
Leschke, J. P., 1997, The setup reduction process: Part 1. Production and Inventory Control Management Control, 38, 32-37
McIntosh, R. I., Culley, S. J.,Gest, G., Mileham, A. R., Owen, G.W., 1996, An assessment of the role of design in the improvement of changeover performance, International Journal of Operations & Production Management, Vol.16, Iss.9, p15
Moxham, C., Greatbanks, R., 2001, Prerequisites for the implementation of the SMED methodology: A study in a textile processing environment, The International Journal of Quality & Reliability Management, Vol.18, Iss. 4/5, p404
Shingo, S., 1985, A Revolution in Manufacturing: The SMED System. Cambridge, MA: Productivity Press
Thompson, D., Mintz, P., 1999, Lean manufacturing. [http://www.citec.org /lean_ manufacturing. html]. Business Journal, 15 December
Todd, P., 2000, Lean manufacturing: Building the lean machine, Advanced Manufacturing
Womack, J. P., Jones, D. T., 1996, Lean Thinking. NewYork, NY: Simon & Schuster
Appendix A: Measurement Form
Recorder
:
Shift:
Operator:
Date:
Line:
Task Description
Time