Copyright2000 by the Genetics Society of America
Is the Genotype-Phenotype Map Modular?: A Statistical Approach
Using Mouse Quantitative Trait Loci Data
Jason G. Mezey,*
,1James M. Cheverud
†and Gu
¨nter P. Wagner*
*Department of Ecology and Evolutionary Biology, Center for Computational Ecology, Yale University, New Haven, Connecticut 06520-8106 and†Department of Anatomy and Neurobiology, Washington University School of Medicine, St. Louis, Missouri 63110
Manuscript received November 5, 1999 Accepted for publication May 24, 2000
ABSTRACT
Various theories about the evolution of complex characters make predictions about the statistical distribution of genetic effects on phenotypic characters, also called the genotype-phenotype map. With the advent of QTL technology, data about these distributions are becoming available. In this article, we propose simple tests for the prediction that functionally integrated characters have a modular genotype-phenotype map. The test is applied to QTL data on the mouse mandible. The results provide statistical support for the notion that the ascending ramus region of the mandible is modularized. A data set comprising the effects of QTL on a more extensive portion of the phenotype is required to determine if the alveolar region of the mandible is also modularized.
I
T has been hypothesized that characters that collec- 12–20) of the mandible. Furthermore, most QTL with effects on more than two traits had effects significantly tively serve a common functional role should begenetically integrated and relatively independent from focused on either the ascending ramus (50%) or the alveolar region (27%). These results were interpreted the rest of the body (OlsonandMiller 1958;Riedl
1978; Cheverud 1982; Bonner 1988; Wagner and as consistent with the theory that selection tends to produce modular structure in functionally distinct units.
Altenberg1996). The genetic organization of a
com-plex of characters thus is expected to reflect functional However, without analyzing these findings in a statistical framework for all the loci simultaneously, it is difficult relationships. This is also called the hypothesis of the
“imitatory epigenotype” because it is predicted that the to determine whether 27 and 50% of QTL biased to the ascending ramus or the alveolar region are significantly pattern of developmental constraints “imitates” the
pat-tern of functional constraints (Riedl1978). Closely as- different than expected under a random model. In this study we propose an additional method for sociated with the hypothesis of an imitatory epigenotype
is the concept of a module (Raff 1996;Wagner and assessing the modularity of a portion of the phenotype
Altenberg 1996). A module is defined as a complex using QTL data. We suggest two statistics that measure of phenotypic traits that is both tightly integrated by the two aspects of modularity: integration by pleiotropic pleiotropic effects and relatively independent of the rest effects and parcelation,i.e., fewer than expected pleio-of the phenotype (Wagner1996). So defined, a module tropic couplings with the rest of the phenotype (
Wag-is recognized by the statWag-istical dWag-istribution of mutation nerandAltenberg1996). These statistics are used to effects among phenotypic traits. The imitatory epigeno- test whether units of the phenotype are more modular type hypothesis thus predicts that functional units of than expected by chance. In this article, we apply the the phenotype should be genetically modular. test to the same QTL reported inCheverudet al.(1997) The study of Cheverud et al. (1997) addresses the and find that the ascending ramus is more modular issue of modularity with a study of the mouse mandible than expected by chance.
(Figure 1). A quantitative trait locus (QTL) study was performed to determine the effects of alleles at
individ-ual loci. For the QTL with more than two effects (21 THE UTILITY OF QTL DATA FOR EXPLORING THE GENOTYPE-PHENOTYPE MAP
in total), the authors determined that only a minority
of 23% had effects on both the ascending ramus (traits Hypotheses about the structure of the genotype-phe-1–11 and 21) and the alveolar region (traits 10 and notype map are statements about the statistical distribu-tion of mutadistribu-tion effects among phenotypic traits. Ide-ally, data to test these hypotheses should directly sample
Corresponding author:Gu¨ nter P. Wagner, Department of Ecology the distribution of the effects of individual mutations.
and Evolutionary Biology, Yale University, POB 208106, New Haven,
Data on the distribution of individual mutation effects,
CT 06520-8106. E-mail: [email protected]
however, is difficult to produce. QTL data provide a
1Present address: Department of Biological Science, Florida State
University, Tallahassee, FL 32306. reasonable alternative for testing ideas about the
manner are interpreted as being closely linked to loci with an effect on the given traits. Assuming a proper density of molecular markers along the chromosomes, the marker locus technique allows identification of a large number of QTL that may be located anywhere in the genome. The technique may be used to identify the set of genes causing heritable differences between lines and the individual pleiotropic effects of each gene (Cheverudet al.1997).
The marker locus technique identifies loci where dif-ferent alleles have become fixed in divergent lines. Whether a particular allele becomes fixed in a line de-pends on two probabilities: (1) the probability that a mutation with this effect will occur, and (2) the probabil-ity of fixation given that the mutation has occurred. The first probability is relevant for estimating the distri-bution of mutation effects. It is this statistical distribu-tion that is predicted to be modular. The second proba-bility is determined by the history of drift and selection effects in the study populations. Of the mutations that were segregating in the original base population and the mutations that occurred during selection, some are more likely to be fixed than others. For example, if a
Figure1.—Diagram of the mouse mandible. (A) Division line used in a QTL study is produced by selecting for
demarcates the ascending ramus and alveolar region. (B) larger character values, mutations with large positive Traits used in the QTL study on the mouse mandible of
Chev-effects on the character are more likely to be fixed. The
erudet al.(1997): (1) coronoid height; (2) superior condylar
result is that marker locus QTL data are a “filtered”
length; (3) condylar width; (4) inferior condylar length; (5)
sample of the mutational distribution.
condylar base length; (6) posterior angular height; (7)
poste-rior angular length; (8) anteposte-rior angular length; (9) supeposte-rior For the purposes of this study, we are interested in
angular length; (10) posterior corpus length; (11) coronoid marker locus studies where multiple traits were mea-base length; (12) posterior-inferior basal length; (13) anterior- sured and a large number of QTL were identified. In inferior basal length; (14) inferior incisor alveolus length;
this study, we reanalyze the data set ofCheverudet al.
(15) incisor alveolus width; (16) superior incisor alveolus
(1997) that identified QTL with effects on the mouse
length; (17) anterior corpus height; (18) molar alveolus
height; (19) superior molar alveolus length; (20) inferior mo- mandible. The inbred lines used in this study were
pro-lar alveolus length; (21) superior coronoid length. duced from lines selected for large and small body
weight, respectively. Hence, the lines were selected for alleles with large overall effect on body size. As ex-ture of the genotype-phenotype map. One limitation plained below, we therefore think that this data set is when using QTL data, however, is that it reflects both biased against the modularity hypothesis and we con-the distribution of individual mutation effects as well as sider the test results reported here as conservative. the fixation probabilities of the alleles. In this section,
we discuss some of the problems of utilizing QTL data
STATISTICS FOR MODULARITY
to analyze the structure of the genotype-phenotype map.
QTL are defined as genes influencing quantative Modularity of a set of traits can be defined by two traits (Liu 1998). Although identification of QTL has attributes (WagnerandAltenberg1996): (1) a higher a long history (Sturtevant 1913;Sax1923;Penrose than average level of integration by pleiotropic effects 1935), only relatively recently, with advances in molecu- of genes among the traits of a set, and (2) a higher than lar marker technology, have “marker locus” QTL studies average level of independence from other trait sets. The become possible at a larger scale (Lander and Bot- first of these conditions reflects the degree of
integra-stein1989;KnottandHaley1992;Zeng1993;Rout- tion within a module and the second reflects the degree
manandCheverud1994). There exists some variation of parcelation of the phenotype into distinct units. We with respect to marker locus methodology, but a com- assess the modularity of a set of traitsT1that is a proper
mon strategy is to produce a F2or backcross population subset of the total number of traits observed T1 傺 T.
from two divergent homozygous lines and identify ge- Ideally, the number of traits in the subset is much netic markers associated with quantitative trait variation smaller than the total set of observables. We define [seeLynchandWalsh(1998) for a review of protocols two statistics for assessing the modularity ofT1, one to
parcelation between trait sets. We call the total number of QTL that have effects on at least two traitsn.Of these
nQTL, we callmthe number of QTL that affect at least one trait inT1,m⬍n.Note that we only consider QTL
with effects on at least two traits inTwhen calculating these statistics.
Integration statistic: To measure integration of the setT1consisting ofktraits, we consider only themQTL
with an effect on at least one trait in the set T1. The
integration statisticMIis based on the total number of
traits in T1 affected by the m QTL compared to the
maximum number of traits these QTL could affect in
T1, which iskm:
MI⫽
兺
m
j⫽1(no. traits inT1affected by QTL j)⫺m
m(k⫺1) .
The statistic is scaled to the unit interval [0, 1]. The extreme valuesMI ⫽1 and MI⫽ 0 correspond to the
maximum and minimum amounts of integration of the traits inT1. For example, the most completely integrated
case would be one where allmQTL with at least one effect onT1 have effects on all ktraits in T1 such that
the total number of effects iskm.This corresponds to
MI⫽ 1 (Figure 2A). At the other extreme, each QTL
with at least one effect onT1affects only a single trait.
In this case, each trait inT1changes independently as a
result of an allele substitution. This corresponds to the lowest possible amount of integration such thatMI⫽ 0
(Figure 2A).
Parcelation statistic: For measuring parcelation, we consider allnQTL in the sample with effects on more than one trait. Parcelation is defined as a relative lack of pleiotropic effects between two sets of traits.
Parcela-Figure2.—Examples for an intuitive understanding of the
tion is thus a relation between any two nonoverlapping
statisticsMIandMP.T1andT2are two sets of traits (containing
sets of traitsT1 andT2. These two sets can be a subset
two traits each,k⫽2). An arrow indicates an effect of a QTL
T1 of all traitsTand its complement,i.e., all the traits on a traitt
j.(A) An illustration of the integration statisticMI:
inTthat are not inT1. Pearson’s2is used to compare the two QTL with at least one effect on traits inT1have effects
the observed number of traits affected by each QTL in on both traits ofT1. This is the maximally integrated case,
henceM1(T1)⫽((2⫹2)⫺2)/2(2⫺1)⫽1. Each QTL with
T1andT2to the expected number based on the marginal
an effect onT2has an effect on one inT2. The value of the
distribution of effects among all QTL and traits. For
integration statistic is therefore zero:MI(T2)⫽(1⫹1⫹1⫺
each QTLj, the observed number of traits affected in
3)/(2⫺1)3⫽0. (B and C) Illustrations of the parcelation
T1andT2is symbolized byOj1andOj2, and the expected statisticM
P: (B) For all the QTL in this sample, the expected
number of traits affected is calculated asEj1⫽p1Sjand number of effects is 1(Eji⫽pT
iSj⫽2⫻0.5⫽1.0). For QTL
1 and QTL 2 the observed values are 2 and 0 (Oj1⫽2 and
Ej2⫽p2Sj.WhereSjis the total number of effects of QTL
Oj2⫽0, wherej⫽1 or 2). For QTL 3 and QTL 4, the observed
j, andp1andp2are the relative frequencies with which
values are also 2 and 0 (Oj1⫽0 andOj2⫽2, wherej⫽3 or
a trait inT1 or T2 is affected by any QTL in the total 4). Hence the value ofM
P⫽(2⫺1)2/1⫹(0⫺1)2/1⫹(2⫺
sample, 1)2/1⫹(0⫺1)2/1⫹(0⫺1)2/1⫹(2⫺1)2/1⫹(0⫺1)2/
1⫹(2⫺1)2/1⫽8. This system is highly parceled and this
is reflected in a large value of theMPstatistic. (C) For all the
p1⫽
Rn j⫽1Oj1
Rn
j⫽1(Oj1⫹ Oj2)
and p2 ⫽1⫺p1.
QTL in this sample, the expected and observed values are 1.0. This example reflects the minimum amount of parcelation
The parcelation statistic MPtherefore reads possible and henceMP⫽0.
MP⫽
兺
n
j⫽1
兺
2i⫽1
(Oji⫺ Eji)2
Eji .
null hypothesis is that the effects of a QTL are randomly distributed among the traits of the two trait sets. Re-Intuitively, this statistic measures the degree to which
to be clustered within each trait set. In genetic terms, this means that the QTL are “character specific,” i.e., their effects tend to be limited to a set of traits. This was tested inCheverudet al.(1997) for each individual QTL. The present statistic assesses this association be-tween QTL and trait sets for the whole data set. The larger the value of this statistic, the less likely it is that a mutation will have an effect on both trait setsT1and
T2(Figure 2, B and C).
Application and test distribution: To illustrate how these statistics are utilized, consider a study where n
QTL have been identified that have effects on at least two ofNobserved phenotypic traits. Let us assume that
k of these traits describe a complex T1 that performs Figure3.—The amount of pleiotropy in the QTL data of
some common function. The information about the Cheverudet al.(1997).x-axis, number of traits affected by an individual QTL;y-axis, number of QTL with effects onx
functional significance of T1 must be available from
traits. Note that the QTL with an effect on only a single trait
some independent source, such as a study of the
func-were not considered in this study.
tional morphology of the traits. We want to test whether
T1is more modular than expected for a random set of
traits. To do this, we first determine the values of the
of traits for their degree of integration or parcelation. statistics forT1and then the cumulative mass function
In this case, the two units of the mandible have only a (cmf) of MI and MP with respect to all the possible
single trait in common. subsets ofktraits taken from the totalN traits. If both
the values of MI and MP are greater than the critical
value (using␣ ⫽0.05 for this study), the null hypothesis
RESULTS
is rejected;i.e., the modularity of the set is greater than
For this study, we assessed the modularity of func-expected for a randomly chosen set of traits.
tional sets of the mandible of the mouseMus musculus.
The “shape” of the cmf for the statistics MI andMP
A QTL study performed byCheverudet al.(1997) dis-will depend on the distribution of pleiotropic effects
covered 41 QTL, of which 37 QTL affect at least 2 of among the QTL. Optimally, the value ofMIandMPfor
the 21 traits of the mandible (Figure 1). A summary of all possible sets of k traits should be determined to
the amount of pleiotropy in this data set (the frequency calculate the cmfs exactly. This is the procedure adopted
of QTL effectingztraits) is provided in Figure 3. The in our study. However, if the values of theEijare
gener-average number of traits affected by a QTL is 4.0, and ally⬎5 and if no or only a few QTL have a number of
the maximum is 13 traits. In this study, we assessed two effects⬎korN⫺k, then the sampling distributionMP
functional sets of traits defined in Cheverud (2000), will approximately follow a2distribution with 2nd.f.
the ascending ramus (traits 1–11 and 21; k⫽12) and We do not in general expect the marginal
distribu-the alveolar region (traits 10 and 12–20;k⫽10; Figure tions of the statisticsMI andMPto be independent. If
2). All the major mandibular muscles attach to the as-they are not independent, the probability of rejecting
cending ramus. The shape of the ramus is critical for the null hypothesis for both statistics for a random set
proper motion of the chewing and biting apparatus of ktraits is somewhere between 0.0025 (for
indepen-and therefore is considered to have been under strong dent MI and MP) and 0.05 (for a correlation of 1.0).
selection pressure (AtchleyandHall1991). The alve-Regardless of the correlation structure, we still consider
olar region is the location of tooth attachment. The a functional unit to be significantly modular if we can
form of this region is critical for proper positioning of reject the null hypothesis for both statistics. It is
ex-the teeth (Atchleyet al.1992). The results discussed pected that the correlation of the statistics will not be
below are summarized in Table 1. useful for comparing the power of the test for different
Ascending ramus:The ascending ramus is described data sets as the distribution associated with an
alterna-byk⫽12 of the 21 traits in this study. These traits are tive hypothesis (how traits of the unitT1are assigned)
affected bym⫽32 QTL of the 37 that have effects on will not necessarily be comparable between data sets.
at least 2 traits. The maximum number of traits these It should be noted that for cases where we are
as-QTL could affect is 12⫻32⫽384. The observed num-sessing the integration and parcelation of more than
ber of effects on ascending ramus traits is 98 and thus the one unit of a single data set, the units should not have
integration statistic is MI ⫽ 0.188. The cmf of the
in-many traits in common. If two units have in-many traits in
tegration statistics fork⫽12 yields aPvalue of 0.0102, common, we would expect similar results (rejection or
which is significant at the 2% level. This value reflects nonrejection) for both units. We must therefore be
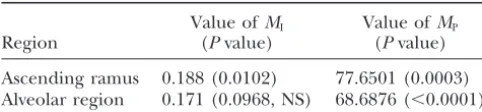
TABLE 1 map to modularize functionally integrated sets of char-acteristics. A rejection of the null hypothesis is
consid-The values of statistics and correspondingPvalues
ered as evidence in support of the hypothesis of the imitatory epigenotype (Riedl 1978). In drawing this
Value ofMI Value ofMP
Region (Pvalue) (Pvalue) conclusion, it is of critical importance that the classifica-tion of the traits into funcclassifica-tional units is done on the
Ascending ramus 0.188 (0.0102) 77.6501 (0.0003)
basis of independent evidence (seeSchwenk 2000 for
Alveolar region 0.171 (0.0968, NS) 68.6876 (⬍0.0001)
a review of the concept of a functional unit). This is
NS, not significant. the case in this study, where the ascending ramus and
alveolar region of the mandible have been identified as functional units independent of the genetic structure would have been observed if the traits were selected at (AtchleyandHall 1991;Atchleyet al.1992). random. For the data set of Cheverud et al. (1997), the
as-Of the total 160 effects of the QTL, 98 affected traits cending ramus represents a well-modularized portion of the ascending ramus. The probability that a trait of the phenotype. For the alveolar region, rejection of affected by a QTL is in this region (p1) is therefore the parcelation null hypothesis indicates that mutation
0.6125. Given this probability and the individual effects effects are significantly parceled with respect to this of the QTL, the parcelation statistic is calculated to be region. Although the integration null hypothesis could 77.650. This corresponds to a P value of 0.0003. We not be rejected for the alveolar region, the P value is conclude that the ascending ramus is both more inte- only 0.0968 (Table 1). Given the significant test results grated and more parceled than expected by chance. It for the ascending ramus, the results for the alveolar thus fulfills the criteria for a modularized unit (of the region (significant result for parcelation and nonsig-part of the phenotype that is described by the set of nificant result for integration) are somewhat expected. observed traits). Since the ascending ramus and alveolar region together
Alveolar region:Of the 21 traits observed,k⫽10 are comprise all 21 traits of the mandible, the parcelation ascribed to the alveolar region. These traits are affected statistic is measuring the degree to which QTL affect bym⫽ 28 QTL with at least 2 effects. The maximum either the ramus or the alveolar region. Hence, if we number of effects on the alveolar region is 280. The observe a significant result for one region we are likely number of effects on the alveolar region traits is 71, to observe a significant result for the other. Similarly, which leads to an integration statistic of MI ⫽ 0.171. since the ascending ramus is highly integrated, the
alve-This value is similar to that obtained for the ascending olar region would need to have a level of integration ramus. The cmf of the statistic, however, reveals that close to the ramus to produce a significant result as this value is not significantly different from a random well. That is, both units may be integrated but the effect sample of traits (P⫽ 0.0968) at the 5% level. will only be detected if the integration of the units is Of the total 160 effects of the QTL, 71 affected the comparable. A better test would consider more traits alveolus such thatp1, thea prioriprobability of an alveo- such that together the ascending ramus and alveolar
lar trait affected by a QTL, is 0.444. Given this probability regions would contain far fewer than the total number and the individual effects of the QTL, the parcela- of traits. If this is the case, different levels of integration tion statistic is 68.688. This corresponds to aPvalue of may still produce a significant result in the integration
⬍10⫺4. The alveolar region is thus a part of the
pheno-test and we might expect different results for the par-type that is well parceled from the rest of the mandible celation test. To determine if both of these units reflect but not more integrated than expected by chance. The a modular pattern, we would therefore need a QTL alveolar region can thus be seen as a collection of quasi- data set comprising more traits. Our study does at least independent traits rather than an integrated character confirm that the ascending ramus is a genetically modu-complex. lar unit of the phenotype (Cheverudet al.1997).
A limitation of our tests is that they only take into account whether a QTL has a significant effect on a
DISCUSSION
trait or not. Ideally one would like to take into account the magnitude of the effects to assess the degree of There are two aspects to the test proposed in this
article. On the one hand, it is a test for the nonran- integration and/or parcelation. The problem, though, with including the magnitude of the effects is that most domness of the distribution of QTL effects on a subset
of traits. As such, this test does not address which evolu- of the effects are small and thus the confidence intervals are relatively large. This implies that there is little actual tionary forces may have caused the nonrandom pattern.
If, however, the test is performed on a set of traits that information added to the analysis if the measured effect is taken into account other than the fact that the effect
a priorihave been classified as describing a functional
unit, it is in fact an indirect test of the hypothesis that is greater than zero.
sents a filtered sample of mutations that may occur. distinguish between these two scenarios by analyzing That is, a QTL data set not only reflects the probability genetic correlations. Our results and that reported in of a mutation occurring but also the fixation probability Cheverudet al.(1997) show that the independent varia-of a mutation during the preparation varia-of the lines used tion between the two major regions of the mandible is in the QTL study. Since different QTL study conditions due to a relative lack of pleiotropic effects rather than may produce different probabilities of fixation, it is pos- due to antagonistic pleiotropic effects.
sible that the tests may produce a significant result for It should be noted that although the results from the one set of lines but may not with another set of lines. QTL analysis are consistent with the hypothesis that Consider, for instance, a functional complex that is natural selection may result in modular structures, re-modular. A group of mutations that occur in this system sults from this test alone are not sufficient to actually are likely to reflect this modular structure. However, a infer the action of natural selection in creating a modu-QTL study protocol may end up fixing a filtered sample lar pattern. To more directly investigate the possible role of these mutations that no longer have a modular distri- of natural selection in causing the association between bution. Because QTL study conditions could also have functional and genetic integration, it is necessary to the opposite effect, making a nonmodular unit appear analyze data on the evolution of the genotype-pheno-modular, it is important to test data from other QTL type map and the evolution of character function. How-studies using different inbred lines before drawing a ever, with analyses of the sort described in this study, we final conclusion concerning the modularity of a struc- can now begin to examine the architecture of genotype-ture. Since multiple QTL data sets do not presently phenotype maps and provide a foundation for such exist for the mouse mandible, we can only interpret the studies.
present results as consistent with the hypothesis that the The authors thank Junhyong Kim and David Houle for critically ascending ramus is a modular unit. reading the manuscript. We further thank Homayoun Bagheri, Chi-The genetic structure of the mouse mandible has Hua Chiu, Ashley Carter, Christian Pazmandi, Scott Rifkin, Max Shpak, and Terri Williams for stimulating discussions on the topic of
been studied in the past with quantitative genetic
meth-this article. The support by National Science Foundation grants
IBN-ods (Bailey1956; Atchleyet al.1985, 1992). Bailey
9905403, DEB-9419992, and DEB-9726433 is gratefully acknowledged.
(1956) presented a principle component analysis of the genetic correlations matrix and found a general size factor and one factor with contrasting loadings on
alveo-lar region and ascending ramus measurements. This LITERATURE CITED
result is consistent with our finding that these two parts Atchley, W. R.,andB. K. Hall,1991 A model for development of the mandible are modular. Bailey’s result, however, and evolution of complex morphological structures. Biol. Rev.
66:101–157.
may in part be a measurement artifact since all the
Atchley, W. R., A. A. PlummerandB. Riska, 1985 Genetics of
measurements in his study have one landmark in com- mandible form in the mouse. Genetics111:555–577.
mon, located at the junction between the ascending Atchley, W. R., D. E. Cowely, C. VoglandT. McLellan,1992 Evolutionary divergence, shape change and genetic correlation
ramus and the corpus of the mandible. This can cause
structure in the rodent mandible. Syst. Biol.41:196–221.
spurious correlations proportional to the angle among
Bailey, D. W.,1956 A comparison of genetic and environmental
the distances measured. Atchley et al. (1985) pre- principal components of morphogenesis in mice. Growth20:
63–74.
sented a cluster analysis of genetic correlations among
Bonner, J. T.,1988 The Evolution of Complexity.Princeton University
mandible traits, which showed two clusters of ascending
Press, Princeton, NJ.
ramus and alveolar measurements in addition to some Cheverud, J. M.,1982 Phenotypic, genetic and environmental
mor-phological integration in the cranium. Evolution36:499–516.
independently varying traits. A reanalysis of the same
Cheverud, J. M.,2000 The genetic architecture of pleiotropic
rela-data inAtchleyet al. (1992) did not reveal any clear
tions and differential epistasis, inThe Character Concept in
Evolution-pattern of modularity (see Figure 9 inAtchley et al. ary Biology, edited byG. P. Wagner.Academic Press, San Diego
1992). (in press).
Cheverud, J. M., E. P. RoutmanandD. K. Irshick,1997 Pleiotropic
The comparison of genetic correlations and QTL data
effects of individual gene loci on mandibular morphology.
Evolu-on the genetic architecture of characters is complicated tion51:2004–2014.
by two factors. At the one hand, the genetic correlations Knott, S. A.,andC. S. Haley,1992 Aspects of maximum likelihood methods for the mapping of quantitative trait loci in line crosses.
reflect not only the pattern of mutational effects but
Genet. Res.60:139–151.
also the frequencies of segregating alleles in the popula- Lander, E. S.,andD. Botstein,1989 Mapping mendelian factors tion in which the genetic correlations were estimated. underlying quantitative traits using RFLP linkage maps. Genetics
121:185–199.
Genetic correlations are as much a property of the
popu-Liu, B.,1998 Statistical Genomics.CRC Press LLC, Boca Raton, FL.
lation composition as they are a property of the genetic Lynch, M.,andB. Walsh,1998 Genetics and Analysis of Quantitative architecture of the traits. Furthermore, a low genetic Traits.Sinauer Associates, Sunderland, MA.
Olson, C.,andR. Miller,1958 Morphological Integration.The
Uni-correlation can indicate one of two things: it could be
versity of Chicago Press, Chicago.
caused by a relative lack of pleiotropic effects among
Penrose, L. S., 1935 The detection of autosomal linkage in data
the traits or a pattern of positive and negative pleiotro- which consist of pairs of brothers and sisters of unspecified
parent-age. Ann. Eugen.6:133–138.
Raff, R. A.,1996 The Shape of Life: Genes, Development, and the Evolution Sturtevant, A. H.,1913 The linear arrangement of six sex-linked of Animal Form.University of Chicago Press, Chicago. factors inDrosophila, as shown by their model of association. J. Riedl, R.,1978 Order in Living Organisms.Wiley Press, New York. Exp. Zool.14:43–59.
Routman, E. P.,andJ. M. Cheverud,1994 Individual genes underly- Wagner, G. P.,1996 Homologues, natural kinds and the evolution ing quantitative traits: molecular and analytical methods, pp. of modularity. Am. Zool.26:36–43.
593–606 inMolecular Ecology and Evolution: Approaches and Applica- Wagner, G. P.,andL. Altenberg,1996 Complex adaptations and tions, edited byB. Schierwater, B. Streit, G. P. Wagnerand the evolution of evolvability. Evolution50:967–976.
R. DeSalle.Birkha¨user, Boston/New York. Zeng, Z.,1993 Theoretical basis of segregation of multiple linked Sax, K.,1923 The association of size differences with seed-coat pat- gene effects on mapping quantitative trait loci. Proc. Natl. Acad.
tern and pigmentation inPhasolus vulgaris.Genetics8:552–560. Sci. USA90:10972–10976. Schwenk, K., 2000 Functional units and their evolution, in The