Copyright1999 by the Genetics Society of America
Multiple-Trait Mapping of Quantitative Trait Loci After Selective
Genotyping Using Logistic Regression
John M. Henshall and Michael E. Goddard
1Animal Genetics and Breeding Unit,2University of New England, Armidale, New South Wales 2351, Australia Manuscript received April 14, 1998
Accepted for publication October 30, 1998
ABSTRACT
Experiments to map QTL usually measure several traits, and not uncommonly genotype only those animals that are extreme for some trait(s). Analysis of selectively genotyped, multiple-trait data presents special problems, and most simple methods lead to biased estimates of the QTL effects. The use of logistic regression to estimate QTL effects is described, where the genotype is treated as the dependent variable and the phenotype as the independent variable. In this way selection on phenotype does not bias the results. If normally distributed errors are assumed, the logistic-regression analysis is almost equivalent to a maximum-likelihood analysis, but can be carried out with standard statistical packages. Analysis of a simulated half-sib experiment shows that logistic regression can estimate the effect and position of a QTL without bias and confirms the increased power achieved by multiple-trait analysis.
E
XPERIMENTS to detect and locate quantitative ers (e.g.,JiangandZeng1995;Korolet al. 1995; Wel-trait loci (QTL) in livestock species are becoming leret al. 1997). There are several reasons whymultiple-more common, driven by the potential for increased trait QTL mapping is of interest. Not only will an under-genetic gain in traits of economic importance (e.g., standing of a QTL’s part in the genetic covariance struc-Soller1978;MeuwissenandGoddard1996). A vari- ture of economically important traits be important if ety of experimental designs have been used, and various selection decisions are to be based on QTL genotype, statistical methods have been applied to the resulting but the statistical power to detect QTL is potentially data. With commercial livestock, designs commonly higher in multiple-trait analysis than in single-trait analy-measure phenotype and genotype on half-sib families, sis. BothKorolet al. (1995) andJiangandZeng(1995) because of the higher reproductive capacity of males. demonstrate such increased power on simulated data-The phenotype records might be measured directly on sets while maximizing the likelihood to obtain multiple-the half-sibs, as in a daughter design, or on multiple-the progeny trait parameter estimates.
of the half-sibs, as in a granddaughter design (Weller Another approach often applied in livestock QTL
de-et al. 1990). The data are commonly analyzed using tection experiments is selective genotyping, in which maximum-likelihood or regression interval mapping only animals with extreme phenotypes are genotyped (LanderandBotstein1989;HaleyandKnott1992; (seeLebowitzet al. 1987;LanderandBotstein1989; MartinezandCurnow1992). The regression methods Darvasi and Soller 1992; Muranty and Goffinet are computationally less demanding, which may be 1997;BovenhuisandSpelman1998). For a given num-relevant if techniques such as permutation testing ber of animals genotyped, the power to detect QTL is (ChurchillandDoerge1994) are used to determine increased with this approach. However, although simple significance thresholds. These methods were initially regression methods can be used to estimate parameters developed for detecting QTL that affect a single trait. with selective genotyping, the estimates will be biased. Even when phenotype measurements have been avail- To obtain unbiased estimates, maximum likelihood can able on multiple traits, the results of single-trait analyses be applied to the full dataset, including the ungeno-have generally been presented in the literature. typed animals (LanderandBotstein1989), or approx-In recent years, the possibility of multiple-trait QTL imations to the parameters can be made (Darvasiand detection has been considered by a number of research- Soller 1992;MurantyandGoffinet 1997). Markov chain Monte Carlo methods, which sample missing data, are also appropriate for selectively genotyped data (see Binket al. 1998;Jansenet al. 1998). The estimation of
Corresponding author: John Henshall, Animal Genetics and Breeding
Unit, The University of New England, Armidale, NSW 2351, Australia. the effects of QTL in traits correlated to the trait in
E-mail: [email protected] which selective genotyping occurred is also problematic
1Present address: Institute of Land and Food Resources, University
(seeWelleret al. 1997). Unless the selective genotyping
of Melbourne, Parkville, Victoria, 3052 Australia.
and the correlation are taken into account, parameter
2Animal Genetics and Breeding Unit (AGBU) is a joint institute of
New South Wales Agriculture and The University of New England. estimates in the correlated trait will be biased.
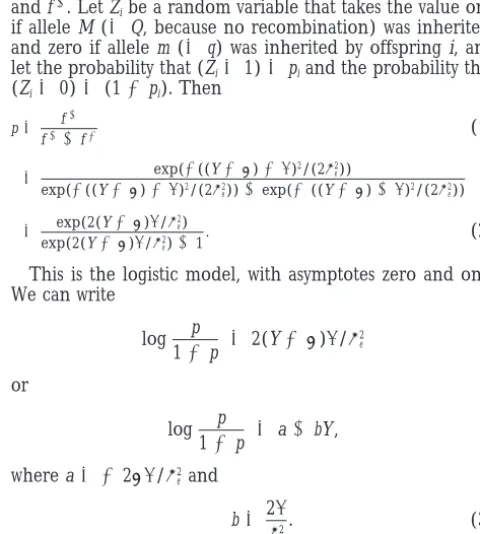
and f1. Let Zibe a random variable that takes the value one mum-likelihood methods or the less computationally
if allele M (5Q, because no recombination) was inherited, demanding approximation methods ofMurantyand
and zero if allele m (5q) was inherited by offspring i, and Goffinet(1997) andBovenhuisandSpelman(1998) let the probability that (Z
i51)5piand the probability that can be applied. These authors state that these approxi- (Zi50)5(12pi). Then
mations are suitable when QTL effects are small.
p5 f1
f11f2 (1)
Most statistical methods currently used for QTL detec-tion, including those mentioned above, make
compari-5 exp(2((Y2 m)2 a)2/(2s2e))
exp(2((Y2 m)2 a)2/(2s2
e))1exp(2((Y2 m)1 a)2/(2s2e))
sons between the phenotypes of alternate marker geno-types. Alternatively, the marker genotypes of differing
phenotypes can be compared (Stuberet al. 1980, 1982). 5 exp(2(Y2 m)a/s2e)
exp(2(Y2 m)a/s2
e)11
. (2)
Lebowitzet al. (1987) called this approach trait based,
This is the logistic model, with asymptotes zero and one. as opposed to marker based, and presented methods
We can write to compare the marker allele frequencies in divergent
selection lines or selectively genotyped individuals.
log
1
p12p
2
52(Y2 m)a/s 2 e In this article, a more general trait-based method ispresented. The method is suited to half-sib data and or addresses the problems that arise with multiple-trait
QTL detection on selectively genotyped data. Results log
1
p12p
2
5a1bY , comparable with those obtained with maximumlikeli-hood on the full dataset can be achieved, using software where a5 22ma/s2 eand in standard statistical packages. The method is
regres-b52a s2 e
. (3)
sion based, but instead of regressing phenotype on ge-notype, the regression is genotype on phenotype. This
We can estimate a and b with standard logistic-regression soft-replaces the assumption that the phenotypes are
unse-ware using Z as the response variable and Y as the explanatory lected with the assumption that there was no selection
variable. Here, for each animal, Ziis the number of “successes” based on genotype. This assumption is easily satisfied from one trial if success is inheriting allele M. A software by including all genotyped animals in the analysis. With package that allows single observations and a continuous ex-half-sib experiments, in treating genotype as the response, planatory variable should be chosen, to avoid having to group
observations into classes based on phenotype. the response variable is binary. Methods for analyzing
The total variance,s2, is composed ofs2
eand the variance binary data are well understood (e.g.,CoxandSnell1989;
due to the sire QTL allelea2. We have Dobson1990), and suitable subroutines are included in
s25 s2
e1 a2. (4) the major statistical computing packages.
Given an estimate of b and an estimate ofs2from all of the data, we can solve (3) and (4) foraands2
eto obtain STATISTICAL METHODS
a 5 211√11b2s2
b .
Single trait, no recombination model:In the first case
con-sidered, it is assumed that there is no recombination between
the genotyped locus and the locus affecting the quantitative It is important that the estimate ofs2be from all of the data, trait. This would apply when testing for an effect from a candi- not from a selected sample.
date gene. A single-sire, half-sib design will be assumed, with Figure 1 contains an example of the function p, where the no genotypes available on the dams. Let the QTL have two sire QTL allele accounts for 20% of the total variance. The alleles, Q and q, and the genotypic marker have two alleles, underlying normal distributions are also shown. The parame-M and m. The model can be written as ter b is related to the “slope,” and it is our estimate of b that allows us to estimate the magnitude of the QTL. For the yi5 m 1sia 1ei,
mixture distribution in Figure 1, selecting the upper and lower 5% of observations would exclude records with phenotypes where yiis the phenotypic value for offspring i (adjusted for
any contemporary group effects), mis a sire mean, si is an between22 and 2. For phenotypes of62, the ratio of allele frequencies is around 0.1:0.9, and the shape of the curve p indicator variable taking values of minus one if QTL allele q
was inherited from the sire or the value of one if QTL allele between22 and 2 can be interpolated reasonably well even without observations in this region. If more extreme selection Q was inherited from the sire,ais the allele substitution effect,
and eiis a random error term, which includes environmental were applied, or if the QTL effect were larger, then the ratio of allele frequencies at the truncation points might approach variance, a genetic effect due to the QTL allele inherited from
the dam, and a polygenic effect. The polygenic effect consists 0.0:1.0. Then the shape of the curve between the truncation points could not be reliably interpolated. Selection on the of deviation from the sire mean due to Mendelian sampling
(0.25 additive genetic variance) and an effect due to the dam basis of phenotype, as in selective genotyping, will reduce the precision with which we estimate b (and therefore a) (0.5 additive genetic variance). In this model, the indicator
variable sican be observed. compared with genotyping the whole sample, the degree by which the precision is reduced being a function of the percent-If we assume the eihas a normal distribution with variance
s2
e, then the distribution of phenotypes is a mixture of two age of records genotyped and the size of the QTL effect. To be useful in QTL detection, a measure of how well the normal distributions, with means (m 2 a) and (m 1 a), and
common variance s2
AA9b 12A5
o
b (5)A(A9b 12)5
o
bA5
o
bA9b 12; (6)
also from (5),
b9AA9b 12b9A115 b9
o
b 11 (A9b 11)25 b9o
b 11A9b 5√b9
o
b 1121 ; (7)and combining (6) and (7),
A5
o
b11√b9
o
b 11.So, using multivariate logistic-regression software, we can esti-mate the vectorb, and using an estimate ofRfrom the com-plete experimental data, we can simultaneously estimate
multi-Figure1.—An example of the function p, the probability
ple-trait QTL effects. Again, any selective genotyping carried that allele Q was inherited from the sire given the phenotype.
out is selection on the explanatory variable(s), and, while it Here, the sire QTL allele accounts for 20% of the total
vari-may reduce the precision of the estimates, it should not cause ance. Also shown are the two components of the underlying
systematic bias. mixture distribution.
Recombination model:Both the single- and multiple-trait
methods described above assume that there is no recombina-tion between the genotyped locus and the locus affecting required. Standard logistic regression software generally
pro-the quantitative trait. In QTL detection experiments using vides a log-likelihood ratio test for whether bˆ is significantly
markers, this assumption cannot be made. The indicator vari-different from zero. As b52a/s2
e, this is equivalent to testing
able si is now unobservable. If we consider a single marker the hypothesis thata 50, so these tests may be used to draw
with a recombination rate r with the QTL, the multivariate conclusions about the significance ofa.
logistic model becomes
Multiple-trait, no recombination model:The methods
de-scribed above are easily extended to the situation where
phe-p5r1(122r) exp(Y9b)
exp(Y9b)11 , (8) notypes are available on more than one trait. Let f1and f2in
Equation 1 be multivariate normal distributions. If the sire
mean is a vectorm, and the vector of half the average sire where p is the probability that Z51, where Z relates to the allele effects A, then the mean of animals in distribution f1 marker allele inherited. Again this is the logistic equation, will bem15 m 1A, and the mean of animals in distribution with additional parameters r and (122r). For a single marker, f2will bem25 m 2A. If the covariance matrix estimated from these represent the horizontal asymptotes, with r the lower the data is R, and the covariance matrix within sire QTL asymptote and r 1 (1 2 2r) the upper asymptote. If r is genotype is V, thenR5V1AA9. As in the single-trait model, V unknown, then in theory, the estimates of the asymptotes will contain both genetic and nongenetic components. Then, provided by standard logistic-regression software could be used to estimate r. However, for QTL of moderate size, there p5 f1
f11f2 will be little information about the asymptotes in the data. Therefore it is not recommended that this approach be used. A more common use of this model is where an estimate of
5 exp(21⁄2(Y2 m1)9V21(Y2 m1)) exp(21⁄
2(Y2 m1)9V21(Y2 m1))1exp(21⁄2(Y2 m2)9V21(Y2 m2)) ais required, given a map position relative to a number of markers, as in interval mapping. A method is therefore
re-5 exp(21⁄2((Y2 m1)9V21(Y2 m1)2(Y2 m2)9V21(Y2 m2))) exp(21⁄
2((Y2 m1)9V21(Y2 m1)2(Y2 m2)9V21(Y2 m2)))11
quired to summarize the information from multiple markers into a form that can be used in Equation 8, in which we require a vector p and an associated vector r. As for maximum-so
likelihood methods, we can calculate the probability that ani-mal i inherited the sire allele Q, on the basis of the observed log
1
p12p
2
5 21
2((Y2 m1)9V 21(Y2 m
1)2(Y2 m2)9V21(Y2 m2))
marker transmission, the recombination rates between the postulated locus and the markers, and the assumed mapping function. Let this probability be qi. Although qiwas estimated
5 21
2(m91V 21m9
12 m92V21m9222Y9V21(m12 m2)) .
from multiple markers, we can proceed as if it had been estimated from a single marker and recover a value pi, which Multivariate logistic regression packages estimateb, where
will be either zero or one, and a value ri, which will be,0.5. As
log
1
p12p
2
5Y9b;q5
5
12r if p51r if p50
so, ignoring the intercept in Y9b, b 5V21(m
12 m2) and as r,0.5, we can write
52V21A
There are several numerical methods that can be used to quired to estimatea. For the ML analysis, the log-likeli-estimatebgiven vectors p and r. In testing, both fitting Equa- hood was maximized numerically using NAG subroutine tion 8 using nonlinear least squares and iteratively maximizing
E04JAF (NAG 1991). The likelihood used was the likelihood of Equation 8 appeared to work well with a
single trait. However, as the focus of this article is on using
standard statistical software for multiple-trait analysis, an ap- L5
p
n
i51 1
√
2ps21
qiexp1
21
2s2(yi2 m 2 a) 2
2
proximate method of interval mapping is described. Thereare two parts to the problem, the estimation of b and the
evaluation of the log-likelihood ratio statistic. We have already 1 (12q i) exp
1
21
2s2(yi2 m 1 a)
2
22
, (10) shown how to estimatebat the markers, and provided thatthe markers are not too far apart, simple interpolation will
provide sufficiently accurate estimates between the markers. where qi is either 1 or 0 if the marker is informative, Given an estimate of b, the evaluation of the log-likelihood and 0.5 if the marker is uninformative, or if the animal is straightforward. For the logistic model, the log-likelihood was not genotyped. The DS and MG methods require takes the form
no special software.
Three models were used to simulate the data. In the
D52
o
o logoe, (9)first model, the error term was normally distributed, and the selective genotyping was the only selection ap-where e is the expected frequency and o is the observed
fre-plied to the data. This would be the case if all markers quency (Dobson1990). The estimate ofbcan be substituted
were fully informative. This resulted in truncation selec-into (8) along with the vector of recombination rates r to
estimate pˆ. Then, (9) can be evaluated using p and pˆ as the tion, with equal proportions informative in each tail. observed and expected frequencies. If the interpolated esti- Table 1 summarizes the results obtained. All four meth-mate ofbis to be used to estimate the QTL effect, then an ods provide similar estimates and standard errors when adjustment for recombination between the markers and the
QTL effects are small. It is only when the QTL effect is QTL will be required.
large that differences are observed between the meth-ods. For a QTL effect of 0.5, with selective genotyping, methods DS and MG underestimate the QTL effect, RESULTS OF SIMULATION STUDIES
and methods LR and ML overestimate the QTL effect. To compare the logistic-regression method to alterna- To test the performance of the methods when the tive methods and to generally examine its performance, error is not normally distributed, errors were simulated various simulation studies were carried out. Phenotypic from other distributions in the second model. Two dis-values were generated by adding randomly generated tributions were used: a mixture distribution, composed error terms to genotypic values. In all cases, a half-sib of two normal distributions, with the difference in means design was simulated with phenotypes available on 1000 responsible for a variance of 0.5, and a x2-distribution half-sibs. All simulations were repeated 100 times, and with 4 d.f., scaled to produce a total variance of 1.0. mean estimates and significance levels were calculated. These are similar to the distributions used by other
Single trait, no recombination:A sire QTL effect and researchers (e.g., MurantyandGoffinet 1997). The an error term were simulated, with the sire allele ac- mixture distribution could occur because of the effect counting for 0, 1, 4, and 25% of the total phenotypic of other QTL segregating or because of failure to cor-variance. As the total phenotypic variance was 1.0, the rectly account for fixed effects. Thex2-error produces magnitudes of the sire allele effects were 0.0, 0.1, 0.2, a skewed distribution of phenotypes.
and 0.5. Three levels of selective genotyping were tested, Table 2 contains the results for sire QTL allele effects with genotypes available on all animals (i.e., no selective of 0.1 and 0.2 and one result for a sire QTL allele effect genotyping), on 50% of animals, and on 10% of animals. of 0.5. When genotype records were available on all Where selective genotyping was applied, genotypes for animals, the nonnormal error had little effect on the the animals with the highest and lowest phenotypes were estimates of the QTL effect. With selective genotyping
made available. however, all methods had difficulties in estimating the
The allele effect (a) was estimated with logistic re- QTL effect. When the error was from the mixture distri-gression (LR), with maximum likelihood (ML), and bution, method DS produced estimates of QTL effect with the methods of Darvasiand Soller(1992; DS) closest to those simulated, with little difference between andMurantyandGoffinet(1997; MG). Estimates of the mean estimates produced by methods MG, LG, and
re-TABLE 1
Estimates of QTL allele effects, normal error, truncation selection
Estimate ofa
Gen (%) DS MG LR ML
Simulated value50.0
100 0.00160.003 0.00160.003 0.00160.003 0.00160.003 50 0.00060.003 0.00060.003 0.00060.003 0.00060.003 10 20.00560.004 20.00560.004 20.00560.004 20.00560.004
Simulated value50.1
100 0.10160.003 0.10160.003 0.10160.003 0.10160.003 50 0.10060.003 0.10060.003 0.10060.003 0.10060.003 10 0.09760.004 0.09660.004 0.09960.005 0.09760.005
Simulated value50.2
100 0.20160.003 0.20160.003 0.20160.003 0.20160.003 50 0.20060.003 0.20060.003 0.20160.003 0.20160.003 10 0.19760.004 0.19660.004 0.20660.005 0.20460.005
Simulated value50.5
100 0.50160.002 0.50160.002 0.50160.002 0.50160.002 50 0.48960.002 0.49060.002 0.50260.003 0.50260.003 10 0.40860.002 0.42060.002 0.52660.006 0.51160.005
Estimates are means and standard errors of 100 replicates, where Gen refers to the percentage of animals genotyped. Estimation methods were those ofDarvasiandSoller(1992; DS) andMurantyandGoffinet
(1997; MG). LR, logistic regression; ML, maximum likelihood.
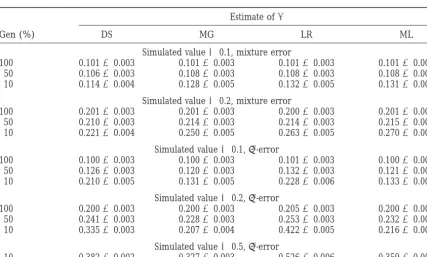
TABLE 2
Estimates of QTL allele effects, nonnormal error
Estimate ofa
Gen (%) DS MG LR ML
Simulated value50.1, mixture error
100 0.10160.003 0.10160.003 0.10160.003 0.10160.003 50 0.10660.003 0.10860.003 0.10860.003 0.10860.003 10 0.11460.004 0.12860.005 0.13260.005 0.13160.005
Simulated value50.2, mixture error
100 0.20160.003 0.20160.003 0.20060.003 0.20160.003 50 0.21060.003 0.21460.003 0.21460.003 0.21560.003 10 0.22160.004 0.25060.005 0.26360.005 0.27060.006
Simulated value50.1,x2-error
100 0.10060.003 0.10060.003 0.10160.003 0.10060.003 50 0.12660.003 0.12060.003 0.13260.003 0.12160.003 10 0.21060.005 0.13160.005 0.22860.006 0.13360.005
Simulated value50.2,x2-error
100 0.20060.003 0.20060.003 0.20560.003 0.20060.003 50 0.24160.003 0.22860.003 0.25360.003 0.23260.003 10 0.33560.003 0.20760.004 0.42260.005 0.21660.004
Simulated value50.5,x2-error
10 0.38260.002 0.32760.003 0.52660.006 0.35960.004
Estimates are means and standard errors of 100 replicates, where Gen refers to the percentage of animals genotyped. Estimation methods were those ofDarvasiandSoller(1992; DS) andMurantyandGoffinet
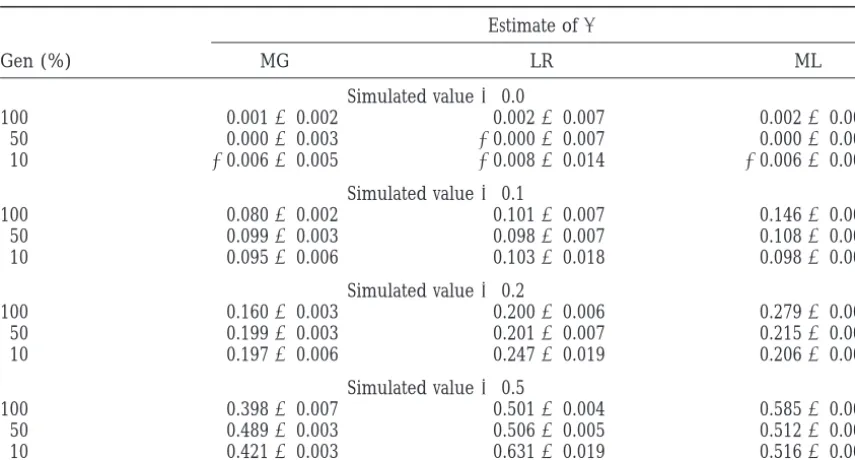
TABLE 3
Estimates of QTL allele effects, nontruncation selection
Estimate ofa
Gen (%) MG LR ML
Simulated value50.0
100 0.00160.002 0.00260.007 0.00260.004 50 0.00060.003 20.00060.007 0.00060.004 10 20.00660.005 20.00860.014 20.00660.006
Simulated value50.1
100 0.08060.002 0.10160.007 0.14660.004 50 0.09960.003 0.09860.007 0.10860.004 10 0.09560.006 0.10360.018 0.09860.006
Simulated value50.2
100 0.16060.003 0.20060.006 0.27960.004 50 0.19960.003 0.20160.007 0.21560.003 10 0.19760.006 0.24760.019 0.20660.006
Simulated value50.5
100 0.39860.007 0.50160.004 0.58560.003 50 0.48960.003 0.50660.005 0.51260.003 10 0.42160.003 0.63160.019 0.51660.006
Estimates are means and standard errors of 100 replicates, where Gen refers to the percentage of animals genotyped. Estimation methods were those ofMurantyandGoffinet(1997; MG). LR, logistic regression; ML, maximum likelihood. Fifty percent of markers were informative, with the ratio of identifiable alleles being 10:90%.
greater selection, or larger QTL effects, before the un- 10% of animals are genotyped. These overestimates are accompanied by relatively high standard errors. Method derestimation occurred.
Another departure from the model assumed by the ML overestimated the allele effect. This was less appar-ent when selective genotyping was applied.
estimation methods is when the selection is not
trunca-tion selectrunca-tion with fixed proportrunca-tions of animals with Multiple trait, no recombination:A bivariate analysis was performed, where the two traits had covariance ma-genotype records in each tail. This might occur when
the marker allele inherited from the sire cannot be trix determined for some animals, as occurs when the
marker genotype of the animal is the same as that of
V5
3
1.0 0.50.5 1.0
4
the sire, with no genotype available for the dam. If oneof the sire’s marker alleles is at a high frequency in the
dam population, then one of the sire’s marker alleles within QTL genotype. Vectors of QTL effects A5[0.3, will be identified more often in the offspring than the 0.3]9, A5[0.3, 0.0]9, and A5[0.0, 0.3]9were simulated, other. The effect of this was tested in the third model, with either all animals genotyped, or 10% selective geno-with 50% of genotyped markers assumed to be uninfor- typing on the first trait. It was assumed that there was mative, but with one sire allele informative 90% of the no recombination between the QTL and a marker, with time and the other sire allele informative only 10% of all markers informative. Both single-trait and
multiple-the time. trait logistic-regression analyses were carried out, using
The DS method was not applied to this model because SAS procedure LOGISTIC. The multiple-trait MG meth-it requires the assumption of known, equal, selected ods and methods of Bovenhuis and Spelman (1998; proportions. Results from application of the MG BS) were also applied to the simulated data. The results method to data in which all animals were genotyped, are summarized in Table 4.
are presented for the equation that assumed selection, When all animals are genotyped, there is no differ-as it performed better than the equation that did not ence between the allele effect estimates produced using assume selection. Table 3 contains the results obtained single- or multiple-trait analysis, and the MG and LR for methods MG, LR, and ML. All of the methods tested multiple-trait methods produce identical results. When have problems with this model. Method MG underesti- selective genotyping is applied, the single-trait analysis mates the QTL effect, except when the proportion se- produces good estimates of a1, the effect on the trait used to select animals for genotyping, but biased esti-lected is z50%. For simulated values of a of 0.2 and
esti-TABLE 4
Estimates of QTL allele effects
Method (%) a1 a2 a1 a2 a1 a2
Values simulated
0.30 0.30 0.30 0.00 0.00 0.30
Single-trait analysis
LR100 0.30 (0.003) 0.30 (0.003) 0.30 (0.003) 0.00 (0.003) 0.00 (0.003) 0.30 (0.003) LR10 0.31 (0.005) 0.43 (0.007) 0.31 (0.005) 0.28 (0.008) 0.00 (0.004) 0.17 (0.007)
Multiple-trait analysis
LR100 0.30 (0.003) 0.30 (0.003) 0.30 (0.003) 0.00 (0.003) 0.00 (0.003) 0.30 (0.003) MG100 0.30 (0.003) 0.30 (0.003) 0.30 (0.003) 20.00 (0.003) 20.00 (0.003) 0.30 (0.003) LR10 0.30 (0.005) 0.29 (0.009) 0.30 (0.005) 0.00 (0.009) 20.01 (0.005) 0.30 (0.008) MG10 0.28 (0.004) 0.25 (0.007) 0.28 (0.004) 0.02 (0.007) 20.01 (0.005) 0.29 (0.008)
BS10 0.25 (0.008) 0.01 (0.008) 0.29 (0.009)
Estimates are means and standard errors of 100 replicates, where estimation is by either logistic regression (LR), the method ofMurantyandGoffinet(1997; MG), or the method ofBovenhuisandSpelman(1998; BS), with either all animals genotyped (LR100 and MG100) or 10% of animals genotyped (LR10, MG10, and BS10). a1 is the effect of the first trait, anda2 is the effect of the second trait. Where applied, selective genotyping was on the phenotype of the first trait. The QTL genotype variance was 1.0, and the within-QTL genotype covariance between the traits was 0.5. Correlations used in the analyses were estimated from the complete data in each replicate.
mates of QTL effect from the multiple-trait methods are analyses, the data were analyzed using the regression much less biased than the single-trait analysis estimates, method of Haley and Knott (1992). The resulting with the estimates from the LR method less biased than profile (not shown) was more similar to the ML profile the estimates from the MG and BS methods. For smaller than to the LR profile. When only 10% of animals were QTL effects there were no differences between the re- genotyped the log-likelihood statistics were less than sults produced by the multiple-trait methods (results when all animals were genotyped, but there was little
not shown). difference between the ML and LR profiles. Regardless
Single trait, recombination: Markers and the QTL of whether selective genotyping was applied, it appears were simulated in the order that provided that the distance between markers is not too great, and provided that most markers are
informa-M12r1 2M22 r22Q 2r32 M3,
where M1, M2, and M3are markers, and Q is the QTL.
r1, r2, and r3are recombination rates, taking the values 0.1, 0.03, and 0.07, respectively. All markers were fully informative. The total phenotypic variance was 1.0, and
awas 0.1, so 1% of the total variance was explained by the sire QTL allele.
Interval mapping was carried out, using both ML and LR. For the ML analysis, the likelihood was maximized numerically using NAG subroutine E04JAF. The likeli-hood used was again (10), but with qicalculated from the observed marker transmission for the nearest flanking markers and the locus being mapped. Haldane’s map-ping function was assumed. SAS procedure LOGISTIC was used to obtain the LR estimates of a and b at the markers and the log-likelihood ratio statistic between the markers calculated from interpolated values of a and b.
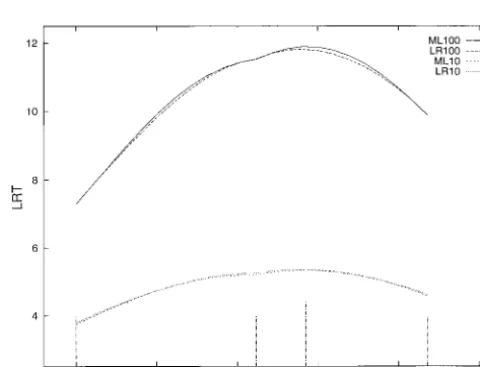
Figure 2 contains the log-likelihood ratio profiles ob- Figure2.—Log-likelihood ratio test profiles for logistic re-gression with 100% (LR100) and 10% (LR10) of animals geno-tained. When 100% of animals were genotyped, at the
typed, and maximum likelihood with 100% (ML100) and 10% markers, there is almost no difference between the
log-(ML10) of animals genotyped. The marker locations are dis-likelihood statistics produced by the two methods. Be- played as short impulses and the simulated QTL position is tween the markers, the LR profile is slightly lower than displayed as a long impulse. The sire QTL allele accounts for
DISCUSSION tive, the profiles are for practical purposes equivalent.
Having some markers not informative is equivalent to It has been shown in this article that in half-sib fami-increasing the distance between markers for some ani- lies, multiple-trait QTL detection is a simple matter of mals, and the profiles produced by the two methods performing multivariate logistic regression. As no as-may differ. However, if significance thresholds are de- sumptions are made regarding selection among pheno-termined through permutation testing (Churchill types, the method is useful for selectively genotyped andDoerge1994), similar conclusions should be drawn data as well as for experiments where genotypes are despite the differences between the profiles. known for all animals.
Multiple trait, recombination:The marker and QTL All methods for estimating QTL effects with missing locations simulated in the single-trait analysis were used genotype information require assumptions regarding for a bivariate analysis. The two traits had covariance the distribution of phenotypes within QTL genotype
matrix classes. The methods considered in this study all
as-sumed normal distributions for phenotypes, and when
V5
3
1.0 0.50.5 1.0
4
the data were simulated according to this assumption,with equal proportions genotyped in each phenotypictail, differences between the results produced by the within QTL genotype. A vector of QTL effects A5[0.1,
methods were minor. The exception to this was when 0.1]9was simulated, with 10% selective genotyping on
a large QTL was segregating and a small percentage of the first trait. LR analyses were carried out, using SAS animals were genotyped. It is under these conditions procedure LOGISTIC to estimatebat the markers, and that the assumptions regarding the distributions of phe-with estimates between the markers interpolated. These notype within unknown genotype become most critical. estimates were then used to calculate the log-likelihood However, although there is little power for any method ratio statistic. Single-trait analyses on the two traits were to accurately estimate such a QTL effect, in practice carried out for comparison. Figure 3 plots the mean this is not a major problem. A more important problem log-likelihood ratio profiles obtained. The log-likeli- is that most QTL effects are too small to be significant. hood ratio for the second trait is lower than for the The situation with very large QTL is that we can tell first trait, on which the selective genotyping was based, that they are big, but we can’t tell how big.
reflecting the loss of power because of selective genotyp- The robustness of the methods to departure from ing on a correlated trait. As in other results reported in
normal error is of interest. The performance of the the literature, the log-likelihood profile for the
multiple-methods appears to depend heavily on the distribution trait analysis is higher than for the single-trait analysis. of the error, the percentage of animals genotyped, and It must be noted that more degrees of freedom are used the relative size of the QTL. When error was generated in fitting the multiple-trait model. from a mixture distribution, the DS method produced
less bias due to selective genotyping, but with ax2-error the MG method and the ML method produced less bias. However, this was only the case for small QTL effects; for larger QTL effects the LR method produced less bias with high levels of selection. It appears that no method is “best” for all circumstances, but all perform reasonably well provided that at least 50% of animals are genotyped. If the data suggest that the distribution of phenotypes is not normal, then the use of data trans-formations might be considered.
If the selection is not simple truncation selection based on phenotype, then methods such as DS become difficult to implement, because of their use of the ex-pected mean of a truncated distribution. The MG method can be applied to this type of data, but the estimates produced appear to be biased, even when all animals are genotyped. The LR method produces ac-ceptable estimates of QTL effect except when QTL
ef-Figure3.—Log-likelihood ratio test profiles from
logistic-regression analysis of multiple-trait data, with single-trait analy- fects are large or selection extreme. The performance of sis of trait 1 (L1), trait 2 (L2), and a multiple-trait analysis the ML method for this type of data was unsatisfactory. (L12). Selective genotyping was applied to trait 1, with 10%
With all animals genotyped the QTL effect was overesti-of animals genotyped. The within-QTL genotype variance was
mated even for small QTL, but with less genotypic infor-1.0, and the within-QTL genotype covariance between the
due to the ratio of QTL genotypes among the animals animals are the F2 generation resulting from a cross between inbred lines, ML methods estimate effects for of unknown genotype. In the likelihood function used
in the simulations (Equation 10), when genotype was the two classes of homozygous animals and a dominance effect. As LR is a method for binary data, it is not possible unknown, a value of 0.5 was coded for the probability
of inheriting each of the sire’s QTL alleles, implying to fit the full model for this type of data directly. How-equal probability of either genotype. With all animals ever, it should be possible to estimate the differences genotyped, almost all of the animals with unknown ge- between two QTL classes, for example, the difference notype carry the same QTL allele, but, when only some between the homozygous classes or the difference be-animals are genotyped, the distribution of QTL alleles tween heterozygous animals and one homozygous class. in the animals of unknown genotype is more balanced. In this case weights should be used, proportional to Probabilities for noninformative markers based on the the probability that the animal has one of the QTL allele frequencies in the dam population could be as- genotypes under consideration.
signed to alleviate this problem; the other methods As with ML interval mapping, it is desirable to account might also benefit from such data preparation. for both linked and unlinked QTL in estimating QTL The DS and MG methods estimate QTL effects as effects and locations. Iterative methods, such as that of functions of means and variances of the data. As such Zeng(1994) should be adaptable to the LR method. If they are quickly and easily computed. However, the cost multiple-trait LR is being performed, then the method of this computational simplicity is reduced generality. is comparable with that ofJiangandZeng(1995). Also, The DS method requires simple truncation selection. as for ML or regression-interval mapping, permutation Two single-trait equations are provided to estimate QTL testing (ChurchillandDoerge1994) will provide sig-effects by the MG method, one applicable when all nificance thresholds that should account for any peculi-genotypes are available and one applicable when selec- arities in the data.
tion has taken place. When the selection is based on The results of the simulation studies presented here other than phenotype, as with noninformative marker are no different from those of earlier studies.Jiangand information, it is not obvious which equation should be Zeng(1995) andKorolet al. (1995) provide convincing
applied. arguments for multiple-trait interval mapping.
Mur-The LR method has more in common with the ML antyandGoffinet(1997) use a bivariate ML analysis method computationally. In practice, the LR proce- as a benchmark against which to compare their approxi-dures in statistical packages may use ML to fit the logis- mation methods for multiple-trait estimation under se-tic curve to the data. Alternatively another iterative lective genotyping. What we have demonstrated here is method, such as weighted least squares, may be used. that using LR, multiple-trait QTL analysis becomes a Therefore there may not be much advantage in comput- straightforward application of standard statistical soft-ing time to ussoft-ing LR. However, LR is a common statisti- ware. The method is applicable regardless of whether cal procedure, and the algorithms for LR in the major selective genotyping was applied. The achievable results statistical packages should be highly optimized. The ma- are comparable to those obtained from the closely re-jor advantage of the LR method over ML is the availabil- lated ML methods, but without the complexity of multi-ity and ease of use of appropriate software. For example, ple-trait ML.
the commands required to estimateband the
log-likeli-J. Henshall was in receipt of a supplementary stipend from the
Co-hood for a two-trait model with SAS procedure LOGIS- operative Research Centre for Cattle and Beef Industry (Meat Quality)
TIC (SAS 1990) are while undertaking this work.
proc logistic; model Q/n5Y Z;
LITERATURE CITED
run; Bink, M. C. A. M., J. A. M. Van ArendonkandR. L. Quaas,1998
Breeding value estimation with incomplete marker data. Genet.
where Q is the marker genotype, coded 0 or 1, n is the Sel. Evol. 30(1): 45–58.
number of trials for each observation (51), and Y and Bovenhuis, H.,andR. J. Spelman,1998 Selective genotyping to detect QTL for multiple traits in outbred populations, pp. 241–
Z are the phenotype records. Additional traits are easily
244 in Proceedings of the 6th World Congress on Genetics Applied to
added. This is in contrast to the complexities of
max-Livestock Production 26, Armidale, New South Wales, Australia. imizing multiple-trait likelihood functions. Churchill, G. A.,andR. W. Doerge,1994 Empirical threshold
values for quantitative trait mapping. Genetics 138: 963–971.
LR can be used for any experimental design
produc-Cox, D. R.,andE. J. Snell,1989 Analysis of Binary Data, Ed. 2. ing markers relating to a mixture of two normal
distribu-Chapman and Hall, London.
tions. This would include backcross designs, where the Darvasi, A.,andM. Soller,1992 Selective genotyping for
determi-nation of linkage between a marker locus and a quantitative
difference between animals heterozygous for the QTL
locus. Theor. Appl. Genet. 85: 353–359.
and animals homozygous for the QTL can be estimated,
Dobson, A. J.,1990 An Introduction to Generalized Linear Models. Chap-and grChap-anddaughter designs, which are essentially half- man and Hall, London.
Haley, C. S.,andS. A. Knott,1992 A simple regression method
for mapping quantitative trait loci in line crosses using flanking tion and estimation of the effect of a quantitative trait locus. Biometrics 53(2): 629–643.
markers. Heredity 69: 315–324.
NAG, 1991 The NAG Fortran Library Manual, Mark 15. The Numerical
Jansen, R. C., D. L. JohnsonandJ. A. M. van Arendonk,1998 A
Algorithms Group Limited, Oxford. mixture model approach to the mapping of quantitative trait loci
SAS, 1990 SAS/STAT User’s Guide, Version 6, Ed. 4. SAS Institute
in complex populations with an application to multiple cattle
Inc., Cary, NC. families. Genetics 148: 391–399.
Soller, M.,1978 The use of loci associated with quantitative traits
Jiang, C.,andZ.-B. Zeng,1995 Multiple trait analysis of genetic
in dairy cattle improvement. Anim. Prod. 27: 133–139. mapping for quantitative trait loci. Genetics 140: 1111–1127.
Stuber, C. W., R. H. Moll, M. M. Goodman, H. E. Schafferand
Korol, A. B., Y. I. RoninandV. M. Kirzhner,1995 Interval mapping
B. S. Weir,1980 Allozyme frequency changes associated with of quantitative trait loci employing correlated trait complexes.
selection for increased grain yield in maize (Zea mays L.). Genetics Genetics 140: 1137–1147.
95:225–236.
Lander, E. S.,andD. Botstein,1989 Mapping Mendelian factors
Stuber, C. W., M. M. GoodmanandR. H. Moll.1982 Improvement underlying quantitative traits using RFLP linkage maps. Genetics
of yield and ear number resulting from selection at allozyme loci
121:185–199.
in a maize population. Crop Sci. 22: 737–740.
Lebowitz, R. J., M. Soller andJ. S. Beckman,1987 Trait-based
Weller, J. I., Y. KashiandM. Soller,1990 Power of daughter and analyses for the detection of linkage between marker loci and
granddaughter designs for determining linkage between marker quantitative trait loci in crosses between inbred lines. Theor.
loci and quantitative trait loci in dairy cattle. J. Dairy Sci. 73: Appl. Genet. 73: 556–562. 2525–2537.
Martinez, O.,andR. N. Curnow,1992 Estimating the locations Weller, J. I., J. Z. Song, Y. I. RoninandA. B. Korol,1997 Designs and the sizes of the effects of quantitative trait loci using flanking and solutions to multiple trait comparisons. Anim. Biotechnol. markers. Theor. Appl. Genet. 85: 480–488. 8(1): 107–122.
Meuwissen, T. H. E.,andM. E. Goddard,1996 The use of genetic Zeng, Z.-B.,1994 Precision mapping of quantitative trait loci. Genet-markers in animal breeding schemes. Genet. Sel. Evol. 28: 161– ics 136: 1457–1468.
176.