DOI:10.15680/IJIRSET.2014.0312070 Copyright to IJIRSET www.ijirset.com
18301
A PROCESS ANALYSIS ASSOCIATED WITH PRODUCTION OF FLOOR
SYSTEMS FOR THEIR ENVIRONMENTAL IMPACTS
Jeffrey M Molavi
1, Peter K Ndungu
2Associate Professor, Department of Technology, University of Maryland Eastern Shore1
Practicing Construction Engineer and Consultant, 2374 Montana Avenue, Cincinnati, OH2
ABSTRACT: The built environment consumes space and natural resources. Natural resources such as sand aggregate are extracted from quarries. These materials are then hauled long distances exerting pressure on transportation systems not to mention harmful emissions from transport equipment. The goal of this study is to determine environmental impacts due to raw materials procurement, fabrication, and installation processes associated with the construction of different floor types. The larger scope of the original study covers comparison of environmental effects due to construction of hypothetical Hollow-Core and Composite Steel Deck floor Systems by conducting a “cradle to gate” Life Cycle Assessment. A hybrid approach, as presented in the methodology, is used to perform the LCA in which Economic Input/output (EIO) and Process-based LCA models are applied to identify impacts of the process. The goal of this paper however, is to demonstrate the process of our methodology associated with extraction and production of the two floor systems.
KEYWORDS:Hollow Core, Steel Deck, LCA, EIO, Environmental Impact, Floor Systems
I. INTRODUCTION AND BACKGROUND
During construction, workers are exposed to a wide range of pollutants and noise. Residents in surrounding areas are subjected to excessive noise and air pollution. In this phase, the main sustainability concern would be to minimize these impacts to the local community and also to reduce waste from the site. One effective way of achieving this is by introducing offsite fabrication in the construction process. Prefabrication not only helps to reduce site activities but also introduces an efficient, safe high quality and fast method of construction. It also allows optimization of the design through computer aided design and manufacture and enables waste to be minimized during the construction process. Prefabrication in construction is discussed in more detail in subsequent sections.
In the building use phase, the biggest impact on sustainability is energy use. According to Burgan and Sansom (2006), the ratio of embodied to operational energy for an air conditioned building with a 60 year lifespan is around 1:10. Designers can therefore help reduce operational energy consumption of buildings by adopting designs that reduce heat losses through the building envelop, reduce cooling and heating loads and by introduction of energy saving measures. At the end of life phase sustainability issues that need to be considered are the reduction of waste when the buildings are demolished. During the demolition, rubble and debris are hauled away and disposed into the sea and sometimes at abandoned quarries. All avenues to recover materials by recycling and reuse should be explored. This helps sustainability in three aspects (Burgan and Sansom 2006):
DOI:10.15680/IJIRSET.2014.0312070 Copyright to IJIRSET www.ijirset.com
18302 I. MATERIALS AND METHODS
A full LCA of a commercial building floor system would include the life cycle stages which consider the material extraction and construction phases. The floor use, maintenance and end of life phases are beyond the scope of this study. Through the use of EIO-LCA and Process analysis model, the full set of activities associated with construction of each floor system is encompassed in our analysis.
Hollow Core Floor Systems
Hollow-core slabs are pre-cast, pre-stressed members that are produced on a long-line bed using an extrusion or slide forming machine. Hollow Core floor units are often referred to as slabs, panels or planks interchangeably. The first term has been adopted in this study. The slabs are designed with continuous longitudinal cores/voids which help to minimize overall weight of slab floor. The voids are roughly 50% concrete compared to standard concrete slab with same thickness. Hollow core slabs are primarily used as floor or roof deck systems, although they can also be applied as wall panels, spandrel members and bridge deck units. Concrete and steel strands are main materials used in hollow core production. Hollo-core slabs are produced with two basic concrete mixes; low slump and normal slump concrete. Water cement ratio for low slump concrete is in the range of 0.4 to 0.45. The philosophy of stand use varies from using many strands sizes to optimize cost for a given project to using only one or two strand sizes for simplicity of inventory and production. The size of strand mostly used is the ½ inch diameter, low relaxation strand. There are about seven major systems used to cast hollow-core slabs (PCI manual 2nd edition 2000). They are patented systems and they all use different casting methods. Table II-1 lists the seven major hollow-core systems along with the basic information on the casting techniques.
TableII-1 Major Hollow-Core Systems (Adopted form PCI)
Manufacture
Machine type
Concrete type/slump
Core
F
orm
Dy‐Core
Extruder
Dry/Low
Tubes
Dynaspan
Slip Form
Wet/Normal
Tubes
Elematic
Extruder
Dry/Low
Auger/Tube
Flexicore
Fixed Form
Wet/Normal
Pneumatic Tubes
Spancrete
Slip Form
Dry/Low
Filler
SpanDeck
Slip Form
Wet/Normal
Aggregates
Ultra‐Span
Extruder
Dry/Low
Augers
Composite Deck Floor Systems
A composite steel deck floor system consists of cold formed structural grade sheet steel that has repeating patterns of parallel ribs and a concrete cover. The sheet steel has embossments rolled into its webs and flanges that act as mechanical connectors to transfer horizontal shear load, resulting in an efficient one way floor system. The interaction between the steel deck and concrete slab differentiates a composite deck floor system from a non-composite deck floor. After installation and adequate fastening, floor deck serves several purposes; acts as a working platform, stabilizes the frame, serves as concrete form for the slab, and reinforces the slab to carry the design loads applied during the life of the building.
DOI:10.15680/IJIRSET.2014.0312070 Copyright to IJIRSET www.ijirset.com
18303
Recycled
Steel
Sheet Metal Rolls
Pig Iron
Metal Deck
Panels
used to connect the floor system to supporting steel beams or trusses (Chien and Ritchie 1984). This helps to achieve composite action between the floor and the supporting steel structural members. Composite deck finishes are either galvanized (zinc coated) or phosphatized (painted). Phosphatized deck has a bare phosphatized top surface which is the side to be in contact with concrete. This bare top surface can be expected to develop rust before concrete is placed. The bottom side of the deck has primer coat of paint. Galvanized deck has a zinc coating on both sides.
Production of Principal Materials
The production process of principle materials used in this study is described here. For hollow-core floor, the principle material is concrete. Likewise sheet metal deck panels and concrete are the principle materials for composite metal deck floor systems. All primary and only important secondary processes are factored in this analysis. Figure II-1 and FigureII-2 represent the flow processes for production of sheet metal and concrete respectively.
Figure II-1 Production of Sheet Metal Decking Panels
Sheet metal deck panels are made by cold forming sheet steel into a repeating pattern of parallel ribs. The strength of the panels is largely as a result of the shape of the ribs and material properties of steel. The deck’s length and width can be varied depending on jobsite conditions. The deck finishing is either galvanized or primer painted. The galvanized deck has zinc coating on both sides while the painted deck has a primer coat at the bottom with the top surface, which is the side to be in contact with concrete, being left bare. The bottom side has a primer coat of paint. After production, panels are banded into bundles of about pounds in weight and then strapped to prevent blowing off during transportation.
Figure II-2 Production of Concrete
DOI:10.15680/IJIRSET.2014.0312070 Copyright to IJIRSET www.ijirset.com
18304 Production of Hollow core plants relies on two basic manufacturing techniques; dry cast or extrusion system, and wet cast system. The dry cast method uses low slump concrete that is forced through an extrusion machine and compacted around tubes that form the cores. On the other hand, wet cast method relies on using high slump concrete with sides being formed either by stationary, fixed forms attached to the machine with the sides being slip formed. The cores in this system are formed with either lightweight aggregate fed through tubes attached to the casting machine, pneumatic tubes anchored in fixed form or long tubes attached to the casting machine which slip-form the cores. Both systems cast slabs in long line beds of about 300-600 ft. long. Slabs are then allowed to cure before being saw-cut to appropriate lengths for the intended project.
Raw Material Extraction
Composite Metal Deck floor system- the raw materials are iron, ore, cement, course and fine aggregate Hollow Core floor system-the raw materials are cement, course and fine aggregate, iron ore and steel. In this overall supply chain of material needs, mineral resource extraction and processing are particularly critical stages for the potential release of solid, liquid, and gaseous emissions due to the significant amounts of energy, water, fuel and chemical agents used.
.
Iron Ore Mining and Production
There are four major stages in the conventional processing of iron; Mining, Iron ore concentration, Blast furnace treatment, and Steel production. The first two processes are done at the mining site while the other two are done at steel plants located elsewhere. Mining of iron ore is accomplished by one of two methods; open pit (strip) or shaft mining. Strip mining is used often for ores near surface. Deep shaft mines are expensive and dangerous but they destroy less of the country side (Sell 1992). The next step is the iron ore concentration. In this step, the iron ore is pulverized and then mixed with water to form slurry. This slurry is then passed near a magnet which separates the iron from the slurry. The ore particles are thus concentrated to about two-thirds iron by weight. The iron is palletized into one inch moist balls, sintered in a furnace and then ship to the steel making plant.
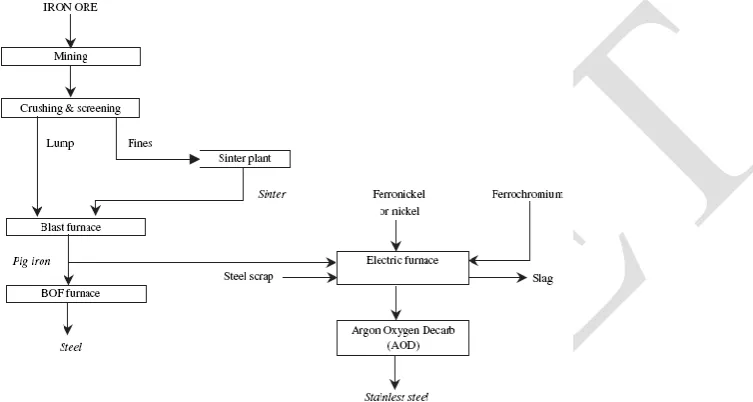
Steel Production
The purpose of steel production is to enhance the strength of the steel by removing impurities and adding desirable materials to form alloys. Steel iron can also be manufactured using scrap iron and scrap steel (Figure II-3). In the steel making process the metal mush undergo several treatment steps: Melting and processing to remove carbons; rolling mill operations; picking; final shaping and finishing. There are four common methods of steel making: 1) open hearth furnace; 2) the basic oxygen process; 3) electric furnaces and; 4) Bessemer convertor.
Production of fine aggregate
Fine aggregates can either be obtained naturally or by manufacturing. Good quality natural sand is readily available in many areas and is the easiest to obtain and process. For manufactured sand, classification equipment is used for gradation as specified. The sand is then processed by washing through water to remove any excess Number 200 fines and deleterious materials. The most commonly used water classifier is a simple dewatering screw which removes excess fines by floating. Gradation can be varied altering the through-put and rate of water flow.
Production of course aggregate
DOI:10.15680/IJIRSET.2014.0312070 Copyright to IJIRSET www.ijirset.com
18305 crushing. This stage helps to reduce the large materials to smaller more manageable sizes by use of Jaw or Gyratory crushers. After primary crushing, the resulting aggregate generally is placed in a large “surge” pile were the aggregate material is fed into a secondary crusher. This is the final step and cone or roll crushers are used in this stage to further reduce the size of aggregate. For quality purposes, the material gradation is improved passing the aggregate through a screen at predetermined feed rates.
FigureII-3 Main Processing routs for steel and stainless steel production (Norgate et al 2007)
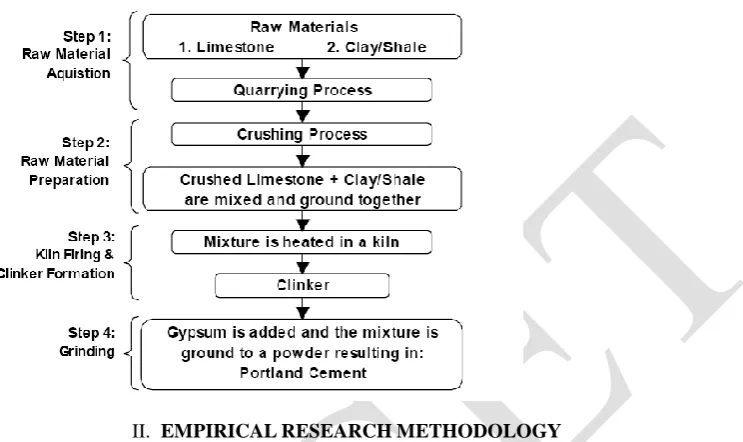
Portland cement Production
Two different processes, "dry" and "wet," are used in the manufacture of cement. In the wet process, the raw materials, properly proportioned, are then ground with water, thoroughly mixed and fed into the kiln in the form of "slurry". In the dry process, raw materials are ground, mixed, and fed to the kiln in a dry state. In other respects, the two processes are essentially alike.
The largest volume raw material, lime, is heated to about 2,700 degrees F in huge cylindrical steel rotary kilns. The finely ground raw material or the slurry is fed into the higher end. At the lower end is a blast of flame, produced by burning of powdered coal, oil or gas under forced draft. As the material moves through the kiln, certain elements are driven off in the form of gases. The remaining elements unite to form a new substance with new physical and chemical characteristics. The new substance, called clinker, is formed in pieces about the size of marbles. The clinker is cooled to a handling temperature and then ground with gypsum and other additives to form Portland cement. See Figure II-4.
Production of concrete
DOI:10.15680/IJIRSET.2014.0312070 Copyright to IJIRSET www.ijirset.com
18306 Figure II-4 Cement production flow chart (Chamberlain et al. 2004)
II. EMPIRICAL RESEARCH METHODOLOGY
Empirical research methods involve the collection and analysis of data with the principal aim of answering specific research questions. These methods can be broadly classified into two categories (Yin 1994):
• Quantitative research methods: these methods involve the collection of numerical data (data in the form of numbers) and analyze it using statistical methods.
• Qualitative research methods: these methods involve the collection of qualitative data (data in the form of text, images, sound) usually collected from observations, interviews and documentary evidence. The data is then analyzed using qualitative data analysis methods. Often, combining qualitative and quantitative research methods may be the most effective in achieving a particular research objective. This combination is referred to as triangulation (Fellows and Lin 2003) and is employed to reduce the disadvantages of each individual approach while leveraging on the advantages of both methods.
Quantitative research
Quantitative research is objective in nature and is concerned with attitudes and large- scale surveys rather than simply with behavior and small-scale surveys (Brannen1992). The most common quantitative methods are:
•
Experiment: Involves testing relationships between identified variables in a laboratory. This is the only method that can demonstrate causal relationships between variables.•
Survey: Involves asking questions through questionnaires or interviews resulting in collection of large amounts of data.•
Historical data: Looks for patterns in historical data e.g. Building design patterns.The main advantage for quantitative methods is that the results usually give more convincing scientific evidence. The downside is that they are generally more difficult to apply in a real world/field setting.
Qualitative research
Qualitative research seeks to gain insights and to understanding people’s perceptions of the world (Fellows and Liu 2003). It consists of detailed descriptions of events, people, interactions and observed behaviors and general opinion. The most common qualitative methods are:
• Case study: observations carried out in a real world setting .The objective is to immerse oneself in the situation and gain a holistic understanding of the phenomena in its natural setting.
DOI:10.15680/IJIRSET.2014.0312070 Copyright to IJIRSET www.ijirset.com
18307 modifying the idea.
One advantage of qualitative research is that it facilitates in-depth study and provides a great understanding of the topic under study. The method also tends to be applied more easily in real world settings. A weakness of this method lies on the fact that it takes a great deal of time to collect data and the analysis requires some degree of interpretation, which may be subjected to bias and subjectivity.
Triangulation
Combining both quantitative and qualitative research methods has proven to be more powerful and effective compared to individual approach (Brannen 1992). In triangulation, both research methods are combined to test a hypothesis. This approach provides a great deal of flexibility to researchers whereby theories can be developed qualitatively and tested quantitatively or vice versa. The main aim of using triangulation method is to improve the reliability and validity of the research outcomes and is the method employed in this study.
EIO-LCA Model
The EIO-LCA takes an aggregate view of sectors producing all of the goods and services in the U.S economy by applying Wasilly Leontief’s (1937) economic Input-Out model. Carnegie Mellon University has used this approach to develop a software program that combines EIO data and environmental impact data to perform life cycle
assessments and determine environmental impacts (Carnegie Mellon University, http://www.eiolca.net). The first step of EIO-LCA is to identify the purchase price of the product or process being studied. The purchase price can either be for a manufactured item such as a car, or for a use item such as fuel for the car. The software then identifies all the supply chain requirements, from material extraction to production of goods and simultaneously computes the environmental discharges. The software does not include impacts for use and disposal of products.
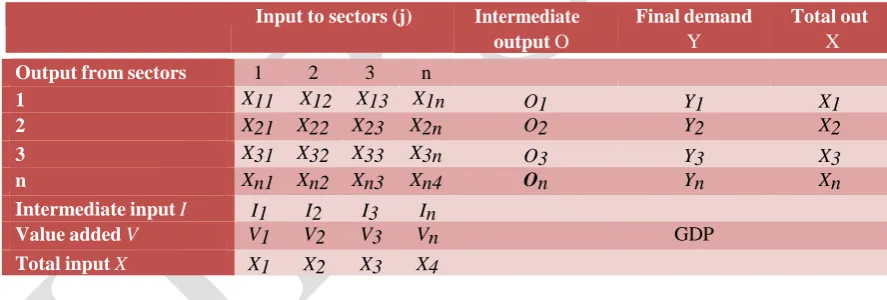
Table III-1 Structure of an Input-output Model
Input to sectors (j) Intermediate output O
Final demand
Y
Total out
X
Output from sectors 1 2 3 n
1 X11 X12 X13 X1n O1 Y1 X1
2 X21 X22 X23 X2n O2 Y2 X2
3 X31 X32 X33 X3n O3 Y3 X3
n Xn1 Xn2 Xn3 Xn4 On Yn Xn
Intermediate input I I1 I2 I3 In
Value added V V1 V2 V3 Vn GDP
Total input X X1 X2 X3 X4
Table III-1 shows the structure of an input-output model. Each entry Xij represents the input to sector j from sector i in the production process. The sum across the rows represents the total output of each sector (Xi) plus the output supplied to final demand by customers. The column sum represents the total amount of inputs to each sector from other sectors. The gross domestic product (GDP) is the sum of all final demands. Algebraically, the vector representation is as follows (Joshi 2000, Hendrickson et al. 2006, Lave et al. 1995):
X= (I+A+A+A²+A³+…) y = (I – A)-1(y) Eq. 1
Where:
x = vector of required inputs
I = Identity matrix.
A = Input-output direct requirement matrix.
DOI:10.15680/IJIRSET.2014.0312070 Copyright to IJIRSET www.ijirset.com
18308 For example, model equation above might be applied in this study to represent the various supply chain requirements for producing Hollow Core Slabs supplied to the building owner. In this equation, the terms represent production of the desired output itself (I * y), contribution from the direct or first level suppliers (A * y), the second level indirect suppliers (A * A * y), etc. The infinite series of the supply chain can be
represented by (I – A)-1 were -1 represents multiplicative inverse (Hendrickson et al. 2002).
This model equation can be therefore be used to compute the total outputs, often referred to as “supply chain”, of a product or service where the “chain” in this case implying a sequence of direct and indirect suppliers (Hendrickson et al. 2006). To explain the difference between direct and indirect suppliers, let us look at a steel framed building. The iron ore miner supplies a blast furnace to make steel, the steel mill supplies a fabricator that in turn ships fabricated steel products to the construction site. The fabricator and steel miller can be referred to as direct and indirect suppliers respectively.
After the economic output for each sector of the economy is computed, another vector representing direct environmental outputs can then be obtained by multiplying the output at each stage by the direct environmental impact per dollar of output (Joshi 2000, Hendrickson et al. 2006, Lave et al. 1995):
bi=Rjx=Rj (I-A)-1(y) Eq.2 Where:
bi = Vector of the environmental burdens.
Rj = Impact per dollar of output for each stage.
Results from these two equations (Eq. 1and Eq. 2) provide a quick and relatively inexpensive way to quantify supply chain impacts of any product purchase.
The software developed by Carnegie Mellon University applies 1997 benchmark industry-by-industry economic input-output model as supplied by the Department of Commerce (Lawson et al. 2002, Hendrickson et al. 2006). All prices should therefore be converted to 1997 dollars before being applied in the model. For example, the conversion from 2002 prices to 1997 prices using the consumer price index (CPI) is accomplished by finding the 2013 CPI value (280) and dividing it by the 1997 value (167.5) to get 1.167. Thus, 2013 prices are on average 40% higher than 1997 prices. The 2013 price is then divided by 1.67 to convert to 1997. Another important factor to consider is that the price applied in the model should be producer price rather than price paid by consumers. The data in the EIO-LCA software is derived from a variety of public data sources such as US-EPA, U.S. Department of Commerce, USCB and OSHA.
In this study we have applied EIO-LCA model in our hybrid model to analyze impacts in the material extraction and production phase. This enables the computation and quantification of energy use and environmental emissions such as carbon dioxide (CO2), carbon monoxide (CO), hydrogen sulfide (H2S), metals, methane (CH4), nitrogen oxides (NOx), volatile organic compounds (VOC), particulate matter, and sulfur dioxide (SO2) in this phase. The main reason for selecting EIO model is because data for individual supply chain processes in this phase is not readily available. The phase is also easy to aggregate and this helps our study due to the complex nature the extraction and production of materials used in this research.
III.CONCLUSION
DOI:10.15680/IJIRSET.2014.0312070 Copyright to IJIRSET www.ijirset.com
18309
References
1. Hendrickson, C., Horvath, A., Joshi, S., Klauser, M., McMichael, C.F., and Lave, L. B. (1997). “Comparing Two Life Cycle Assessment Approaches; A Process Model – vs. Economic Input-Output Based Assessment.” IEEE, Vol. 1, No. 97, 176-181.
2. International Standard ISO 14040. (2004). “Environmental management - Life cycle assessment-Principles and framework.” International Organization for Standardization (ISO). Geneva, Switzerland.
3. International Standard 14041. (2004). “Environmental management- Life cycle assessment-goal and scope definition and inventory analysis.” International Organization for standardization (ISO). Geneva, Switzerland.
4. International Standard ISO 14042. (2004). “Environmental management - life cycle assessment -life cycle impact assessment.” International Organization for standardization (ISO). Geneva, Switzerland.
5. International Standard ISO 14043. (2004). “Environmental management - life cycle assessment -life cycle interpretation.” International Organization for standardization (ISO). Geneva, Switzerland.
6. Joshi S. (2000). “Product environmental life-cycle assessment using input - output techniques.” Journal of Industrial Ecology. Vol. 3, 95– 120.
7. Beheiry, S.M.A., Chong, W.K., and Haas, C.T. (2006). “Examining the Business Impact of Owner Commitment to Sustainability.” Journal of Construction Engineering and Management, Vol. 132, No. 4, 384-392.
8. Burgan, B.A., Sansom, M.R. (2006). “Sustainable Steel Construction.” Journal of Constructional Steel Research, Vol. 62, 1178–1183.
9. Huovila, P. (1999). “On the Way Towards Sustainable Building.” VTT Building Technology, Finland.
10. Song, J., Fagerlund, R.W., Haas, T.C., Tatum, B.C., Vanegas, J.A. (2005). “Considering Pre-work in Industrial Projects.” Journal of Construction Engineering and Management, Vol. 131, No. 6, 723-733.
11. Pasquire, C., Gibb, A., Blismas, N. (2005). “What Should You Really if You Want to Compare Prefabrication with Traditional Construction.” Proceedings, IGLC- 13 - Thirteeth Annual Conference of the International Group for Lean Construction. July, Sydney, Australia.
12. Ofori, G. (2000). “Greening the Construction Supply Chains.” European Journal of Purchasing and Supply Management. Vol. 6, 195-206.
13. Klunder, G. (2001). “Environmental Impact of Dutch Dwellings: Priorities for Reduction and Benefits of Sustainable Construction.”
Towards Sustainable Building, 109-134.
14. Junilla, S., and Saari, A. (1998). “Environmental Burdens of a Finnish Apartment Building by Building elements in the Context of LCA.” Helsinki University of Technology, Helsinki, Finland.
15. Kohler, N., Lutzkendorf, T. (2002). “Integrated Life-Cycle Analysis.” Journal of Building research and Information. Vol. 30, No. 5, 338-348.
16. Russell, B. (1981) Building Systems, Industrialisation and Architecture, Wiley, New York.
ON Road Tucks http://www.epa.gov/ttn/chief/conference/ei11/mobile/mullen.pdf. (Accessed May 20, 2008)
17. USEPA factors for Heavy duty trucks http://www.epa.gov/otaq/models/ap42/ap42-7.pdf. (Accessed May 20, 2008)
18. Norgate, T.E., Jahanshahi, S., Rankin, W.J. (2007). “Assessing the environmental impact of metal production processes.” Journal of Cleaner Production. Vol. 15, 838 - 848.
19. The Steel Construction Institute. (2003). Steel Designers Manual. Second Edition. Blackwell Science Limited, Garsington Road, Oxford.
DOI:10.15680/IJIRSET.2014.0312070 Copyright to IJIRSET www.ijirset.com
18310
21. Standard specs. for slurry grout. www.ksdot.org/burconsmain/specprov/2007/844.pdf. (Accessed May 20, 2008).
22. Hendrickson C.T., Lave, L.B., Mathews, H.S. (2006). Environmental life cycle assessment of goods and services: An Input-output approach. Resources for the future press, Washington D.C.