The structure of the proton: The CT14 QCD global analysis
S. Dulat1,5, T.-J. Hou2, J. Gao3, M. Guzzi4,aJ. Huston5, P. Nadolsky2, J. Pumplin5, C. Schmidt5,
D. Stump5, and C.-P. Yuan5
1School of Physics Science and Technology, Xinjiang University, Urumqi, Xinjiang 830046 China. 2Department of Physics, Southern Methodist University, Dallas, TX 75275-0181, U.S.A.
3High Energy Physics Division, Argonne National Laboratory, Argonne, Illinois 60439, U.S.A. 4The University of Manchester, Oxford Road, M13 9PL Manchester, United Kingdom.
5Department of Physics and Astronomy, Michigan State University, East Lansing, MI 48824 U.S.A.
Abstract. A brief description of the CT14 global analysis of quantum chromodynamics at next-to-next-to leading order (NNLO) from the CTEQ-TEA group is given. Predictions for standard candle processes at the LHC are illustrated together with the main features of the CT14 parton distribution functions.
1 Introduction
Understanding of the structure of the proton is crucial to a multitude of high-energy physics programs at the Large Hadron Collider (LHC). Interpretation of experimental measurements at hadron colliders relies on precise knowledge of fundamental QCD parameters and distribution of proton’s constituent quarks and gluons: the parton distribution functions (PDFs). The LHC Run-1 culminated in the discovery of the Higgs boson [1, 2]. The LHC Run-2 will perform measurements of the Higgs boson properties and of various electroweak (EW) observables with extraordinary accuracy in new kinematic regimes. For both precision measurements and discovery of possible new physics, it is important to have the proper tools for the calculation of the relevant cross sections. These tools include both matrix element determinations at higher orders in perturbative QCD and EW theory, and precision PDFs.
The CT10 parton distribution functions were published at next-to-leading order (NLO) in 2010 [3], followed by the CT10 next-to-next-to leading order (NNLO) parton distribution functions in 2013 [4]. These PDF ensembles were determined using diverse experimental data from fixed-target experi-ments, HERA and the Tevatron collider, but without data from the LHC. The new CT14 global anal-ysis [5] includes data from the LHC for the first time, as well as updated data from the Tevatron and from HERA experiments. Various CT14 PDF sets have been produced at the leading order (LO), NLO and NNLO and are available from LHAPDF [6].
Features of the CT14 analysis. The CT14 PDFs are determined from data on inclusive
high-momentum transfer processes, for which perturbative QCD is expected to be reliable. For example, in the case of deep inelastic lepton scattering, only data withQ>2 GeV andW >3.5 GeV are used.
Data in this region are expected to be relatively free of non-perturbative effects, such as higher twists or nuclear corrections.
For the majority of processes in the CT14 fit, theoretical predictions are included at the NNLO level of accuracy. In particular, a NNLO treatment [7] of heavy-quark mass effects in neutral-current DIS is realized in the ACOT-χscheme [8–10] and is essential for obtaining correct predictions for LHC electroweak cross sections [11, 12]. Measurements for charged-current DIS and inclusive jet production represent the only exception to this rule and are included at NLO only. In both cases, the complete NNLO contributions are not yet available, but it can be argued based on some investigations that the expected effect of missing NNLO effects is small relatively to current experimental errors (see Sec.II in Ref. [5]).
The new LHC measurements [13–15] ofW/Z cross sections directly probe flavor separation of
u andd (anti-)quarks in an x-range around 0.01 that was not directly assessed by the previously
available experiments. The updated measurements of electron charge asymmetry from the DØ col-laboration [16] included in the CT14 analysis probe thedquark PDF atx>0.1. To better estimate
variations in relevant PDF combinations, such asd(x,Q)/u(x,Q) and ¯u(x,Q)/d¯(x,Q), the number of free PDF parameters is increased to 28, compared to 25 in CT10 NNLO.
As another important modification, CT14 employs a novel flexible parametrization for the PDFs, based on the use of Bernstein polynomials (reviewed in the Appendix of Ref. [5]). The shape of the Bernstein polynomials is such that a single polynomial is dominant in each givenxrange, reducing undesirable correlations among the PDF parameters that sometimes occurred in CT10. In the asymp-totic limits ofx→ 0 or x→ 1, the new parametrization forms allow for the possibility of arbitrary constant ratios ofd/uor ¯d/¯u, in contrast to the more constrained behavior assumed in CT10.
The CT14 PDF error sets is obtained using two techniques, the Hessian method [17] and Monte-Carlo sampling [18]. Lagrange multiplier studies [19] have also been used to verify the Hessian uncertainties, especially in regions not well constrained by data. This applies at NNLO and NLO; no error sets are provided at LO due to the difficulty of defining meaningful uncertainties at that order.
A central value ofαs(MZ) of 0.118 has been assumed in the global fits at NLO and NNLO, but PDF sets at alternative values ofαs(mZ) are also provided. CT14 prefersαs(MZ) = 0.115+−00..006004 at
NNLO (0.117±0.005 at NLO) at 90 % confidence level (C.L.). These uncertainties from the global QCD fits are larger than those of the data from LEP and other experiments included into the world average [20]. Thus, the central PDF sets are obtained using the value of 0.118, which is consistent with the world average value and was recommended by the PDF4LHC group [21]. The CT14LO PDFs are provided by supplying two versions, one with a 1-loopαs(MZ) value of 0.130, and the other with a 2-loopαs(MZ) value of 0.118.
2 Results
The CT14 fit has a total of 2947 data points included from 33 experiments, producing χ2 =3252
at the best fit (withχ2/N
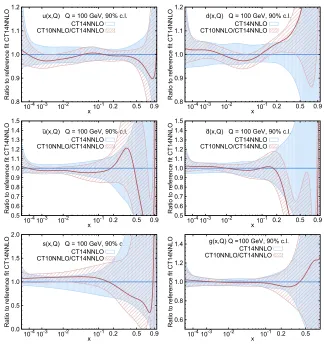
pt = 1.10). The flavor composition of CT14 PDFs has changed somewhat compared to CT10 due to the inclusion of new LHC and Tevatron data sets and to the use of modified parametrization forms. The new PDFs are largely compatible with CT10 within the estimated PDF uncertainty. In Fig. 1 one observes that the CT14 NNLO PDFs have a softer strange-quark distribu-tion at lowxand a somewhat softer gluon at highx, compared to CT10 NNLO. The CT14d-quark has increased by 5% atx ≈ 0.05, after ATLAS and CMS W/Z production data sets at 7 TeV were included. Atx 0.1, the update of the DØ charge asymmetry data set in the electron channel has
reduced the magnitude of thed quark PDFs by a large amount, and has moderately increased the
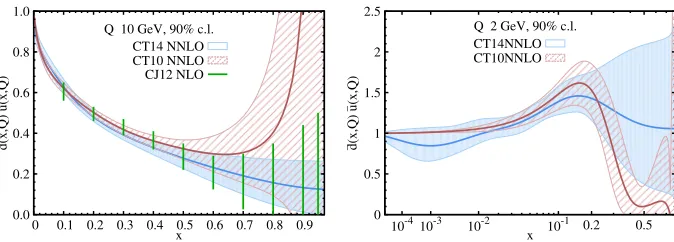
u(x,Q) distribution. Thed/u ratio in Fig. 2 has decreased at highxin comparison to CT10, as a consequence of replacing the 2008 DØ electron charge asymmetry (0.75 fb−1[22]) measurement by
the new 9.7fb−1data set [16]. The
Ratio to reference fit CT14NNLO
x
u(x,Q) Q = 100 GeV, 90% c.l. CT14NNLO CT10NNLO/CT14NNLO
0.8 0.9 1.0 1.1 1.2
10-410-3 10-2 10-1 0.2 0.5 0.9
Ratio to reference fit CT14NNLO
x
d(x,Q) Q = 100 GeV, 90% c.l. CT14NNLO CT10NNLO/CT14NNLO
0.8 0.9 1.0 1.1 1.2
10-410-3 10-2 10-1 0.2 0.5 0.9
Ratio to reference fit CT14NNLO
x –
u(x,Q) Q = 100 GeV, 90% c.l. CT14NNLO CT10NNLO/CT14NNLO
0.5 0.6 0.7 0.8 0.9 1.0 1.1 1.2 1.3 1.4 1.5
10-410-3 10-2 10-1 0.2 0.5 0.9
Ratio to reference fit CT14NNLO
x –
d(x,Q) Q = 100 GeV, 90% c.l. CT14NNLO CT10NNLO/CT14NNLO
0.5 0.6 0.7 0.8 0.9 1.0 1.1 1.2 1.3 1.4 1.5
10-410-3 10-2 10-1 0.2 0.5 0.9
Ratio to reference fit CT14NNLO
x
s(x,Q) Q = 100 GeV, 90% c.l. CT14NNLO CT10NNLO/CT14NNLO
0.0 0.5 1.0 1.5 2.0
10-410-3 10-2 10-1 0.2 0.5 0.9
Ratio to reference fit CT14NNLO
x
g(x,Q) Q =100 GeV, 90% c.l. CT14NNLO CT10NNLO/CT14NNLO
0.6 0.8 1.0 1.2 1.4
10-410-3 10-2 10-1 0.2 0.5
Figure 1. Comparison of 90% C.L. PDF uncertainties from CT14 NNLO (solid blue) and CT10 NNLO (red dashed) error sets. Both error bands are normalized to the respective central CT14 NNLO PDFs.
input physics assumption that bothdvalanduvalbehave as (1−x)a2atx→1 with the same value ofa2 (reflecting expectations from spectator counting rules), but allowing for independent normalizations. The ¯u/d¯ratio has also changed as a consequence of the new data and the new parametrization form. The CTEQ-JLab analysis (CJ12) [23] has independently determined the ratiod/uat NLO, and it is compared to that of CT14 in Fig. 2.
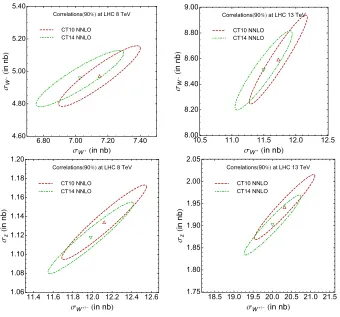
W/Z production cross sections at the LHC. Fig. 3 shows central predictions and 90% C.L.
d(x,Q)
u(x,Q)
x CJ12 NLO Q 10 GeV, 90% c.l.
CT14 NNLO CT10 NNLO
0.0 0.2 0.4 0.6 0.8 1.0
0 0.1 0.2 0.3 0.4 0.5 0.6 0.7 0.8 0.9 –d(x,Q) –u(x,Q)
x Q 2 GeV, 90% c.l. CT14NNLO CT10NNLO
0 0.5 1 1.5 2 2.5
10-410-3 10-2 10-1 0.2 0.5
Figure 2.Comparison of 90% C.L. uncertainties on the ratiosd(x,Q)/u(x,Q) for CT14 NNLO (solid blue) and CT10 NNLO (red dashed), and CJ12NLO (green lines) error ensembles and ¯d(x,Q)/u(x¯ ,Q).
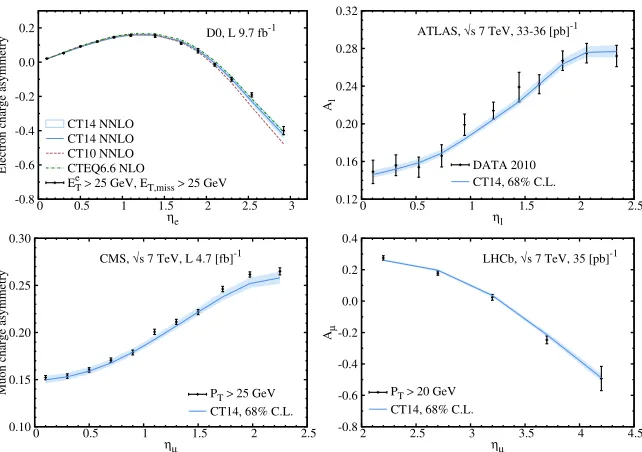
Differential cross sections for production of massive vector bosons set important constraints on the flavor composition of the proton, notably on theuanddquarks, anti-quarks and their ratios. In Fig. 4 CT14 NNLO theoretical predictions for lepton charge asymmetries of inclusiveW±boson production are compared to data measured at the DØ Tevatron Run-2 [16] and ATLAS [13], CMS [14], and LHCb [15] experiments at the LHC 7 TeV. Theoretical predictions are computed using the program ResBos[25–28]. The black data points represent the unshifted central values of the data. The error bars indicate the total (statistical+systematic) experimental error, while the blue band is the CT14 PDF uncertainty evaluated at the 68% C.L. In total, constraints from the LHC and TevatronW/Z
differential cross sections and asymmetries lead to important changes in the quark sector PDFs. At
x0.02, more realistic error bands for theu, ¯u,d, ¯dPDFs are obtained upon including the ATLAS and CMS data sets. Atx > 0.1, the high-luminosity DØ charge asymmetry and other compatible
experiments predict a softer behavior ofd(x,Q)/u(x,Q) than in CT10W.
Compared to CT10, the new inputs and theoretical advancements of the CT14 fit resulted in a slight increase in the large-xgluon (of order 1%). The CT14ggluminosities are compared to those of MMHT2014 [29] and NNPDF3.0 [30] PDFs at 13 TeV in Fig. 5. The parton luminosity is defined as in Ref. [31]. All central values and uncertainty bands agree very well among the three global PDFs, in thexrange sensitive to Higgs production.
Conclusions
Correlations90at LHC 8 TeV
CT10 NNLO CT14 NNLO
6.80 7.00 7.20 7.40 4.60
4.80 5.00 5.20 5.40
ΣWin nb
ΣW
in
nb
Correlations90at LHC 13 TeV
CT10 NNLO CT14 NNLO
10.5 11.0 11.5 12.0 12.5 8.00
8.20 8.40 8.60 8.80 9.00
ΣWin nb
ΣW
in
nb
Correlations90at LHC 8 TeV
CT10 NNLO CT14 NNLO
11.4 11.6 11.8 12.0 12.2 12.4 12.6 1.06
1.08 1.10 1.12 1.14 1.16 1.18 1.20
ΣWin nb
Σz
in
nb
Correlations90at LHC 13 TeV
CT10 NNLO CT14 NNLO
18.5 19.0 19.5 20.0 20.5 21.0 21.5 1.75
1.80 1.85 1.90 1.95 2.00 2.05
ΣWin nb
Σz
in
nb
Figure 3.CT14 and CT10 NNLO 90% C.L. error ellipses forW−andW+cross sections, at the LHC 8 and 13 TeV. andZandW±.
Acknowledgments.
M.G. would like to thank the organizers of the ISMD2015 conference for the kind invitation. This work was supported by the STFC (ST/L000431/1) and by the Lancaster-Manchester-Sheffield Con-sortium for Fundamental Physics under STFC grant ST/L000520/1; by the U.S. DOE Early Career Research Award DE-SC0003870; by the U.S. Department of Energy under Grant No. DE-FG02-96ER40969, DE-SC0013681, and DE-AC02-06CH11357; by the U.S. National Science Foundation under Grant No. PHY-0855561 and PHY-1417326; by Lightner-Sams Foundation; and by the Na-tional Natural Science Foundation of China under Grant No. 11165014 and 11465018.
References
[1] G. Aad et al. (ATLAS), Phys. Lett.B716, 1 (2012),1207.7214
[2] S. Chatrchyan et al. (CMS), Phys. Lett.B716, 30 (2012),1207.7235
Electron
charge
asymmetry
ηe
D0, L 9.7 fb-1
CT14 NNLO CT14 NNLO CT10 NNLO CTEQ6.6 NLO
EeT>25 GeV, ET,miss>25 GeV
-0.8 -0.6 -0.4 -0.2 0.0 0.2
0 0.5 1 1.5 2 2.5 3
Al
ηl
ATLAS,√s 7 TeV, 33-36 [pb]-1
DATA 2010 CT14, 68% C.L. 0.12
0.16 0.20 0.24 0.28 0.32
0 0.5 1 1.5 2 2.5
Muon
charge
asymmetry
ημ
CMS,√s 7 TeV, L 4.7 [fb]-1
PT>25 GeV
CT14, 68% C.L. 0.10
0.15 0.20 0.25 0.30
0 0.5 1 1.5 2 2.5
Aμ
ημ
LHCb,√s 7 TeV, 35 [pb]-1
PT>20 GeV
CT14, 68% C.L. -0.8
-0.6 -0.4 -0.2 0.0 0.2 0.4
2 2.5 3 3.5 4 4.5
Figure 4.Charge asymmetries as a function of lepton pseudorapidity measured by the DØ, ATLAS, CMS, and LHCb Collaborations, compared to the 68% C.L. CT14 NNLO uncertainty band.
[4] J. Gao, M. Guzzi, J. Huston, H.L. Lai, Z. Li, P. Nadolsky, J. Pumplin, D. Stump, C.-P. Yuan, Phys. Rev.D89, 033009 (2014),1302.6246
[5] S. Dulat, T.J. Hou, J. Gao, M. Guzzi, J. Huston, P. Nadolsky, J. Pumplin, C. Schmidt, D. Stump, C.-P. Yuan (2015),1506.07443
[6] https://lhapdf.hepforge.org/
[7] M. Guzzi, P.M. Nadolsky, H.L. Lai, C.-P. Yuan, Phys. Rev.D86, 053005 (2012),1108.5112
[8] M.A.G. Aivazis, J.C. Collins, F.I. Olness, W.-K. Tung, Phys. Rev. D50, 3102 (1994),
hep-ph/9312319
[9] J.C. Collins, Phys. Rev.D58, 094002 (1998),hep-ph/9806259
[10] W.-K. Tung, S. Kretzer, C. Schmidt, J. Phys.G28, 983 (2002),hep-ph/0110247
[11] W.-K. Tung, H.L. Lai, A. Belyaev, J. Pumplin, D. Stump, C.-P. Yuan, JHEP02, 053 (2007),
hep-ph/0611254
[12] P.M. Nadolsky, H.L. Lai, Q.H. Cao, J. Huston, J. Pumplin, D. Stump, W.-K. Tung, C.-P. Yuan, Phys. Rev.D78, 013004 (2008),0802.0007
[13] G. Aad et al. (ATLAS), Phys. Rev.D85, 072004 (2012),1109.5141
[14] S. Chatrchyan et al. (CMS), Phys. Rev.D90, 032004 (2014),1312.6283
[15] R. Aaij et al. (LHCb), JHEP06, 058 (2012),1204.1620
[16] V.M. Abazov et al. (D0), Phys. Rev. D91, 032007 (2015), [Erratum: Phys. Rev.D91,no.7,079901(2015)],1412.2862
[17] J. Pumplin, D. Stump, R. Brock, D. Casey, J. Huston, J. Kalk, H.L. Lai, W.-K. Tung, Phys. Rev. D65, 014013 (2001),hep-ph/0101032
CT14 NNLO MMHT'14 NNLO NNPDF3 .0 NNLO
10 50 100 500 1000 0.8
0.9 1.0 1.1 1.2 1.3
MX, GeV
Ratio
to
CT14
NNLO
Gluongluon luminosity, s8 TeV , 68c.l.
CT14 NNLO MMHT'14 NNLO NNPDF3 .0 NNLO
10 50 100 500 1000 0.8
0.9 1.0 1.1 1.2 1.3
MX, GeV
Ratio
to
CT14
NNLO
Gluongluon luminosity, s13 TeV , 68c.l.
Figure 5.TheggPDF luminosities for CT14, MMHT2014 and NNPDF3.0 PDFs at the LHC with √s=8 and 13 TeV, withαs(MZ)=0.118.
[19] D. Stump, J. Pumplin, R. Brock, D. Casey, J. Huston, J. Kalk, H.L. Lai, W.-K. Tung, Phys. Rev. D65, 014012 (2001),hep-ph/0101051
[20] K.A. Olive et al. (Particle Data Group), Chin. Phys.C38, 090001 (2014) [21] S. Alekhin et al. (2011),1101.0536
[22] V.M. Abazov et al. (D0), Phys. Rev. Lett.101, 211801 (2008),0807.3367
[23] J. Owens, A. Accardi, W. Melnitchouk, Phys.Rev.D87, 094012 (2013),1212.1702
[24] S. Chatrchyan et al. (CMS), Phys. Rev. Lett.112, 191802 (2014),1402.0923
[25] C. Balazs, J.w. Qiu, C.-P. Yuan, Phys. Lett.B355, 548 (1995),hep-ph/9505203
[26] C. Balazs, C.-P. Yuan, Phys. Rev.D56, 5558 (1997),hep-ph/9704258
[27] F. Landry, R. Brock, P.M. Nadolsky, C.-P. Yuan, Phys. Rev. D67, 073016 (2003),
hep-ph/0212159
[28] M. Guzzi, P.M. Nadolsky, B. Wang, Phys. Rev.D90, 014030 (2014),1309.1393
[29] L.A. Harland-Lang, A.D. Martin, P. Motylinski, R.S. Thorne, Eur. Phys. J.C75, 204 (2015),
1412.3989
[30] R.D. Ball et al. (NNPDF), JHEP04, 040 (2015),1410.8849
[31] J.M. Campbell, J.W. Huston, W.J. Stirling, Rept. Prog. Phys.70, 89 (2007),hep-ph/0611148
[32] J. Pumplin, D.R. Stump, J. Huston, H.L. Lai, P.M. Nadolsky, W.-K. Tung, JHEP07, 012 (2002),
hep-ph/0201195