Article
Application of Biochar to the Remediation of
Pb-Contaminated Solutions
Maria Rosaria Boni 1, Agostina Chiavola 1 and Simone Marzeddu 1,*
1 Sapienza University of Rome, Faculty of Civil and Industrial Engineering, Department of Civil,
Constructional and Environmental Engineering (DICEA), Via Eudossiana 18, Zip code 00184, Rome, Italy; * Correspondence: simone.marzeddu@uniroma1.it; Tel.: +39-06-44585514
Abstract: The BIOTON® biochar, produced by a wood biomass pyrolysis process, usually applied as a soil amendment, was investigated for a novel application, i.e. the adsorption of lead from contaminated solutions. The experimental activity firstly included the physical-chemical characterization of BIOTON®; SEM images were also obtained to highlight its internal structure. The adsorption process was investigated through batch and column experiments. Adsorption kinetics showed a very rapid achievement of the equilibrium conditions, i.e. at 2h and 4h for 50 mg/L and 100 mg/L initial Pb concentration, respectively. Complete removal also occurred within the same time.
The Brunauer–Emmett–Teller model better fitted the equilibrium data for both Pb concentrations, whereas the kinetics were best represented by the pseudo second order model.
The column tests showed that the addition of biochar as adsorbent media within the bed significantly extended the time of breakthrough and exhaustion, with respect to the column filled with soil only. The adsorption capacities of BIOTON® versus lead solutions was found to be comparable to that reported for commercial adsorbents. Therefore, BIOTON® can be considered a valid option, with the additional benefit to reduce the environmental impact since allows to recover a residue which alternately would need to be disposed of.
Keywords: Adsorption; Batch; Biochar; Column; Lead; Remediation
1. Introduction
Biochar obtained from the pyrolysis of woody biomass can be used for a number of purposes, among which as soil amendment [1–4] and low cost adsorbent [5–10]. As far as the former application is concerned, biochar has demonstrated to be able to improve soil properties [11–17] as
well as to reduce contaminant leaching [18–23]. As adsorbent, it represents a more economically and environmentally sustainable alternative to commercial media because its use allows to avoid
industrial activities for adsorbent production as well as to reuse a waste that alternatively would need to be disposed of.
As adsorbent, biochar can be applied to water and wastewater treatment, for a wide range of pollutants such as lead arsenic, copper, cadmium, chromium, mercury, zinc and nickel [10,24–26].
Lead is in the list of dangerous substances as indicated by the ATSDR [27]. Due to the associated risks, Italian legislation requires Pb concentration to be below 10 μg/L in groundwater (Italian decree n. 152/06) and 0.2 mg/L in the streams released into surface waters [28].
High levels of heavy metals, and particularly of Pb, in soil and water occur worldwide in many countries. Several are the sources of this contamination, such as the improper application of
industrial processes or the deposition of old lead-containing fuels on soil. Due to the harmful consequences on human health, it is mandatory to avoid lead-contaminated soils and waters to enter
in the food chain.
Several technologies have been developed to intercept lead and prevent it from spreading into
the environment. For instance, there are some substances, such as biochar, which can be applied to contaminated soils to reduce metals mobilization. Indeed, heavy metals become bound to carbonates
and organic matter after biochar incorporation, which enhances the adsorption process due to metals building bonds with oxygen, carbon and nitrogen containing functional groups [21,29,30]. In addition, the high pH, CEC, microporous structure and excess of soluble salts on the biochar surface
increase the heavy metal immobilization through precipitation and surface adsorption [21,31,32]. Biochar is a substance that derives from the pyrolysis of selected plant biomass [33,34].
Currently, it is mainly used as a soil improver; however, its adsorbent properties suggest to use it also for metal sequestering, thus reducing its mobility and danger. For instance, it has been
demonstrated that by applying biochar on soil, pH can be effectively modified and metal solubilization be prevented [35–37].
Biochar has been investigated also as adsorbent for remediating water contaminated by heavy metals [5,7,10,38–43]. Quality and properties of biochar depend on many factors [23]; it is essential to
identify characteristics of this adsorbent to predict its effectiveness towards the target contaminant. Many biochars have a high adsorption capacity for metal contaminants because of the high heterogeneous specific surface [44] and the well-distributed pore network that includes micropores
(<2 nm), mesopores (2- 50 nm) and macropores (> 50 nm) [45].
In the present study, a biochar produced in Italy as a soil improver was investigated for a
different application, i.e. adsorption of lead from aqueous solution. Kinetics and uptake capacity were evaluated through batch tests, using two contaminated solutions, at 50 and 100 mg/L Pb,
respectively. Furthermore, column tests were conducted and breakthrough curves determined using lab-scale plants filled with the same biochar and fed by a solution at 100 mg/L Pb.
It is noteworthy that this is the first application of the examined biochar as adsorbent, particularly in a column plant, for lead removal from aqueous solution.
2. Materials and Methods
2.1. Biochar
BIOTON®, supplied by the LATERIZI REATO s.r.l., was the biochar used in the present
experimentation; it is produced by a wood biomass pyrolysis process, at a temperature below 750 °C, in a controlled atmosphere with low oxygen content. Due to process issues, semi-decorticated and large-sized wood are used, in particular poplar, oak, robinia, platanus, willow, apple and pear
wood; not resinous like fir, larch, pine or conifers can be used. The biochar has a capacity of imbibition above 250% by volume, a specific weight ranging from 0.125 to 0.150, evaluated on the
anhydrous product after the production process with a humidity less than 7%.
The Company who provided the biochar developed the technology for the extraction of syngas
from biomass: this consists of an open-core downdraft pyrolyser with continuous feeding equicurrent, without water scrubber and with a high temperature filtration and separation system.
2.2 Analytical methods
Lead concentrations were determined using a Perkin Elmer atomic absorption spectrophotometer with flame atomization (F-AAS) (Perkin-Elmer model 3030B), whose detection
The biochar was chemically and physically characterized using the procedures described in the literature [47–49]. Particularly, the following parameters were determined on representative samples
of biochar: bulk density, field capacity, porosity, moisture content, ash content, pH and pH point of zero charge. Biochar samples were also analysed using a HR FESEM Zeiss Auriga (SEM; Rome, Italy) at 3000x magnification and 10kV acceleration voltages, to provide the elemental analysis of the
surface (EDX) and to obtain a qualitative indication of the major components present in the material.
2.3 Chemical solutions
Lead solutions were prepared by adding a known amount of lead nitrate salt (supplied by
Carlo Erba) into ultrapure water in order to have final concentrations of 50 and 100 mg/L. All reagents were of analytical grade and used without further purification.
2.4. Batch tests
Batch experiments were carried out using the jar-tester apparatus to determine the kinetic
characteristics and the isotherms of the adsorption process of lead onto the BIOTON® biochar. The experiments were conducted at 50 and 100 mg/L of lead as initial concentrations. These values were
selected being very high and far above the limits posed by the Italian legislation (10 µg/L for groundwater and 0.2 mg/L for release into surface waters), in order to test the adsorption capacity of the media under severe conditions, as also reported by other studies [40]. In the batch tests, 1.25 of
biochar were added to 250 mL of Pb-contaminated solution, and maintained under mixing conditions for 6 h, at 120 rpm constant stirring speed, taking samples at different times: particularly
at 5, 15, 30, 45 and 60 min in the first hour, and afterwards at 1 hour interval time until the end of the tests.
Through the above batch tests it was possible to determine the equilibrium time of the adsorption process. The kinetics data were analyzed using the following models: zero, first, second,
saturation, pseudo-first and pseudo-second order. The best fitting model between the experimental and the modelled data was determined based on the value of the regression coefficient, R2.
Further batch tests were conducted with the aim to obtain the isotherms. To this purpose, different adsorbents dosages of BIOTON® were added to 250 mL solution (at 50 and 100 mg/L Pb
concentration) and maintained under mixing conditions for a duration equal to the equilibrium time previously determined.
At the end of the tests, liquid samples were collected and analysed for the residual Pb
concentration in the solution. The equilibrium data were fitted by the Langmuir, Freundlich and BET isotherms models [50–52]. The best fitting model was determined based on the value of R2.
Lead percentage removal (R%), lead adsorbed per unit weight of adsorbent at time t (qt) and at the equilibrium time (qe), were calculated using the following equations (1, 2 and 3, respectively),
obtained through the mass balance of lead between the liquid and the solid phases [53]:
( ) (1)
( ) (2)
where V is the volume of the aqueous solution, m is the mass of BIOTON®, C0 (equal to 50 and
100 mg/L Pb, respectively), Ct and Ce indicate lead concentration in the liquid phase at time t=0, t and at equilibrium, respectively. Batch experiments were conducted in duplicate and the results obtained averaged.
2.5. Column tests
Biochar characteristics as adsorbent medium in a column plant were investigated using a lab-scale apparatus. These tests were performed following the procedures outlined in a previous
paper by the same authors [54].
Laboratory columns were 18 cm high and 1 cm diameter.
The columns were filled by alternating layers of sand, biochar and soil. Particularly, a previously sterilized quartz sand was placed on the bottom; a layer of BIOTON® (mass of 0.5 g) was
posed above, followed on the top by 1 g of agricultural soil (made by 29% clay, 28% silt, 43% sand and 2% organic matter, by weight).
Particle sizes smaller than 2 mm were chosen for biochar and sand, in order to limit by-pass phenomena along the column walls [55,56]. One more column, filled by soil only, was operated
under the same conditions as a control.
The lead contaminated solution, at a concentration C0=100 mg/L, was continuously fed to the
top of the columns through peristaltic pumps, at 60 mL/h flow rate. This high concentration for lead was chosen to test the biochar adsorbent characteristics under severe conditions and to obtain a rapid development of the breakthrough curve.
Volumes of eluate were collected from the bottom of the columns at prefixed times and analyzed for the residual Pb concentration. Breakthrough curves were determined by recording Pb
concentration in the eluate versus cumulative solution volumes fed to the columns. These curves allowed to determine the breakpoint and saturation times, which represent the time when the Pb
concentration in the eluate, C, starts to rise above 0 and when reaches the value in the influent, i.e. C0, respectively. The experimental data of the column tests were fitted using Yoon–Nelson [57],
Thomas [58] and Bohart–Adams [59] models [60,61].
3.1. Biochar characterization
Initial characterization of BIOTON® provided the main physical and chemical properties as listed in Table 1. In brackets are reported the references of the analytical method or the type of
analytical equipment used for the characterization.
Table 1.Main physical and chemical properties of BIOTON® (% on dry weight).
Physical and chemical properties
Symbol Unit Values Methods and instruments
Bulk density γs g/cm3 1.98 [47,48]
Specific weight γd g/cm3 0.235 [47,48]
Field capacity ωc g in 100 g 650 [47,48]
Porosity N % 88.14 [47,48]
Carbon C % 89.25 Zeiss Auriga
Oxygen O % 7.46 Zeiss Auriga
Potassium K % 1.22 Zeiss Auriga
Calcium Ca % 1.01 Zeiss Auriga
Magnesium Mg 0.37 Zeiss Auriga
Silicon Si 0.26 Zeiss Auriga
Sodium Na 0.20 Zeiss Auriga
Moisture content ω % 29.11 [47,48]
Ash content cc % 60.91 [47,48]
Potential of Hydrogen pH - 10.4 [47,48]
Point of zero charge pHPZC - 10.5 [62]
Values of Table 1 of elemental analysis were obtained by the technical sheet of biochar, while the other parameters were determined experimentally. Carbon and oxygen contents were similar to those reported by [49] and [14], for pyrolysis of different feedstocks conducted at 700°C and 600°C, respectively. The ash content, found to be about 60%, was probably due to the high pyrolysis temperature (700°C). In a recent study, it was observed an ash content of about 40% at a pyrolysis temperature of 500 °C [63]. In the same paper, the value reported for pHPZC is equal to that found in the present study, i.e. 10.5.
Figure 1. Scanning Electron Microscope (SEM) images of the surface and image and colour coded SEM/EDX dot maps of BIOTON®.
Particularly, (A) highlights the particle size, (B) the differents feedstocks used for biochar production, (C) the trasversal cut cross-section and (D) the internal pores. Figure 1 shows also, below the SEM images, the elemental maps of Carbon, Oxygen, Potassium, Calcium, Silicon, Magnesium and Sodium, whose % content is reported in Table 1: amber colour is used for carbon, aquamarine for oxygen, magenta for potassium, dark violet for calcium, green yellow for silicon, red for magnesium and green for sodium.
1
A
D
C
3.2. Batch tests
Figure 2 shows lead percentage removal versus time in the batch tests conducted at concentrations of 50 mg/L and 100 mg/L Pb. The removal shows a common profile at these
concentrations: a rapid rate occurring in the first hour, which is followed by a much slower phase that reaches equilibria in about 2h and 4h at 50 and 100 mg/L, respectively. Negligible variations are
observed afterwards. This result is consistent with the scientific literature: in [64], it is reported a similar profile of adsorption of Pb at the same initial concentration onto biochar from pyrolysis of pig and cow manure at 400°C and 600°C, although at a slower rate (equilibria is reached after 5h).
Another study [65] indicates equilibrium times after about 4h and 30 min for the adsorption of 50 mg/L Pb onto biochar made by a mixture of wood chips, green waste, rice hull, corn cob, nut shells
and husks, cotton gin trash and pomace. Therefore, different feedstocks for biochar production give rise to change in the equilibrium time of the adsorption process of lead on this adsorbent.
The first removal phase can be attributed to a rapid occupation of the more easily accessible external surface sorption sites, while the slower phase can be related to the formation of inner layer
complexes after saturation of outer sorption sites [64].
The linearized form of the equation of different kinetic models was used to find out the best
fitting of the experimental data. The pseudo-second order model provided the best agreement for both Pb concentrations (higher R2 value) [53]. Figure 3 shows the experimental and the modelled
data in terms of t/qt versus t. Through the slope and intercept of the regression line, it was possible to determine the values of the pseudo second-order rate constant, ks, and of the amount of Pb adsorbed at equilibrium per unit weight of BIOTON®, qe, which are shown in Table 2. The same table reports
also the value of qe,exp which represents the value of q experimentally calculated at t=300 min, assumed to be the equilibrium time. It can be noted that the experimental and the modelled data do
not differ appreciably at both 50 mg/L and 100 mg/L Pb.
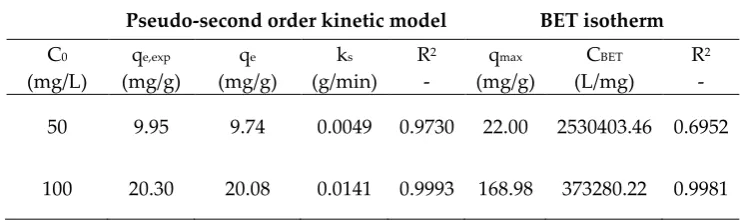
Table 2.Pseudo second order kinetic model and adsorption BET isotherm parameters.
Pseudo-second order kinetic model BET isotherm
C0 qe,exp qe ks R2 qmax CBET R2
(mg/L) (mg/g) (mg/g) (g/min) - (mg/g) (L/mg) -
50 9.95 9.74 0.0049 0.9730 22.00 2530403.46 0.6952
100 20.30 20.08 0.0141 0.9993 168.98 373280.22 0.9981
Pseudo-second-order equation assumes that the rate of occupation of adsorption sites is proportional to the square of the number of unoccupied activated sites on the surface of the adsorbent [53].
It can be noted that the specific adsorption capacity, qe, increases more than double as the Pb concentration rises from 50 to 100 mg/L.
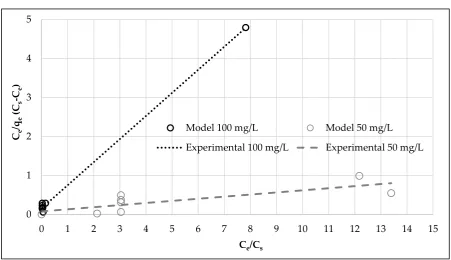
Equilibrium data were best fitted by the BET isotherm model for both contaminated solutions (higher R2). BET isotherm represents an extension of the Langmuir model to the case of
Table 2 shows the values of the BET parameters, i.e. CBET which is a constant linked to the energy of interaction between solute and adsorbent, Cs representing the solute saturation
concentration, and qmax which indicates the amount of adsorbate per unit mass of adsorbent at equilibrium, corresponding to a complete monomolecular layer of adsorbate on the surface of the adsorbent. Figure 4 shows the plots of Ce/qe(Cs-Ce) versus Ce/Cs, at both Pb concentrations.
Figure 2.Lead percentage removal versus contact time.
Figure 3. Experimental data and modelling by the linearized pseudo-second order kinetic equation. 0
10 20 30 40 50 60 70 80 90 100
0 1 2 3 4 5 6
R
e
mova
l(
%)
Time (h)
100 mg/L Pb 50 mg/L Pb
0 5 10 15 20 25 30 35 40 45
0 60 120 180 240 300 360
t/qt
Time (min)
Model 50 mg/l Model 100 mg/l
Figure 4.Isotherm experimental data and modelling by the linearized BET equation.
Table 2 highlights the good agreement of the model with the experimental data obtained at 100 mg/L Pb. By contrast, the BET fitting was not as good for the solution at 50 mg/L; however, BET
model still provided a better fitting than Langmuir and Freundlich isotherms (R2 = 0.4501 and R2 = 0.2780, respectively).
In terms of implementation at full-scale, adsorbent with the highest value of the maximum adsorption capacity, qmax, is the most desirable. The values found in the present study for BIOTON® are within the ranges reported by the literature [7,38] for different biochars and Pb removal from
water [7,67–72]. [73], applying hydrochar produced from peanut hull to initial Pb concentration of 50 mg/L, found a value of the maximum lead sorption capacity very similar to that of the present study
(i.e., 22.82 mg/g and 22.00 mg/g, respectively). By contrast, using biochar derived from anaerobically digested sugarcane bagasse and an initial Pb concentration of 100 mg/L, it was found a lower value,
i.e., 135.48 mg/g with respect to 168.98 mg/g, found in this work [67]. The differences are likely due to the change in the operating conditions of the process (pyrolysis versus hydrothermal
carbonization) which are known to affect the porosity and microstructure of the adsorbents [73]. The ability of BIOTON® to remove lead as a function of the adsorbent mass is shown in Figure 5.
0 1 2 3 4 5
0 1 2 3 4 5 6 7 8 9 10 11 12 13 14 15
Ce /qe
(C
s
-C
e
)
Ce/Cs
Model 100 mg/L Model 50 mg/L
Figure 5.Percentage of lead removal in both contaminated solutions versus different BIOTON® dosage.
Figure 5 shows that removal percentage increases rapidly rising the dosage: R%=100% is reached for 0.5 g/L and 1 g/L BIOTON®, at 50 mg/L and 100 mg/L Pb concentrations, respectively.
Above this dosage, further increases do not determine any appreciable improvement of R%.
With respect to the existing Italian legislation (which sets Pb maximum allowable concentration
for release into surface waters at 0.2 mg/L, respectively), these results indicate that a dosage of 1 g/L of BIOTON® would be able to reduce contamination below this limit at both initial concentrations of lead of 50 and 100 mg/L.
3.3. Column tests
Figure 6 shows the breakthrough curves obtained through the column tests. They are plotted e in terms of the percentage of Pb concentration in the eluate with respect to the feeding concentration, C/C0, versus time of operation of the column plant filled with soil only and soil and BIOTON®,
respectively.
The Figure 6 shows also two horizontal lines drawn at C/C0=5% and C/C0=95%, assumed to
represent the breakthrough and the exhaustion conditions, respectively.
The breakthrough curves obtained for soil and soil and biochar have approximately the same
shape: a rapid increase of C/C0 after breakthrough, followed by a trend at a much slower rate towards the exhaustion.
0% 10% 20% 30% 40% 50% 60% 70% 80% 90% 100% 110%
0 0.5 1 1.5 2 2.5 3 3.5 4 4.5 5 5.5 6 6.5 7 7.5 8 8.5 9 9.5 10 R%
Dosage (g/L)
Figure 6.Breakthrough curves for adsorption of Pb onto soil and soil and BIOTON®.
It is noteworthy that, although the same shape, in the column filled with soil only breakthrough is reached more rapidly (about 2h versus 10h). Therefore, the presence of BIOTON® enhanced
significantly adsorption capacity of the column plant.
None reference could be found in the specialized literature on the application of biochar as
adsorbent media in a column plant for lead removal from water. Therefore, these data could not be evaluated in comparison with other experimental studies.
By integrating the breakthrough curve between t=0 and t=50 h (end of the column tests), it was
possible to determine the experimental value of the adsorption capacity, which resulted to be qexp=177.80 mg/g for the column filled with soil and BIOTON®. This value takes into account the
capacity of both media, which contributed for 67.07 mg/g and for 110.73 mg/g for soil and BIOTON®, respectively.
Among the three mathematical models applied, the Thomas model showed to better describe the experimental breakthrough curves [58] (R2=0.76) as compared to Yoon–Nelson (R2=0.60) [57] and
Bohart–Adams (R2=0.61) [59]. The Thomas rate constant (kTH) and the adsorption capacity (q0) were obtained from the linearized form of the model equation, by plotting ln(C0/C-1) versus t (not here shown) e determining the intercept and the slope of the regression line. The values found were: kTH
=4.10x10⁻⁵ mL/min∙mg and q0=270.57 mg/g.
This value is much higher than qexp: the difference indicates that the media did not reach the
exhaustion condition at the end of the tests, i.e. at t=50h, and therefore it still possessed adsorption sites to be occupied by the adsorbate. It is worth noting that in continuous flow column plant it is
expected an adsorption capacity higher than that measured under batch conditions due to the higher driving force of the process.
Furthermore, very similar values to q0 are found in the specialized literature for the maximum adsorption capacity of Pb by column plants filled with adsorbents other than biochar [7,67–72].
0% 10% 20% 30% 40% 50% 60% 70% 80% 90% 100%
0 5 10 15 20 25 30 35 40 45 50
C/C0
(%)
Time (h)
Soil
4. Discussion
BIOTON® biochar produced from various wood biomasses through a pyrolysis process showed to be highly efficient as adsorbent for lead contaminated solutions at 50 mg/L and 100 mg/L.
The BET isotherm provided the best agreement of the experimental data of equilibrium, with the BET constants and the maximum adsorption capacity equal to: CBET=2530403.46 L/mg and
qmax=22.00 mg/g at 50 mg/L Pb; CBET=373280.22 L/mg and qmax=168.98 mg/g at 100 mg/L Pb.
The better kinetic model was found to be the pseudo-second order at both concentrations, with ks=0.0049 g/min and ks=0.141 g/min, respectively.
The column tests showed a significant extension of the breakthrough and exhaustion times in the plant filled with soil and biochar with respect to the plant filled with soil only. The Thomas
model provided the best agreement of the experimental data, with the constant kTH =4.10x10⁻⁵ mL/min∙mg. The maximum adsorption capacity predicted by the model was found to be q0=270.57
mg/g, which is similar to the values of commercial adsorbent in column plants reported by the literature for the adsorption of lead.
These results highlight that the use of BIOTON® as an adsorbent represents a valid option: beside the high adsorption efficiency, its use could also lead to a reduction of the vegetable waste to
be disposed of and contribute to the virtuous cycle of waste recovery and reuse.
Further studies should be conducted to obtain a deeper characterization of BIOTON®
properties; besides, it should be evaluated the adsorption capacity in the presence of multicontaminants solutions as occurring in many real cases.
Acknowledgments: Authors wish to thank LATERIZI REATO S.r.l. who provided BIOTON® biochar.
Conflicts of Interest: The authors declare no conflict of interest.
References
1. Xie, T.; Reddy, K.R.; Wang, C.; Yargicoglu, E.; Spokas, K. Characteristics and applications of biochar for
environmental remediation: A review. Crit. Rev. Environ. Sci. Technol. 2015, 45, 939–969,
doi:10.1080/10643389.2014.924180.
2. Agegnehu, G.; Bass, A.M.; Nelson, P.N.; Bird, M.I. Benefits of biochar, compost and biochar-compost for
soil quality, maize yield and greenhouse gas emissions in a tropical agricultural soil. Sci. Total Environ.
2016, 543, 295–306, doi:10.1016/j.scitotenv.2015.11.054.
3. Qian, K.; Kumar, A.; Zhang, H.; Bellmer, D.; Huhnke, R. Recent advances in utilization of biochar.
Renew. Sustain. Energy Rev. 2015, 42, 1055–1064, doi:10.1016/j.rser.2014.10.074.
4. Lehmann, J.; Joseph, S. Biochar for environmental management : An introduction. Biochar Environ.
Manag. - Sci. Technol. 2009, 1, 1–12, doi:10.1016/j.forpol.2009.07.001.
5. Ahmad, M.; Rajapaksha, A.U.; Lim, J.E.; Zhang, M.; Bolan, N.; Mohan, D.; Vithanage, M.; Lee, S.S.; Ok,
Y.S. Biochar as a sorbent for contaminant management in soil and water: A review. Chemosphere 2014,
99, 19–23, doi:10.1016/j.chemosphere.2013.10.071.
6. Cha, J.S.; Park, S.H.; Jung, S.C.; Ryu, C.; Jeon, J.K.; Shin, M.C.; Park, Y.K. Production and utilization of
biochar: A review. J. Ind. Eng. Chem. 2016, 40, 1–15, doi:10.1016/j.jiec.2016.06.002.
7. Inyang, M.I.; Gao, B.; Yao, Y.; Xue, Y.; Zimmerman, A.; Mosa, A.; Pullammanappallil, P.; Ok, Y.S.; Cao,
X. A review of biochar as a low-cost adsorbent for aqueous heavy metal removal. Crit. Rev. Environ. Sci.
8. Gwenzi, W.; Chaukura, N.; Noubactep, C.; Mukome, F.N.D. Biochar-based water treatment systems as
a potential low-cost and sustainable technology for clean water provision. J. Environ. Manage. 2017, 197,
732–749, doi:10.1016/j.jenvman.2017.03.087.
9. Rosales, E.; Meijide, J.; Pazos, M.; Sanromán, M.A. Challenges and recent advances in biochar as
low-cost biosorbent: From batch assays to continuous-flow systems. Bioresour. Technol. 2017, 246, 176–
192, doi:10.1016/j.biortech.2017.06.084.
10. De Gisi, S.; Lofrano, G.; Grassi, M.; Notarnicola, M. Characteristics and adsorption capacities of
low-cost sorbents for wastewater treatment: A review. Sustain. Mater. Technol. 2016, 9, 10–40,
doi:10.1016/j.susmat.2016.06.002.
11. Agegnehu, G.; Srivastava, A.K.; Bird, M.I. The role of biochar and biochar-compost in improving soil
quality and crop performance: A review. Appl. Soil Ecol. 2017, 119, 156–170,
doi:10.1016/j.apsoil.2017.06.008.
12. Jien, S.H.; Chen, W.C.; Ok, Y.S.; Awad, Y.M.; Liao, C. Sen Short-term biochar application induced
variations in C and N mineralization in a compost-amended tropical soil. Environ. Sci. Pollut. Res. 2017,
1–11, doi:10.1007/s11356-017-9234-8.
13. Luo, S.; Wang, S.; Tian, L.; Li, S.; Li, X.; Shen, Y.; Tian, C. Long-term biochar application influences soil
microbial community and its potential roles in semiarid farmland. Appl. Soil Ecol. 2017, 117–118, 10–15,
doi:10.1016/j.apsoil.2017.04.024.
14. Suliman, W.; Harsh, J.B.; Abu-Lail, N.I.; Fortuna, A.M.; Dallmeyer, I.; Garcia-Perez, M. The role of
biochar porosity and surface functionality in augmenting hydrologic properties of a sandy soil. Sci.
Total Environ. 2017, 574, 139–147, doi:10.1016/j.scitotenv.2016.09.025.
15. Hagemann, N.; Joseph, S.; Schmidt, H.P.; Kammann, C.I.; Harter, J.; Borch, T.; Young, R.B.; Varga, K.;
Taherymoosavi, S.; Elliott, K.W.; McKenna, A.; Albu, M.; Mayrhofer, C.; Obst, M.; Conte, P.;
Dieguez-Alonso, A.; Orsetti, S.; Subdiaga, E.; Behrens, S.; Kappler, A. Organic coating on biochar
explains its nutrient retention and stimulation of soil fertility. Nat. Commun. 2017, 8, 1–11,
doi:10.1038/s41467-017-01123-0.
16. Burrell, L.D.; Zehetner, F.; Rampazzo, N.; Wimmer, B.; Soja, G. Long-term effects of biochar on soil
physical properties. Geoderma 2016, 282, 96–102, doi:10.1016/j.geoderma.2016.07.019.
17. Blanco-Canqui, H. Biochar and Soil Physical Properties. Soil Sci. Soc. Am. J. 2017, 84, 687–711,
doi:10.2136/sssaj2017.01.0017.
18. Zong, Y.; Wang, Y.; Sheng, Y.; Wu, C.; Lu, S. Ameliorating soil acidity and physical properties of two
contrasting texture Ultisols with wastewater sludge biochar. Environ. Sci. Pollut. Res. 2017, 1–8,
doi:10.1007/s11356-017-9509-0.
19. Lomaglio, T.; Hattab-Hambli, N.; Miard, F.; Lebrun, M.; Nandillon, R.; Trupiano, D.; Scippa, G.S.;
Gauthier, A.; Motelica-Heino, M.; Bourgerie, S.; Morabito, D. Cd, Pb, and Zn mobility and
(bio)availability in contaminated soils from a former smelting site amended with biochar. Environ. Sci.
Pollut. Res. 2017, 1–13, doi:10.1007/s11356-017-9521-4.
20. Haider, G.; Steffens, D.; Moser, G.; Müller, C.; Kammann, C.I. Biochar reduced nitrate leaching and
improved soil moisture content without yield improvements in a four-year field study. Agric. Ecosyst.
Environ. 2017, 237, 80–94, doi:10.1016/j.agee.2016.12.019.
21. Yin, D.; Wang, X.; Chen, C.; Peng, B.; Tan, C.; Li, H. Varying effect of biochar on Cd, Pb and As mobility
in a multi-metal contaminated paddy soil. Chemosphere 2016, 152, 196–206,
22. Puga, A.P.; Abreu, C.A.; Melo, L.C.A.; Beesley, L. Biochar application to a contaminated soil reduces the
availability and plant uptake of zinc, lead and cadmium. J. Environ. Manage. 2015, 159, 86–93,
doi:10.1016/j.jenvman.2015.05.036.
23. Tang, J.; Zhu, W.; Kookana, R.; Katayama, A. Characteristics of biochar and its application in
remediation of contaminated soil. J. Biosci. Bioeng. 2013, 116, 653–659, doi:10.1016/j.jbiosc.2013.05.035.
24. Ifthikar, J.; Wang, T.; Khan, A.; Jawad, A.; Sun, T.; Jiao, X.; Chen, Z.; Wang, J.; Wang, Q.; Wang, H.;
Jawad, A. Highly Efficient Lead Distribution by Magnetic Sewage Sludge Biochar: Sorption
Mechanisms and Bench Applications. Bioresour. Technol. 2017, 238, 399–406,
doi:10.1016/j.biortech.2017.03.133.
25. Ding, Z.; Hu, X.; Wan, Y.; Wang, S.; Gao, B. Removal of lead, copper, cadmium, zinc, and nickel from
aqueous solutions by alkali-modified biochar: Batch and column tests. J. Ind. Eng. Chem. 2016, 33, 239–
245, doi:10.1016/j.jiec.2015.10.007.
26. Lu, H.; Zhang, W.; Yang, Y.; Huang, X.; Wang, S.; Qiu, R. Relative distribution of Pb2+sorption
mechanisms by sludge-derived biochar. Water Res. 2012, 46, 854–862, doi:10.1016/j.watres.2011.11.058.
27. Abadin, H.; Ashizawa, A.; Stevens, Y.-W.; Llados, F.; Diamond, G.; Sage, G.; Citra, M.; Quinones, A.;
Bosch, S.J.; Swarts, S.G. Toxicological Profile for Lead. U.S Public Heal. Serv. Agency Toxic Subst. Dis.
Regist. 2007, 582, doi:doi:10.1201/9781420061888_ch106.
28. Wuana, R.A.; Okieimen, F.E. Heavy Metals in Contaminated Soils: A Review ofSources, Chemistry,
Risks and Best Available Strategies for Remediation. ISRN Ecol. 2011, 2011, 1–20,
doi:10.5402/2011/402647.
29. Bashir, S.; Hussain, Q.; Akmal, M.; Riaz, M.; Hu, H.; Ijaz, S.S.; Iqbal, M.; Abro, S.; Mehmood, S.; Ahmad,
M. Sugarcane bagasse-derived biochar reduces the cadmium and chromium bioavailability to mash
bean and enhances the microbial activity in contaminated soil. J. Soils Sediments 2018, 18, 874–886,
doi:10.1007/s11368-017-1796-z.
30. Park, J.H.; Lamb, D.; Paneerselvam, P.; Choppala, G.; Bolan, N.; Chung, J.W. Role of organic
amendments on enhanced bioremediation of heavy metal(loid) contaminated soils. J. Hazard. Mater.
2011, 185, 549–574, doi:10.1016/j.jhazmat.2010.09.082.
31. Lu, K.; Yang, X.; Shen, J.; Robinson, B.; Huang, H.; Liu, D.; Bolan, N.; Pei, J.; Wang, H. Effect of bamboo
and rice straw biochars on the bioavailability of Cd, Cu, Pb and Zn to Sedum plumbizincicola. Agric.
Ecosyst. Environ. 2014, 191, 124–132, doi:10.1016/j.agee.2014.04.010.
32. Bian, R.; Joseph, S.; Cui, L.; Pan, G.; Li, L.; Liu, X.; Zhang, A.; Rutlidge, H.; Wong, S.; Chia, C.; Marjo, C.;
Gong, B.; Munroe, P.; Donne, S. A three-year experiment confirms continuous immobilization of
cadmium and lead in contaminated paddy field with biochar amendment. J. Hazard. Mater. 2014, 272,
121–128, doi:10.1016/j.jhazmat.2014.03.017.
33. Kan, T.; Strezov, V.; Evans, T.J. Lignocellulosic biomass pyrolysis: A review of product properties and
effects of pyrolysis parameters. Renew. Sustain. Energy Rev. 2016, 57, 126–1140,
doi:10.1016/j.rser.2015.12.185.
34. Li, J.; Dai, J.; Liu, G.; Zhang, H.; Gao, Z.; Fu, J.; He, Y.; Huang, Y. Biochar from microwave pyrolysis of
biomass: A review. Biomass and Bioenergy 2016, 94, 228–244, doi:10.1016/j.biombioe.2016.09.010.
35. Glaser, B.; Lehmann, J.; Zech, W. Ameliorating physical and chemical properties of highly weathered
soils in the tropics with charcoal - A review. Biol. Fertil. Soils 2002, 35, 219–230,
doi:10.1007/s00374-002-0466-4.
amendments (mussel shell, cow bone, and biochar) on Pb availability and phytotoxicity in military
shooting range soil. Ecotoxicol. Environ. Saf. 2012, 79, 225–231, doi:10.1016/j.ecoenv.2012.01.003.
37. Zhang, R.H.; Li, Z.G.; Liu, X.D.; Wang, B. cai; Zhou, G.L.; Huang, X.X.; Lin, C.F.; Wang, A. hua; Brooks,
M. Immobilization and bioavailability of heavy metals in greenhouse soils amended with rice
straw-derived biochar. Ecol. Eng. 2017, 98, 183–188, doi:10.1016/j.ecoleng.2016.10.057.
38. Mohan, D.; Sarswat, A.; Ok, Y.S.; Pittman, C.U. Organic and inorganic contaminants removal from
water with biochar, a renewable, low cost and sustainable adsorbent - A critical review. Bioresour.
Technol. 2014, 160, 191–202, doi:10.1016/j.biortech.2014.01.120.
39. Tan, X.; Liu, Y.; Zeng, G.; Wang, X.; Hu, X.; Gu, Y.; Yang, Z. Application of biochar for the removal of
pollutants from aqueous solutions. Chemosphere 2015, 125, 70–85,
doi:10.1016/j.chemosphere.2014.12.058.
40. Kołodyńska, D.; Krukowska, J.; Thomas, P. Comparison of sorption and desorption studies of heavy
metal ions from biochar and commercial active carbon. Chem. Eng. J. 2017, 307, 353–363,
doi:10.1016/j.cej.2016.08.088.
41. Li, H.; Dong, X.; da Silva, E.B.; de Oliveira, L.M.; Chen, Y.; Ma, L.Q. Mechanisms of metal sorption by
biochars: Biochar characteristics and modifications. Chemosphere 2017, 178, 466–478,
doi:10.1016/j.chemosphere.2017.03.072.
42. Oliveira, F.R.; Patel, A.K.; Jaisi, D.P.; Adhikari, S.; Lu, H.; Khanal, S.K. Environmental application of
biochar: Current status and perspectives. Bioresour. Technol. 2017, 246, 110–122,
doi:10.1016/j.biortech.2017.08.122.
43. Zhang, C.; Liu, L.; Zhao, M.; Rong, H.; Xu, Y. The environmental characteristics and applications of
biochar. Environ. Sci. Pollut. Res. 2018, 21525–21534, doi:10.1007/s11356-018-2521-1.
44. Kasozi, G.N.; Zimmerman, A.R.; Nkedi-Kizza, P.; Gao, B. Catechol and Humic Acid Sorption onto a
Range of Laboratory Produced Black Carbons (Biochars). Environ. Sci. Technol. 2010, 44, 6189–6195,
doi:10.1021/es1014423.
45. Mukherjee, A.; Zimmerman, A.R.; Harris, W. Surface chemistry variations among a series of
laboratory-produced biochars. Geoderma 2011, 163, 247–255, doi:10.1016/j.geoderma.2011.04.021.
46. APAT; IRSA/CNR Metodi analitici per le acque; Belli, M., Centioli, D., De Zorzi, P., Sansone, U., Capri, S.,
Pagnotta, R., Pettine, M., Eds.; Manuali e.; APAT, 2003; ISBN 88-448-0083-7.
47. Allaire, S.E.; Lange, S.F.; Auclair, I.K.; Quinche, M.; Greffard, L. Analyses of biochar properties; Québec,
Canada, 2015;
48. Pituello, C.; Francioso, O.; Simonetti, G.; Pisi, A.; Torreggiani, A.; Berti, A.; Morari, F. Characterization
of chemical–physical, structural and morphological properties of biochars from biowastes produced at
different temperatures. J. Soils Sediments 2015, 15, 792–804, doi:10.1007/s11368-014-0964-7.
49. Qambrani, N.A.; Rahman, M.M.; Won, S.; Shim, S.; Ra, C. Biochar properties and eco-friendly
applications for climate change mitigation, waste management, and wastewater treatment: A review.
Renew. Sustain. Energy Rev. 2017, 79, 255–273, doi:10.1016/j.rser.2017.05.057.
50. Foo, K.Y.; Hameed, B.H. Insights into the modeling of adsorption isotherm systems. Chem. Eng. J. 2010,
156, 2–10, doi:10.1016/j.cej.2009.09.013.
51. Agarwal, A.K.; Kadu, M.S.; Pandhurnekar, C.P.; Muthreja, I.L. Langmuir , Freundlich and BET
Adsorption Isotherm Studies for Zinc ions onto coal fly ash. Int. J. Appl. or Innov. Eng. Manag. 2014, 3, 64–
71.
co-pyrolysis of municipal sewage sludge and tea waste for the adsorption of methylene blue from
aqueous solutions: Kinetics, isotherm, thermodynamic and mechanism. J. Mol. Liq. 2016, 220, 432–441,
doi:10.1016/j.molliq.2016.04.107.
53. Ho, Y.S.; McKay, G. Pseudo-second order model for sorption processes. Process Biochem. 1999, 34, 451–
465, doi:10.1016/S0032-9592(98)00112-5.
54. Boni, M.R.; Chiavola, A.; Antonucci, A.; Di Mattia, E.; Marzeddu, S. Cd-contaminated solution
treatment by activated and non- activated beech charcoal. In Proceedings of the 15th International
Conference on Environmental Science and Technology; D.F. Lekkas, Ed.; Rhodes, Greece, 2017; pp. 2–6.
55. Perry, R.H.; Green, D.W.; Maloney, J.O. Chemical Engineers ’ Handbook Seventh; 1997; Vol. 27; ISBN
0070498415.
56. Perry, R.H.; Green, D.W. Perry’s chemical engineers’ handbook; McGraw-Hill, 2008; ISBN 9780071422949.
57. Yoon, Y.H.; Nelson, J.H. Application of Gas Adsorption Kinetics I. A Theoretical Model for Respirator
Cartridge Service Life. Am. Ind. Hyg. Assoc. J. 1984, 45, 509–516, doi:10.1080/15298668491400197.
58. Thomas, H.C. Heterogeneous Ion Exchange in a Flowing System. J. Am. Chem. Soc. 1944, 66, 1664–1666,
doi:10.1021/ja01238a017.
59. Bohart, G.S.; Adams, E.Q. Some aspects of the behavior of charcoal with respect to chlorine. J. Am. Chem.
Soc. 1920, 42, 523–544, doi:10.1021/ja01448a018.
60. Bhaumik, M.; Setshedi, K.; Maity, A.; Onyango, M.S. Chromium(VI) removal from water using fixed
bed column of polypyrrole/Fe3O4 nanocomposite. Sep. Purif. Technol. 2013, 110, 11–19,
doi:10.1016/j.seppur.2013.02.037.
61. Ahmed, M.B.; Zhou, J.L.; Ngo, H.H.; Guo, W.; Chen, M. Progress in the preparation and application of
modified biochar for improved contaminant removal from water and wastewater. Bioresour. Technol.
2016, 214, 836–851, doi:10.1016/j.biortech.2016.05.057.
62. Noh, J.S.; Schwarz, J.A. Effect of HNO3 treatment on the surface acidity of activated carbons. Carbon N.
Y. 1990, 28, 675–682, doi:10.1016/0008-6223(90)90069-B.
63. Tag, A.T.; Duman, G.; Ucar, S.; Yanik, J. Effects of feedstock type and pyrolysis temperature on
potential applications of biochar. J. Anal. Appl. Pyrolysis 2016, 120, 200–206,
doi:10.1016/j.jaap.2016.05.006.
64. Kołodyńska, D.; Wnetrzak, R.; Leahy, J.J.; Hayes, M.H.B.; Kwapiński, W.; Hubicki, Z. Kinetic and
adsorptive characterization of biochar in metal ions removal. Chem. Eng. J. 2012, 197, 295–305,
doi:10.1016/j.cej.2012.05.025.
65. Karunanayake, A.G.; Todd, O.A.; Crowley, M.; Ricchetti, L.; Pittman, C.U.; Anderson, R.; Mohan, D.;
Mlsna, T. Lead and cadmium remediation using magnetized and nonmagnetized biochar from Douglas
fir. Chem. Eng. J. 2018, 331, 480–491, doi:10.1016/j.cej.2017.08.124.
66. Rouquerol, J.; Llewellyn, P.; Rouquerol, F. Is the bet equation applicable to microporous adsorbents?
Stud. Surf. Sci. Catal. 2007, 160, 49–56, doi:10.1016/S0167-2991(07)80008-5.
67. Inyang, M.; Gao, B.; Ding, W.; Pullammanappallil, P.; Zimmerman, A.R.; Cao, X. Enhanced lead
sorption by biochar derived from anaerobically digested sugarcane bagasse. Sep. Sci. Technol. 2011, 46,
1950–1956, doi:10.1080/01496395.2011.584604.
68. Uchimiya, M.; Lima, I.M.; Thomas Klasson, K.; Chang, S.; Wartelle, L.H.; Rodgers, J.E. Immobilization
of heavy metal ions (CuII, CdII, NiII, and PbII) by broiler litter-derived biochars in water and soil. J.
Agric. Food Chem. 2010, 58, 5538–5544, doi:10.1021/jf9044217.
Alexandre-Franco, M.F.; Gómez-Serrano, V.; Gong, H. Sorption of arsenic, cadmium, and lead by chars
produced from fast pyrolysis of wood and bark during bio-oil production. J. Colloid Interface Sci. 2007,
310, 57–73, doi:10.1016/j.jcis.2007.01.020.
70. Harris, W. Dairy-Manure Derived Biochar Effectively Sorbs Lead and Atrazine. Environ. Sci. Technol.
2009, 1, 3285–3291, doi:Doi 10.1021/Es803092k.
71. Liu, Z.; Zhang, F.S. Removal of lead from water using biochars prepared from hydrothermal
liquefaction of biomass. J. Hazard. Mater. 2009, 167, 933–939, doi:10.1016/j.jhazmat.2009.01.085.
72. Li, Y.-H.; Ding, J.; Luan, Z.; Di, Z.; Zhu, Y.; Xu, C.; Wu, D.; Wei, B. Competitive adsorption of Pb2+,
Cu2+ and Cd2+ ions from aqueous solutions by multiwalled carbon nanotubes. Carbon N. Y. 2003, 41,
2787–2792, doi:10.1016/S0008-6223(03)00392-0.
73. Xue, Y.; Gao, B.; Yao, Y.; Inyang, M.; Zhang, M.; Zimmerman, A.R.; Ro, K.S. Hydrogen peroxide
modification enhances the ability of biochar (hydrochar) produced from hydrothermal carbonization of
peanut hull to remove aqueous heavy metals: Batch and column tests. Chem. Eng. J. 2012, 200–202, 673–