Article
Assessment of the Performance of Rainfall-Runoff
Model GR4J to Simulate Streamflow in Ouémé
Watershed at Bonou’s outlet (West Africa)
Domiho Japhet Kodja1,*, Gil Mahé2 , Ernest Amoussou3, Michel Boko4, Jean Emmanuel Paturel5,
1,4 University of Abomey Calavi (Bénin) / Laboratory Pierre Pagney, Climate, Water, Ecosystems and Development (LACEEDE) 03 BP 1112 Cotonou; [email protected]
2 University of Montpellier (France), UMR 5599 HydroSciences Montpellier ; [email protected] 3 University of Parakou (Bénin), Department of Geography and Spatial ; [email protected]
5 University of Montpellier (France), UMR 5599 HydroSciences Montpellier; [email protected] * Correspondence: [email protected]; Tel.: +229-95-496-994
Abstract: The study aims to analyze the performance criteria of the GR4J model to reproduce high water flows in the Ouémé watershed at Bonou's outlet which has been vulnerable to climate change in recent decades. The methodology focused on the use of daily climatological and hydrometric data extracted from files of National Directorate of Meteorology, and General Directorate of Water; they were supplemented by those of SIEREM/HSM dataset over the period 1961-2015. The rainfall was regionalized using Thiessen method. The performance of the GR4J model was assessed with NSE, RMSE and KGE criteria. The results indicate that the study area is marked by rainfall variabilities and detection of two breakpoints (1968 and 1987) which divide the series into three sub-periods; these discontinuities have repercussions on the streamflow. It's found that GR4J model overestimates the streamflow during the low water period and underestimates them in high water. However, the efficiency and performance criteria NSE, RMSE and KGE calculated on high water flow rates are better in calibration than in validation. The KGE values are range between 83-85% in calibration and 56-68% during validation, which gives to GR4J model the efficiency and performance to reproduce high flow rates in the study area.
Keywords: streamflow; runoff model GR4J; performance; simulation; watershed; Bonou;
1. Introduction
Climatic changes that threatening the planet earth in recent decades are one of the factors in the recurrence of extreme rainfall anomalies generating risks of flood and drought [11-32]. Increasing temperature is considered one of the observed indicators of climate change and is expected to have an increasing impact on people and their environment, including species, ecosystems and protected areas around the world [61]. The adverse effects of climate change therefore have the potential for changes in the water cycle with disasters at all levels. These phenomena often have serious effects on socio-economic life and the environment. The consequences of floods and droughts include loss of life and property, mass migration of people and animals, ecological disasters, and shortages of food, energy, water and energy, other essential goods. It is in the developing world that the degree of vulnerability to these natural disasters is highest. Poor people are often the most affected because they live in large numbers in the most vulnerable areas. This vulnerability of people in the tropical region to climate variability is more important as the different agricultural production systems are strongly correlated with climate [38- 46]. According to [34], whether the water resource is abundant or very small, humanity has made an intensive use (food, agricultural production, industrial activities, etc.). Thus, the problem of managing natural risks is, therefore, a major issue, particularly in the field of floods [12]. The study of floods is an old problem which still remains difficult to solve until today [18-22]. In Benin, flooding of large rivers is one of the main natural disasters associated
with climate change [1- 8]. They are characterized by a strong interannual variability in term of their abundance as spatial distribution. The river regimes record very significant interannual variations. The high intensity of the rains, currently in West Africa [1, 18, 59] and the more frequent recurrence of extreme events in some basins, including Oueme, raise concerns about the severity floods. [8-45], have reported that since the 1990s it was observed a slight recovery of rainfall in West Africa compare to decades 1970 and 1980. Admittedly, they meant that this recovery is lower than that of the 1960s and nevertheless causes exceptional high waters that are increasingly catastrophic [9]. This is the case of the watershed of Ouémé at Bonou's outlet, where the occurrence of floods linked to extreme rain events causes enormous damages [21], such as the destruction of crop fields, housing, road infrastructure, early degradation of the environment and waterborne diseases. This situation calls for warning strategies that require a flood forecast to take action to mitigate the risks and penalties of the population. Control of water is therefore of paramount importance [61]. It becomes important to have models that can represent the water cycle as a whole. For [44], a rain-flow model is particularly interesting in developing countries since it can simulate flows but also predict the evolution of water resources in the coming years or decades. However, it turns out that few studies have focused on rainfall-flow modeling in the Ouémé watershed at the Bonou outlet where the flood event is recurrent and followed by the disaster. The present study aims to analyze the performance of the overall rainfall flow GR4J model to reproduce the average flows in the Ouémé watershed at the outlet of Bonou.
1.1. Geographic location of the study environment
The watershed of Ouémé at the outlet of Bonou, covers as area 46,200 km2 (41.02 % of the area
Figure 1: The geographical location of the Ouémé watershed at the Bonou outlet
2. Materials and Methods
2.1. Data
Data used in this study are related to climatological and hydrometric data. As climatological data, we used daily rainfall recorded on thirty (30) stations including four (4) synoptic stations from the National Directorate of Meteorology (NDM) database, structure under Agency for Aerial Navigation Safety in Africa and Madagascar (ASECNA).
The hydrometric data, meanwhile, are daily flows measured at the outlet of Bonou and collected from the dataset of the Hydrology Department of the Directorate General of Water (DGEau) / Benin). These data have been supplemented by some data from the Environmental System of Information on Water Resource and Modeling (SIEREM) database, the Joint Research Unit 5569, Hydro-sciences Montpellier (HSM)
2.2. Methods
2.2.1. Regionalization of Rain Data
to average rainfall at a watershed scale [14-40]. Thus, the daily rainfall over Ouémé watershed at the Bonou outlet has been regionalized in order to have an average precipitation value over the study area. Endeed, In West and Central Africa, precipitations are estimate via spatial interpolation for sites with little or no data [6], or by regional frequency analysis methods [24-48] for flooding and [5-57] for precipitation. In addition, there are some other methods; the simple arithmetic mean approach, linear interpolation, Thiessen polygon interpolation, and ordinary Kriging. Interpolation methods use geometric approaches (i.e. the closest three-station method, Thiessen polygons) or spatial correlation functions (kriging) to estimate the precipitation associated with a given event or frequency at a target site [58-61].
Certainly, the most robust and most used method in recent years in the tropics and particularly
in West Africa are the linear interpolation and the interpolation by Thiessen’s polygons [31-62]. For this research, the Thiessen method was used for the regionalization of rainfall data in order to have an averaged data.
2.2.2. Detection of ruptures in rainfall and hydrometric series
Detection of the break of stationarity is one of the main concerns of the problematic of studies on climate change or variability. It allows to highlight the hydroclimatic pejoration in the study area using the statistical tests integrated into the Khronostat 1.01 software, which was developed by the Joint Research Unit (UMR 5569) of the HydroSciences Montpellier laboratory.
These are, Buishand's method and Wood's Ellipse, Lee and Heghinian's Bayesian method, Hubert's Segmentation method, and Pettitt's nonparametric method used in many West African studies Centrale by [7, 15, 17, 37, 51] and especially in Bénin by [3, 8, 25, 30, 61]. Pettitt's nonparametric method will be treating in this study.
2.2.3. Rainfall and hydrometric indices
The SPI_SL_6 software developed by the World Meteorological Organization [47-59] used to identify extreme events (dry or deficit, normal, surplus or wet) under the period 1961-2015. The SPI is determined by normalizing the precipitation for a given station after it has been fitted to a probability density function as described by [41-42]. It computation is based on the formula below:
X
X
SPI
i (1): is the flow / rain of the year i ; : is the mean interannual flow/ mean interannual rainfall
over the study period and the standard deviation of the series. If
SPI
0
: the year is dry ordeficit; If
SPI
0
the year is called average or normal; IfSPI
0
the year is wet or excess.2.2.4. Calculation of Potential Evapotranspiration (PE)
Potential evapotranspiration (PE) calculation using the formulation proposed by [49]. The method adopted is that developed by [49], already tested by several other studies [9-28].
It consists of estimating the daily PET for hydrological modeling. The method comes from Jensen-Haise and McGuinness models. These models generally used in climatology take into account only the average daily temperature of the air and the solar radiation which depends on the latitude and the 365 days of the year. They usually take the following form:
1 2
K
K
T
R
PE
e a
si
T
a
K
2
0
,
PE
0
(2)
i
X
X
:
With
PE
: Potential Evapotranspiration (mm.j-1) ;R
e : Solar radiation (MJ.m-2.j-1);T
a : Average daily temperature (°C) ;
: the latent heat flow ( 2,45 MJ.kg-1) ;
: the density of the water (kg.m-3).)
(
1
C
K
andK
2(
C
)
: are fixed parameters of the model.2.2.5. Method of calibration / validation of the model
To calibrate and validate the GR4J model, it has been retained some sub-periods (Table I). It should be noted that sub-periods selected are homogeneous and is whether to the dry or wet sequence, obtained after the analysis of the stationary breaking in the rainfall and discharge time series.
Table I: Table of calibration / validation subperiods
Calibration Validation
1961-1968 1976-1983
1988-1995 2005-2012
The optimization of the model's parameters and the measurement of its performances to simulate flows has been made through three criteria, including the "Nash".
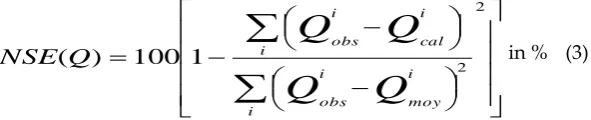
According to [54], the Nash-Sutcliffe criterion can be calculated for high water flow; on the square roots of flows; or logarithms of flows and criteria based on the balance sheet. Among these four calculation options, it is the criterion of the "Nash" calculated on the flows of high water: NSE (Q) which was used for the optimization of the results in this study, whose formula is:
2 2 1 100 ) ( i i moy i obs i i cal i obsQ
Q
Q
Q
QNSE in % (3)
All the values of these criteria vary between] -∞; 1], [50].
In addition, the mean squared error (RMSE) criterion calculated on the high water flows was used. The RMSE criterion is based on statistical bias [23]. It is the function which calculates an error criterion based on the mean squared error [11].
In addition to the criterion value, the outputs of the function include a multiplier (-1 or +1) which allows the use of the function for model calibration. It is an estimator that leads to comparing two variables.
Indeed, when two estimators to be compared are unbiased, the most efficient estimator is simply the one with the smallest variance. Similarly, if an estimator has both greater bias or higher and greater variance than another estimator, the latter is obviously the best [16]. According to Le Moine [36], the RMSE formula is :
N i i iobs
sim
N
RMSE
1 21
(4)With : N is the number of time steps; obs and
sim
are the observed and simulated flows, respectively, at time step iIn this study, we added a third criterion KGE to assess the performance of the GR4J model to simulate the high water flows in the Ouémé watershed at the Bonou outlet.
[23], have reevaluated RMSE and NSE and proposed this third criterion KGE. KGE (Kling–
optimization on KGE resulted in the other two components being indeed lead to be close to their ideal values [13]. It formula is :
ED
KGE1
and
ED
r
1
2
1
2
1
2 (5)
ED
Euclidean distance from the ideal point;r
Pearson correlation coefficient;
0
s: is the ratio between the standard deviation of the simulated values and the standard deviation of the
observed ones;
0
s: is the bias and also the ratio the ratio between the mean of the simulated values and the mean of the observed ones.
3. Results
3.1. Interannual evolution of rainfall in the Ouémé watershed at Bonou’s outlet
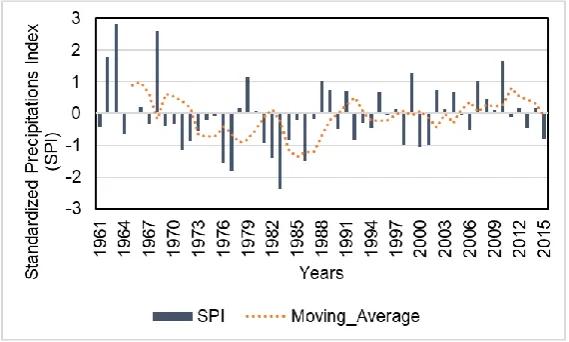
Figure 2 shows the interannual evolution in the Ouémé watershed at the outlet of Bonou.
Figure 2 : Interannual evolution of rainfall in the study area
The analysis in Figure 2 shows that positive rainfall indices characterize wet periods or sequences, while negative value indices indicate periods of drought in the study environment. However, among the years corresponding to the wet sequences, there are 1963, 1968, 1978, 1990, 2002, 2010.
As for the years marked by the drought, it is identified the years 1971, 1974 1976, 1983, 1987, 1989, 2005 2015. These observations during previous years have been highlighted by many studies over the study area [3, 11, 30, 33].
3.1.1. Analysis of the stationnarity break
The table II presents the statistical results from Pettitt's non-parametric method and Hubert's segmentation in the stationarity analysis of rainfall
Table II : Results from Pettitt's non-parametric method and Hubert's segmentation in the stationarity analysis of rainfall
Début Fin Moyenne Observations
1961 1968 1293.3
1969 1987 1061.5 1961-1968 > 1969-1987
Meaning of the Pettitt test at the 99 % threshold
The analysis in Table II shows that the average annual rainfall during the sub-period 1961-1968 is 1293.3 mm, greater than the period 1969-1987, which is 1061.5 mm or 17,9 %, whilst on sub-period 1988-2015 (1166.6 mm) the average annual rainfall is higher than the previous sub-period with a negative difference of 9.9 %.
It is, therefore, noted that there is a rainfall recovery during the last sub-period compared to the previous one, which is marked by a rainfall recession in the study area. This finding is consistent with previous works on river watersheds in West Africa, including [15,51,61] on the Niger; and in Benin by [27-33] on the Upper Ouémé, [8] at the Mono river.
3.2.Variabilité interannuelle de la lame d’eau écoulée dans le bassin versant de l’Ouémé à l’exutoire de Bonou
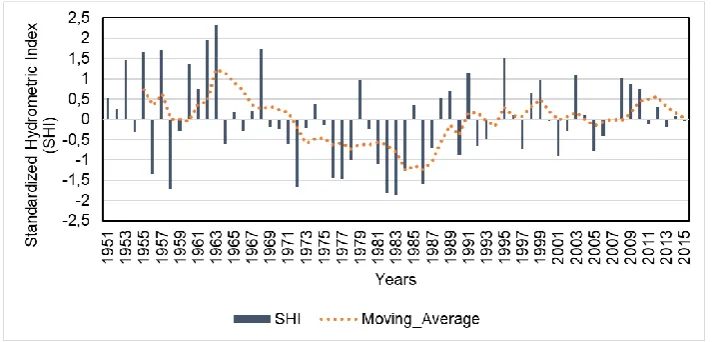
Figure 3 shows the interannual evolution of discharges from 1961 to 2015 in the study area.
Figure 3 : Interannual evolution of discharges
The analysis in Figure 3 shows that the flows have interannual variability marked by wet periods illustrated by positive anomalies in 1962, 1963, 1973, 1991, 2010, 2014, and negative anomalies that account for deficit years or the decrease in water slide elapsed during the years 1969, 1974, 1977, 1983, 1987, 1989, 2005, 2011, 2012, 2015.
The breaking point years are taken into account in rainfall stationarity to better analyze the difference between wet and dry sub-periods in time series of streamflow. Thus, the period 1961-1968 has an average flow evaluate to 253.8 m3 /s against 117. 3 m3 / s and 196.8 m3 / s respectively for the periods 1969-1987 and 1988-2015. This analysis suggests that the 1961-1968 sub-period is greater than the next sub-period (1969-1987) with 53,8 % decline, while the 1969-1987 sub-period has a lower average flow rate than sub-period (1988-2015) i.e. an increase of 67,7 %.
Regarding these results above, it should be said that the rainfall variability has had an impact on the average flow of the Ouémé watershed at the outlet of Bonou [59].
This also conforms to previous studies driven by [8, 33, 37, 45], who indicate that from the 1990s, there is a slight recovery of rainfall in West Africa, in an increasingly anthropogenic environment that has led to an increase in water levels in the streams compared to the 1970s and 1980s. It is true that these researchers have indicated that this recovery is lower than that of the 1960s and nevertheless causes exceptional high waters which are more and more catastrophic [7].
3.3. Utility of runoff model GR4J
as the mono-Athiémé. For these researchers, hydrological modeling is an essential tool for understanding dynamics of a watershed, in the rational use of the water resources of this basin and in the fight against natural disasters related to floods. For [20], there are different mathematical models including statistical or stochastic models (black box), conceptual, global or distributed. [52], quoted by [61], has shown that the mathematical simulation of the transformation of rainfall into watershed-scale discharge has grown considerably since the beginning of the 1960s by the favor of the evolution of computing capacities.
Nowadays, there is a considerable number of models, among them, we can list global conceptual or empirical models that represent the link between rainfall and flow through various arrangements of reservoirs. According to the author, all the structures of these models received the same data and their parameters were calibrated using the same local optimization procedure, the "step-by-step" method, which was shown reliable for locating satisfactory optima.
The author adds that new formulations of optimization criteria (Nash criterion) and the balance criterion, considered more satisfying, have been proposed. The results of the tests indicate that the "reservoir" models are much more satisfactory than a "black box" type model that does not include an internal diagram of humidity monitoring of the basin.
In addition, the structure of the model, i.e. its internal formulation, has been appeared to be decisive for the success of the model. This research opted for a global conceptual hydrological model such as, the empirical model rainfall flow of the four-parameter Rural Engineering (GR4J) at daily time step; it developed by the CEMAGREF (Center for the Study of Agricultural Machinery and Engineering Rural Water and Forests), currently called IRSTEA (National Institute for Research in Science and Technology for the Environment and Agriculture) and highlighted by [39, 43, 52, 54].
The GR4J model has been extensively tested in a large number of watersheds in France, Australia, Brazil and the United States [53], in Côte d'Ivoire [56]. It has also been applied for the management of dams [63] and has been used for the development of a variational method for flood flow prediction [62]. It has also been used in a context of climatic variability in the Upper Ouémé basin [35] and in the Benin Niger River basin [61], in the Ouémé-Savè catchment area by [2].
All the authors have clearly established the relative robustness of the model. The GR4J model uses few data whose input variables are limited to the rainfall series, PET and flow rates for calibration. The GR4J model is robust and has powerful optimization criteria [23], [29].
It has the advantage of taking into account the daily time step, which allows in this study to reproduce the extreme flow of floods in the catchment of Ouémé to the outlet of Bonou at finer time step.
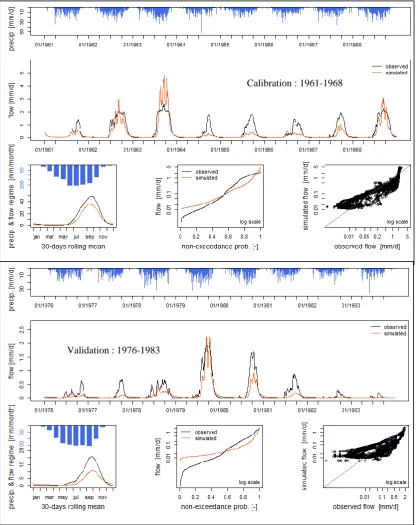
3.3.1. Rainfall variability, rates observed and simulated on wet and dry subperiods in calibration and validation with the GR4J model from the Nash-Sutcliffe criterion calculated on the criterion high water (NSE (Q))
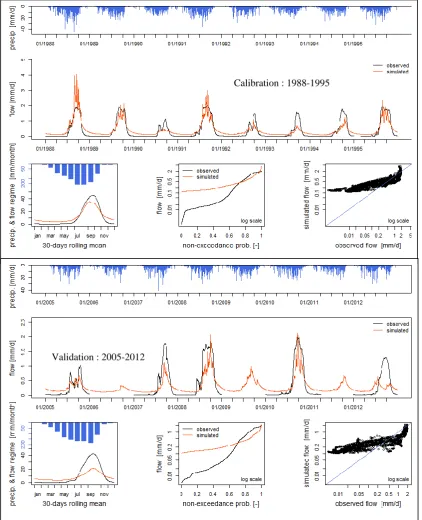
Figure 4.1: Rainfall variability, observed and simulated flow rates on wet sub-period in calibration (1961-1968) and on dry sub-period in validation (1976-1983) with the GR4J model from the criterion
of (NSE (Q))
Calibration : 1961-1968
Figure 4.2: Rainfall variability, observed and simulated flow rates on wet sub-period in calibration (1988-1995) and on dry sub-period in validation (2005-2012) with the GR4J model from the criterion
of (NSE (Q))
The analysis of Figures 4.1 and 4.2, shows that the observed and simulated flows have almost the same pace with variability at the rate of rainfall into the basin. However, there is a slight discrepancy between the observed and simulated flows, which can be attributed either to the response time of the watershed to the rainy events. Similarly, it is found that the simulated flows overestimate the flows observed during the low water period, from November to May with a probability between 0 to 70 % and underestimate them between 70 and 95 % during periods of high water; which is the result of cumulative rainfall total amount in the study area during June, July, August, September, and October. It is noted that peak flows of observed and simulated reach their
Validation : 2005-2012
maximum in September or October. However, the extreme rainfall events which cause flooding in the area, occur during these months depending on the season [33], [59]. Based on these observations, we can say that the GR4J model represents well average flows in the Ouémé watershed at the Bonou outlet. However, the analysis of the optimization criteria of the model, are indicators of a better appreciation of the performance of the model to simulate flood flows in the study environment.
3.3.2. Values of calibration and validation optimization criteria in the Ouémé watershed at Bonou’s
outlet
Successful use of computer models to simulate environmental variables and processes requires objective calibration and model verification procedures. Several methods have been proposed to quantify the validity of the observations compared to the values calculated by the models, but none of them is free from limitations and is often ambiguous [55]. According to these authors, when only one indicator is used, this may lead to incorrect model verification. Instead, a combination of graphical results, absolute value error statistics ie mean squared error and standardized fit quality statistics is ie Nash-Sutcliffe efficiency coefficient (NSE) is currently recommended [23], [36]. Thus, the interpretation of NSE values, is often subjective and may be biased by the magnitude and number of outliers and repeated data points. The statistical significance of performance statistics is a generally ignored aspect that helps to reduce subjectivity in the correct interpretation of model performance [55]. Root mean squared error (RMSE) associated with Nash-Sutcliffe efficiency (NSE) are the two criteria most widely used for calibration and evaluation of hydrological models with observed data. In this study, we add a third KGE criterion to assess the performance of the GR4J model to simulate average flows in the Ouémé watershed at the Bonou outlet. The RMSE and NSE criteria have already been the subject of a hydrological modeling study with the GRP on the Mono basin in Benin [9], whilst these two criteria have been reevaluated by [13], [23], to propose the third criterion KGE. KGE
(Kling–Gupta efficiency) is based on an equal weighting of three components (correlation, bias, and
variability measures). In general, the correlation will not reach its ideal value of unity, but an optimization on KGE resulted in the other two components being indeed lead to be close to their ideal values.
The GR4J model was calibrated under each sub-period, and it can easily find that optimized values of the parameters are very variable from one sub-period to another. Table III presents the optimized values of Nash, KGE, and RMSE in calibration and validation as well as the parameters of the GR4J model.
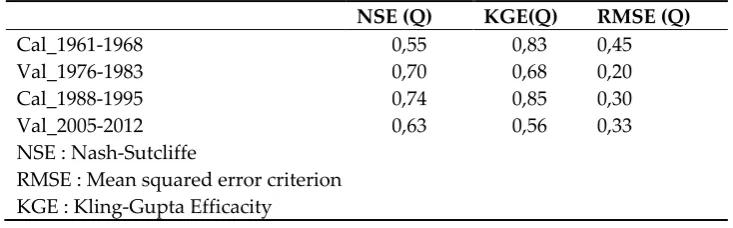
Table III: Values of the optimization criteria and performance of the GR4J model to simulate streamflows
NSE (Q) KGE(Q) RMSE (Q)
Cal_1961-1968 0,55 0,83 0,45
Val_1976-1983 0,70 0,68 0,20
Cal_1988-1995 0,74 0,85 0,30
Val_2005-2012 0,63 0,56 0,33
NSE : Nash-Sutcliffe
RMSE : Mean squared error criterion KGE : Kling-Gupta Efficacity
Source: Data Processing Results
In addition to the criterion of efficiency of Nash, the study used another criterion whom interest aims to appreciate the performance of the model GR4J to simulate the flows. This criterion is the RMSE, based on statistical bias [9], [13], [23]. Thus, in the case of this study, the RMSE criterion leads us to say that the RMSE values, in calibration as well as in validation vary from one sub-period to another. On the dry sub-period from 1976-1983, the RMSE is 20 % in validation, against 45 % for the wet sub-period 1961-1968, in calibration. In addition, for the wet sub-period 1988-1995, it is 30 % in calibration while in dry sub-period 2005-2012 it is 33 % in validation. These results lead to the conclusion that the criterion based on the RMSE confers firstly, on the GR4J model, an efficiency to better simulate the flows during the validation on the dry periods and in calibration during the wet sub-periods, by minimizing the biases. This finding corroborates with the results of the analysis of the Nash criterion discussed above.
Moreover, using the objective function of the Kling-Gupta efficiency criterion, KGE, [23], we found that under calibration, it varies from 83 to 85 %, when it is between 56 and 68 % in validation. The KGE criterion confirms the analyzes above, due to the degradation of the KGE in validation. The KGE criterion is also conform to the results and gives under calibration, values greater than 80 %. These analyzes lead to the conclusion that KGE's objective function is the best criterion of efficiency and is better suited to evaluate the performance of the GR4J model in reproducing high water flows. At this end, it is easy to say that the GR4J model is efficient, effective and can suitably and robustly reproduce daily high water flow in the catchment of Ouémé at Bonou's outlet.
3.4. Evolution of the maximum flows observed and simulated in 24 hours from the GR4J model in the Ouémé
watershed at Bonou’s outlet
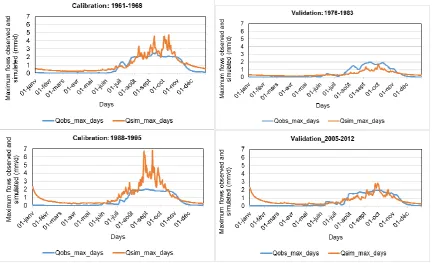
From the simulated flows drive by GR4J model, the daily maximum flows simulated are extracted and compared to the maximum flow rates observed according to each sub-period considered. Figure 5 shows the variability of the maximum observed and simulated flow rates in mm/day with the GR4J model.
Figure 5: Variability of the maximum flows observed and simulated rates in mm/day with the GR4J model.
Also, during the calibration sub-period, there is a peak of 2.61 mm/day (in observed maximum flow rates) in September and a peak of 4.77 mm/day (in simulated maximum flows) in October of sub-period 1961-1968. For 1988-1995, the maximum peak flow in 24 hours was observed in August, i.e. 2.03 mm/s whilst it was 6.8 mm/day in September for the simulated maximum flows. As for the validation sub-periods, the daily annual maximum flow peaks trying to reproduce extreme flows are respectively 1.96 mm/days (maximum flow rates observed) in September and 1.7 mm/day (simulated maximum flow rates) in October during the subperiod 1976-1983. For the 2005-2012 sub-period, daily peak flows are observed in September and are respectively 1.98 mm/day (maximum observed flow) and 2.84 mm/day (maximum simulated flow ).
It is noted that during the periods from July to October the daily maximum flows simulated are well represented and overestimate the observed maximum flow rates during calibration and on the wet sub-periods. But, in validation, the simulated maximum flow rates are underestimated the daily maximum observed flow rates. However, the period of high water events in the Ouémé watershed at Bonou outlet extends from September to October during the rainy seasons which occurred from May to October throughout the basin [33], [59]. Based on these analyzes, it should be said that from the maximum daily flow rates, the GR4J model gives a better simulation of the high water flows especially during calibration than in validation. Thus, these results are indicators and lead to the conclusion that the GR4J model can not only be used to simulate high water flows but also serve as a decision support tool for the implementation of early warning flooding in the Ouémé watershed at the outlet of Bonou.
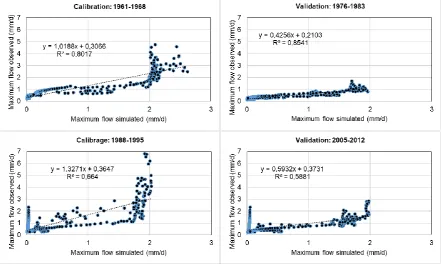
Figure 6 shows the orrelation between maximum observed and simulated flow rates in calibration and validation during wet and dry sub-periods
Figure 6: Correlation between maximum observed and simulated flow rates in calibration and validation during wet and dry sub-periods
4. Discussions and conclusion
This study showed that the study area is confronted to a rainfall variability, with the existence of two breaks of stationarity, one in 1968 and the other in 1987; which divides the study period into three periods, including 1961-1968; 1969-1987 and 1988-2015. The 1988-2015 sub-period is characterized by a rainfall recovery in the Oueme basin, this finding has already been shown by [11]. In addition, the rainfall variability has impacted the hydrological dynamics of the study area. As for the results of the rainfall-flow modeling with the GR4J model, they are in harmony with the previous work over river basins in Benin. [60] Vissin (2007) showed the efficiency of the GR4J and GR2M models to simulate flows in the Niger sub-basins on the Benin portion with Nash values were greater than 60 %. Similar results are also obtained by [4], in a study on hydro-rainfall characterization using the GR4J model on the sub-basins of Upper Ouémé at Savè and Zou at Atchérigbé outlet. Similarly, [2], have shown in a reflection on the comparative study of a global conceptual model (GR4J) and a semi-distributed model (GéoSFM) on the Ouémé watershed at Savè outlet that in simulation, the model GR4J outclasses the GéoSFM model on the Ouémé basin in Savè. These authors indicated that the correlation coefficients between the observed and simulated flows, given by the GR4J model, are greater than 50 % and are clearly above those provided by the GéoSFM model which are generally less than 50 %. These researchers concluded that the GR4J has more facility to simulate the flows on the watershed. More, this study revealed that the simulated flow rates overestimate the flows observed during the low water period, from November to May with a probability between 0 to 70% and underestimate during high water periods with Nash from 70 and 95 %, which can be attributed to the effect of rainfall totals amount in June, July, August, September and October over the study area. In addition, the maximum flow rates observed and simulated reached their maximum in September or October. However, the extreme rainfall events that cause flooding in the area study occur during these months depending on the season [33], [59]. In addition, the study showed that with the GR4J model, the flows are well simulated during the calibration period with Nash between 55 to 77 %, against a degradation of the performance criteria of the model in validation with Nash from 65 to 70 % when moving away from the calibration period. The analysis of the error criterion based on the mean squared error showed that the calculated RMSE values vary from one sub-period to another than in calibration as in validation. The RMSE gave values that vary from 30 to 45 % in calibration and from 20 to 33 % in validation. However, if an estimator has both a larger bias and a larger variance than another estimator, the latter is obviously better [16]. Thus, the RMSE values are better in calibration (15 to 21 %) during the wet period than during the dry period whose RMSE is in the order of 11 to 23 % in validation. This analysis also allows us to say that the RMSE confers to the GR4J model, an efficiency to reproduce the flows of high water. The originality of this research refers to the results of the objective-function Kling-Gupta efficacy criterion, KGE [23], [29]. However, with the KGE, it is obtained a percentage between 83 and 85 % in calibration against 56 and 68 % in validation. The KGE criterion confirms the above results and also the degradation of the KGE in validation. The KGE criterion also reinforces the results and gives calibration, values greater than 80 %. It should be said that the objective function of KGE is the best criterion of efficiency and reinforces the RMSE criterion for the evaluation of the performance of the GR4J model to adequately reproduce the daily flows of high water in the watershed of Ouémé at the outlet of Bonou.
Acknowledgments:
We would like to thank the officials of the French Ambassy in Bénin, for supporting our research stays at HydroSciences Montpellier (HSM, UMR 5569). We are thankful to Nathalie Rouché (UMR 5569 HydroSciences Montpellier), to Martial Dossou (National Focal Point of the Early Warning System Project (SAP-BENIN) at the General Directorate of Water, in Bénin), to Ahmed Cyrille Midingoyi (National Directorate of Meteorology in Bénin) and to Gandomè M. L. D. Quenum (WASCAL, PhD Student) for their helpful assistance with the data collections. Finally the authors would like to thank Samiratou Ouermi, PhD Student in WASCAL (West African Science Service Center on Climate Change Adapted Land Use) Programs, for her helpfull training on GR4J airGR tools using.Conflicts of Interest: The authors declare no conflict of interest
References
1. Adjakpa T. T. 2016. Gestion des Risques Hydro-pluviométriques dans la Vallée du Niger au Bénin: Cas des Inondations des Années 2010, 2012 et 2013 dans les Communes de Mallanville et de Karimama. Thèse de doctorat unique, EDP/FLASH/UAC, 279p
2. Afouda, A., Aguè, A. I., & Lanhoussi, F. 2015. Etude comparative d’un modèle conceptuel global (GR4J) et d’un modèle semi-distribue (GEOSFM) sur le bassin versant de l’Ouémé à Savè (Bénin, Afrique de
l’Ouest).Revue LJEE, (24&25)
3. Akognongbé A J. S., 2014. Influence de la variabilité climatique et les activités anthropiques sur les eaux de
surface dans le bassin de l’Ouémé à Bétérou au Bénin. Thèse de doctorat Unique, Université d’Abomey -Calavi, 255p
4. Akognongbé A., Vissin E., Zannou A et Boko M., 2008, « Vulnérabilité des ressources en eau sur le bassin de l‟Ouémé à Savè : étude climatique sur la période 1965 – 2002 ». In XXIème colloque de l’Association Internationale de Climatologie, Montpellier 2008, pp 7985.
5. Alila, Y. 1999. A hierarchical approach for the regionalization of precipitation annual maxima in Canada. J. Geophys. Res. 104( D24) 31645–31655.
6. Amani, A., & Lebel, T.,1998. Relationship between point rainfall, average sampled rainfall and ground truth at the event scale in the Sahel. Stochastic Hydrology and Hydraulics, 12(2), 141-154.
7. Amoussou E. 2014. Analyse hydrométéorologique des crues dans le bassin versant du Mono en Afrique de
l’Ouest avec un modèle conceptuel pluie-débit. FMSH-WP-2015-90.
8. Amoussou E., 2010. Variabilité pluviométrique et dynamique hydro-sédimentaire du bassin versant du complexe fluvial lagunaire Mono-Ahémé-Couffo (Afrique de l’Ouest) Thèse de Doctorat, Université de Bourgogne, 313 p.
9. Amoussou E., Tramblay Y., Totin V. S H., Mahé G., & Camberlin P. 2014. Dynamique et modélisation des crues dans le bassin du Mono à Nangbéto (Togo/Bénin), Hydrological Sciences Journal, 59:11, 2060-2071, DOI: 10.1080/02626667.2013.871015
10. Amoussou, E., Camberlin, P. et Mahé, G., 2012. Impact de la variabilité climatique et du barrage Nangbéto
sur l’hydrologie du système Mono-Couffo (Ouest Afrique). Hydrological Sciences Journal , 57 (4), 805–817. 11. Amoussou, E., SH, T. V., Houessou, S., Tramblay, Y., Camberlin, P., Houndenou, C., ... & Paturel, J. E. 2015.
Application d’un modèle conceptuel à l’analyse de la dynamique hydrométéorologique des crues dans un
bassin-versant en milieu tropical humide: cas du fleuve Mono. In 28ème Colloque de l’Association
Internationale de Climatologie pp. 17-23.
12. Andréassian V., Perrin C., & Michel C., 2004. Impact of imperfect potential evapotranspiration knowledge on the efficiency and parameters of watershed models. Journal of Hydrology, 286(1-4), 19-35
13. Andreassian, V., Bourgin F., Oudin L., Mathevet T., Perrin C., Lerat J., Coron L., and Berthet L. 2014. Seeking genericity in the selection of parameter sets: Impact on hydrological model efficiency, Water Resour. Res., 50, 8356–8366, doi:10.1002/ 2013WR014761
14. Andréassian, V., Perrin, C., Michel, C., Usart-Sanchez, I., & Lavabre, J., 2001. Impact of imperfect rainfall knowledge on the efficiency and the parameters of watershed models. Journal of Hydrology, 250(1-4), 206-223
15. Ardoin-Bardin S., 2004. Variabilité hydroclimatique et impacts sur les ressources en eau de grands bassins hydrographiques en zone soudano-sahélienne. Thèse de Doctorat, Université Montpellier II, 437 pages. 16. Bouthevillain K., Mathis A., 1995. Prévisions : mesures, erreurs et principaux résultats. In: Economie et
statistique, n°285-286, pp. 89-100
17. Camberlin, P.,, Pohl, B., Crétat, J. 2011. Testing WRF capability in simulating the atmospheric water cycle over Equatorial East Africa. Climate Dynamics, 37(7-8), 1357-1379
18. Champion, M., 1858. 1864. Les inondations en France depuis le VIe siècle jusqu’à nos jours. Paris, Dunod, 6 19. Crétat J., Vizy K. E., Cook H. K., 2013. How well are daily intense rainfall events captured by current climate
models over Africa? Climatology Dynamics, 42, 2691-2711.
20. Djellouli, F., Bouanani, a., & Baba-Hamed, k. 2015. Caractérisation hydrologique du bassin d’Oued Louza
à l'aide d'un modèle pluie-débit global. LARHYSS Journal ISSN 1112-3680, (23), 275-286
22. Goubet, A., 1997. Les crues historiques de la Seine à Paris. La Houille Blanche, (8), 23-27
23. Gupta, H. V., Kling, H., Yilmaz, K. K., & Martinez, G. F. 2009. Decomposition of the mean squared error and NSE performance criteria: Implications for improving hydrological modelling. Journal of Hydrology, 377(1-2), 80-91
24. Hosking, J. R., Wallis, J. R., & Wood, E. F., 1985. Estimation of the generalized extreme-value distribution by the method of probability-weighted moments. Technometrics, 27(3), 251-261
25. Houndénou C., Hernandez, K. et Houssou, C. S., 1998. Variabilité pluviométrique et stratégies paysannes au nord du Bénin, in publications de l’AIC, vol. 11, pp. 185-192
26. Janicot, S., & Fontaine, B., 1997. Evolution saisonnière des corrélations entre précipitations en Afrique guinéenne et températures de surface de la mer (1945–1994). Comptes Rendus de l'Académie des Sciences-Series IIA-Earth and Planetary Science, 324(10), 785-792
27. Kamagate, B., 2006. « Fonctionnement hydrologique et origine des écoulements sur un bassin versant en milieu tropical de socle au Bénin : bassin versant de la Donga (haute vallée de l’Ouémé) ». PhD Thesis, Université Montpellier II - Sciences et Techniques du Languedoc. https://tel.archives-ouvertes.fr/tel-00193895/document.
28. Kay A.L. and Davies H.N., 2008. Calculating potential evaporation from climate model data: A source of uncertainty for hydrological climate change impacts. Journal of Hydrology, 358, 221-239.
29. Kling H., Fuchs M., and Paulin M. 2012. Runoff conditions in the upper Danube basin under an ensemble of climate change scenarios. Journal of Hydrology, Volumes 424-425, Pages 264-277, DOI:10.1016/j.jhydrol.2012.01.011
30. Kodja D. J., Vissin E.W., Amoussou E., et Boko M., 2013. Risques hydroclimatiques et problèmes
d’aménagement hydroagricole dans la vallée de l’Ouémé à Bonou (Afrique l’Ouest), in climat, Agriculture ressources en eau d’hier à demain, actes du xxvièmecolloque de l’Association Internationale de Climatologie, Cotonou (Bénin).
31. Koumassi D. H., 2014. Risques hydro climatiques et vulnérabilité des écosystèmes dans le bassin versant de la Sota. Thèse de Doctorat de l’Université d’Abomey-Calavi. 244 p.
32. Koumassi, D. H., Tchibozo, A. E., Vissin, E., & Houssou, C. 2014. Analyse fréquentielle des évènements hydro-pluviométriques extrêmes dans le bassin de la Sota au Bénin. Afrique Science: Revue Internationale des Sciences et Technologie, 10(2).
33. Le Barbé L., Alé G., Millet B., Texier H., Borel Y. et Gualde R., 1993. Les ressources en eaux superficielles de la République du Bénin. Edition ORSTOM; 540 p.
34. Le Barbé L., Ale G., 1992. Régionalisation des caractéristiques des régimes pluviométriques ponctuels béninois. Montpellier, ORSTOM, pp. 165173.
35. Le Lay, M., 2006. Modélisation hydrologique dans un contexte de variabilité hydroclimatique. Une approche comparative pour l'étude du cycle hydrologique à méso-échelle au Bénin. 2006. Thèse de doctorat. Institut National Polytechnique de Grenoble-INPG.
36. Le Moine, N., 2008. Le bassin versant de surface vu par le souterrain: une voie d’amélioration des
performance et du réalisme des modéles pluie–débit? PhD Thesis, Université Pierre et Marie Curie, Antony, 324 pp.
37. Mahé G. et Olivry J.C., 1995. Variations des précipitations et des écoulements en Afrique de l’Ouest et
Centrale de 1951 à 1989. Rev. Sécheresse n° 6, pp 109-117.
38. Mahé, G., 2006. "Variabilité pluie-débit en Afrique de l’Ouest et Centrale au 20ème siècle: changements
hydro-climatiques, occupation du sol et modélisation hydrologique." Université de Montpellier II: Montpellier, France, p160.
39. Makhlouf Z. and Michel C., 1994. A two-parameter monthly water balance model for French watersheds. In Journal of Hydrology 162, pp 299-318.
40. Mathevet, T., 2005. Quels modéles pluie–debit globaux au pas de temps horaire? Développements empiriques et comparison de modéles sur un large échantillon de bassins versants, PhD Thesis, des Eaux et des Foréts, Paris, 463 pp.
42. McKee, T. B.; Doesken N. J.; and Kleist J. 1995. “Drought monitoring with multiple time scales.”
Proceedings of the Ninth Conference on Applied Climatology; pp. 233–236. American Meteorological Society, Boston.;
43. Mouelhi S., 2003. Vers une chaîne cohérente de modèles pluie-débit conceptuels globaux aux pas de temps pluriannuel, annuel, mensuel et journalier. Thèse de Doctorat, ENGREF/CEMAGREF, Paris, 312 p. 44. Mounirou A., Laroche C., Paturel J-C., Mar A. L., 2005. Détermination de la connaissance hydrométrique
minimale nécessaire et suffisante pour une estimation raisonnable des paramètres d’un modèle de
transformation pluie-débit au pas de temps mensuel. Rapport d’activités de recherche, PNRH 2003, 134p.), 45. Nka Nnomo, B. 2016. Contribution à l'Actualisation des Normes Hydrologiques en relation avec les Changements Climatiques et Environnementaux en Afrique de l'Ouest (Doctoral dissertation, Paris 6). 46. Olivry J. C., 1983. Le point en 1982 sur l’évolution de la sécheresse en Sénégambie et aux îles du Cap-Vert.
Examen de quelques séries de longue durée (débits et précipitations). Cah. ORSTOM, Sér. Hydrol., 20 (1) : 47-69.
47. OMM 2012. Standardized precipitations index (M. Svoboda, M. Hayes et D. Wood) (OMM-N° 1090), Genève.
48. Ouarda, T. B. M. J., Lang, M., Bobée, B., Bernier, J., & Bois, P. 1999. Synthèse de modèles régionaux d'estimation de crue utilisée en France et au Québec. Revue des sciences de l'eau/Journal of Water Science, 12(1), 155-182
49. Oudin, L., Hervieu, F., Michel, C., Perrin, C., Andréassian, V., Anctil, F. and Loumagne, C., 2005. Which potential evapotranspiration input for a rainfall-runoff model? Part 2 - Towards a simple and efficient PE model for rainfall-runoff modelling. Journal of Hydrology 303(1-4), 290-306.
50. Ouédraogo M., 2001. Contribution à l’étude de l’impact de la variabilité climatique sur les ressources en eau en Afrique de l’Ouest. Analyse des conséquences d’une sécheresse persistante. Normes hydrologiques et modélisation régionale. Thèse de doctorat. Université de Montpellier II, 257 pages.
51. Paturel, J. E., Boubacar, I., L'Aour, A., & Mahé, G. 2010. Analyses de grilles pluviométriques et principaux traits des changements survenus au 20ème siècle en Afrique de l'Ouest et Centrale. Hydrological Sciences
Journal–Journal des Sciences Hydrologiques, 55(8), 1281-1288.
52. Perrin C. 2000. Vers une amélioration d’un modèle global pluie-débit au travers d’une approche
comparative, Institut National Polytechnique de Grenoble, 298 p.
53. Perrin C., Michel C., Andreassian V., 2001. Does a large number of parameters enhances model performance ? Comparative assement of common catchment model structures on 429 catchments. Journal of Hydrology , 242, pp. 275-301.
54. Perrin C., Michel C., Andreassian V., 2003. Improvement of a parsimonious model for stream flow simulation. Journal of Hydrology, 279 : pp. 275-289.
55. Ritter, A., & Muñoz-Carpena, R. 2013. Performance evaluation of hydrological models: Statistical significance for reducing subjectivity in goodness-of-fit assessments. Journal of Hydrology, 480, 33-4 56. Servat, E., & Dezetter, A. 1992. Modélisation de la relation pluie-débit et estimation des apports en eau dans
le nord-ouest de la Côte d'Ivoire. Hydrologie continentale, 7(2), 129-142.
57. St-Hilaire A., Ouarda, T. B. M. J., Lachance, M., Bobée, B., Barbet, M. & Bruneau, P. 2003. La régionalisation des précipitations: Une revue bibliographique des développements récents. Rev. Sci. Eau 16, 27–54. 58. Thauvin, V. 1992. étude de la répartition spatiale des précipitations en milieu sahélien a l'aide du réseau
dense de pluviographes de l'expérience epsat-niger (Doctoral dissertation, Thesis, Université de Montpellier 2).
59. Totin V. S. H., Amoussou E., Odoulami L., Boko M., Blivi B. A., 2016. Seuils pluviométriques des niveaux
de risque d’inondation dans le bassin de l’Ouémé au Bénin (Afrique de l’Ouest), In Actes de Colloque de l’Association Internationale de Climatologie, Besançon, pp 369-374
60. Traoré, V. B., Sambou, S., Tamba, S., Diaw, A. T., Cisse, M. T., & Fall, S. 2014. Calibrating the rainfall-runoff model GR4J and GR2M on the Koulountou river basin, a tributary of the Gambia river. American Journal of Environmental Protection, 3(1), 36-44
61. Vissin E.W., 2007. Impact de la variabilité climatique et de la dynamique des états de surface sur les
écoulements du bassin béninois du fleuve Niger. Thèse de Doctorat de l’Université de Bourgogne, Dijon, France, 280 p.
63. Yang, X., Parent, E., Michel, C., & Roche, P. A., 1991. Gestion d'un réservoir pour la régularisation des débits. La Houille Blanche, (6), 433-440