VICTORIA UNIVERSITY OF TECHNOLOGY
ADAPTIVE DEFIBRILLATOR DESIGN
A THESIS SUBMIHED FOR THE
DEGREE OF MASTER OF ENGINEERING ( ELECTRICAL )
BY HOSSIEN MAHDAVIAN
B.E. ( ELECTRONICS )
DEPARTMENT OF ELECTRICAL AND ELECTRONIC ENGINEERING.
VICTORIA UNIVERSITY OF TECHNOLOGY. FOOTSCRAY CAMPUS.
STA ARCHIVE
30001001365420
TABLE OF CONTENTS
PAGE
TABLE OF CONTENTS 1 ACKNOWLEDGEMENTS 4 LIST OF FIGURES 5 LIST OF TABLES 7
ABSTRACT 8 SUMMARY OF CONTENT 9
C H A P T E R T
1 .1 MEMBRANE POTENTIALS 1 0
1 .2 ACTION POTENTIAL 13 1.3 RHYTHMICITY OF EXCITABLE TISSUES 1 5
1 ,4 THE CIRCULATORY SYSTEM 15
1.5 THE HEART 16 1.5.1. THE STRUCTURE OF THE HEART 16
1.5.2. THE CARDIAC CYCLE 18 1.6 ELECTRICAL ACTIVITY OF THE HEART 19
1.6.1 ELECTRICAL PROPERTIES OF THE MYOCARDIUM 19
1.6.2 CELL GROUPS WITHIN THE HEART 20 1.6.3 ELECTRICAL ACTIVITY OF THE CARDIAC CYCLE 20
1.7 ELECTROCARDIOGRAM 21 1.8 THE MECHANISM OF FIBRILLATION 23
1.9 CAUSES OF FIBRILLATION 25 1.9.1 MYOCARDIAL INFARCTION 25 1.9.2 ELECTRICAL SHOCK 25
C H A P T E R 2
2.1 HISTORICAL BACKGROUND 34 2.2 CONVENTIONAL DEFIBRILLATORS 35
2.2.1 DEFIBRILLATOR STRUCTURE 35 2.2.2 EFFECT OF ELECTRICAL CURRENT WAVEFORM 39
2.3 ELECTRICAL PROPERTIES OF THE SKIN 40 2.4 REVIEW OF THE PAST WORK IN DETERMINATION OF TTR 41
2.5 DEFIBRILLATION THRESHOLD CURRENT 48
C H A P T E R 3
7 V D A . I > T X \ r : E D E F X B F g . X L I L . A . T O R . D E S X G l S r
3.1 DEFINING THE ADAPTIVE ALGORITHM 52
3.2 MEASUREMENT OF THE TTR 53 3.2.1 SINGLE SAMPLING METHOD FOR 55
DETERMINATION OF THE TTR
3.2.2 BOUNCING OF THE RELAY 55 3.2.3 SAMPLE COMPARISON METHOD FOR 59
DETERMINATION OF THE TTR 3.3 CALCULATION OF THE TIME FOR
THE BY-PASSING NETWORK TO OPERATE 59
3.4 HARDWARE DESIGN 69 3.4.1 MICROPROCESSOR SELECTION 69
3.4.2 CIRCUIT DESIGN 71 3.4.3 INDUCTOR DESIGN 74 3.5 MINIMISING THE RELAY BOUNCING 75
3.6 CIRCUIT OPERATION 76 C H A P T E R ^
E X : i > E F t . X i y i E l S r T A . X . I V I E T H O D S A-ISTD R . E S U I L . T 7 S
4.1 TEST PROCEDURE OF THE MODEL 78
C H A P T E R 5
coisTCLU s X oisr
5.1 DISCUSSION OF THE PROJECT 94 5.2 COMPARISON WITH CONVENTIONAL DEFIBRILLATORS 95
5.3 LIMITATIONS AND RECOMMENDATIONS 96 5.3.1 UTILISATION OF HIGH CURRENT-LOW VOLTAGE 97
DEVICES IN HIGH VOLTAGE APPLICATIONS
5.3.2 LINEARITY OF THE TTR 99 5.3.3 THE EFFECT OF AVAILABILITY OF HIGH VOLTAGE 100
SEMICONDUCTORS IN DEFIBRILLATOR DESIGN
A P P E N D I C E S
APPENDIX A - SPECIFICATIONS FOR DIFFERENT 103 DEFIBRILLATORS.
APPENDIX B - TIME DOMAIN SOLUTION OF THE 104 SIMPLIFIED DEFIBRILLATOR CIRCUIT.
APPENDIX C - NUMERICAL SOLUTION OF THE 107 SIMPLIFIED DEFIBRILLATOR CIRCUIT
APPENDIX D - MCU6809 MICROCOMPUTER. 113 APPENDIX E - CIRCUIT DIAGRAM OF THE HARDWARE 116
SIMULATOR USING MCU6809.
APPENDIX F - A SUMMARY OF SOFTWARE DEVELOPMENT 118 TOOLS FOR TMS320C2X DSP.
APPENDIX G - CIRCUIT DIAGRAM OF THE ANALOGUE 125 INTERFACE BOARD DEVELOPED IN FIT
FOR DSP APPLICATIONS.
APPENDIX H - SHORT FORM CATALOGUE FOR THE 126 POWER SEMICONDUCTORS BUILT FOR
DEFIBRILLATORS APPLICATIONS
B I B L I O G R A P H Y 127
R E A D I N G B I B L I O G R A P H V 131
A . C K J S I O V « 7 L E D G E i y i E l S r T S
I wish to show my appreciation to :
1- Professor Packer for his guidance during this research, without whom, the task of completing this thesis would have been difficult.
Professor Packer's suggestions which originate from his insight into Biomedical Engineering have been very valuable for me.
2- Dr. Zayegh who originally introduced and made contribution to the subject of this research program, and I am grateful for his support and supervision.
3- Dr. Malyniak for his helpful and constructive comments on the thesis.
4- Dr. Kalam for his guidamce during Dr. Zayegh's absence and corrections in the writing up stage.
L I S T O F F I G U R E S PAGE Figure Figure Figxire 1 1 1 .1 .2 .3 Figure Figure Figure Figure 1 1 1 1 .4 .5 .6 .7 Figure 1.8
A typical action potential.
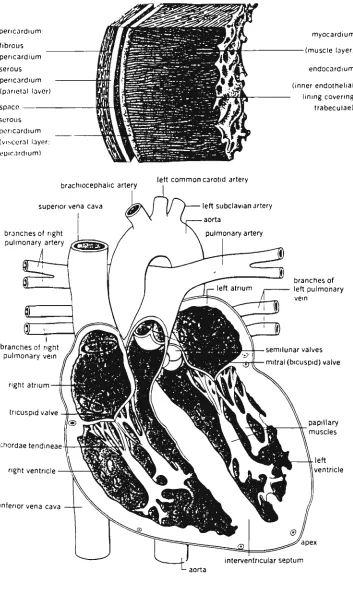
Circulatory system of human body. Cross sectional diagram of the heart showing the position of the valves and the direction of the blood flow inside the heart. Cardiac Cycle.
Pacemaker cells in the myocardium. Normal Lead II ECG.
Curve of current versus frequency above which 50% of men cannot let go of the electrodes. Schematic of an electrical instrument showing the leakage capacitances.
Figure 1.9 Macro-shock,
Figvure 1.10 ECG diagram of a heart with Atrial Fibrillation.
Figure 1.11 ECG of a heart in
Ventricular Fibrillation. Figure 2.1 The simplified circuit of a
defibrillator.
Figure 2.2 The electrical current in the circuit of Figure 2.1.
Figure 2.3 a) A-A paddles of a defibrillator, b) A-A paddle positions.
Figure 2.4 Maxwell's results in determination of the TTR value before and after the skin resistance breakdown. Figure 2.5 The TTR resistances recorded
from HP78670A and Cardiac Recorders 61A .
Figure 2.6 The defibrillation threshold
current measurement .
Figure 3. Figure 3. Figure 3. Figure 3 Figure 3. Figure 4. Figure 4. Figure 4. Figure 4. Figure 4. Figure 4 Figure 4 Figure 4 Figure 4 Figure 4 Figure 4 Figure 4 Figure 4
2 Bouncing of the relay.
3 Bouncing of the relay.
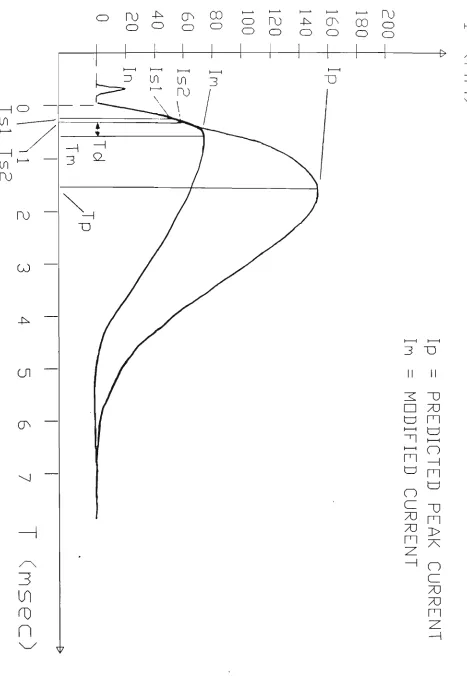
4 Modification of the current in the circuit of the hardware simulator
,5 Flow chart of the adaptive controller's operation
,6 The schematic diagram of the hardware simulator circuit. ,1 Rp = 27 ohms, 2 msec/div,
20 mV/div (not calibrated for full screen display), underdamped condition. .2 Rp = 47 ohms, 2 msec/div,
20 mV/div, critically damped condition.
.3 Rp = 100 ohms, 2 msec/div, 20 mV/div, overdamped condition.
Rp = 150 ohms, 2 msec/div, 20 mV/div, overdamped condition.
The waveforms at point BB of circuit diagram in Figure 3.6 when the controller is disabled .6 Hardware simulator.
.7 Hardware simulator and analogue interface board.
.8 The modified current for TTR = 27 ohms.
.9 The modified current for TTR = 47 ohms.
.10 The modified current for TTR = 68 ohms.
.11 The modified current for TTR = 100 ohms.
.12 The modified current for TTR = 120 ohms.
Figure 5.1
Figure B.I
Figure E.I
Figure E.2
Figure G.I
Simplified circuit for futvire work on adaptive defibrillator design. Simplified circuit diagram of defibrillator.
Schematic diagram of the simulator using MCU6809.
Illustration of the simulator, using MCU6809.
Schematic diagram of the analogue interface board for TMS320C25 DSP board.
98
104
116
117
125
L I S T O F T A B L E S
Table 3.1 Peak current in the circuit. TABLE 3.2 Calculation of Rp.
TABLE 3.3 The time at which the current in the circuit becomes 72.3335 mA. TABLE 3.4 The value of current at 100 y.sec
after the first sampling.
TABLE 3.5 The delay required for the
by-passing network.
TABLE 5.1 The peak current of the circuit if the resistance breakdown is taken into account based on the Maxwell model.
64 65 66
67
68
Defibrillators are medical equipments which are widely used to resume the normal pacemaking activities of the heart in patients with myocardivim abnormalities.
Electrical defibrillation is usually achieved by passing an electrical current pulse transthoracically through the heart of the patient. The source of this electrical current is usually a high voltage capacitor. This capacitor is charged to a voltage between 3000 and 6000 volts and then discharged via a relay through the transthoracic cavity of the patient. An inductor is used in series with the capacitor to generate an electrical current pulse with a damped sinusoidal shape
(Lown waveform) and a duration of 5-10 msec.
The successful operation of defibrillators depends on two parameters, Transthoracic Resistamce (TTR) and the peak defibrillation current.
Transthoracic Resistance is the electrical resistance, measured at the defibrillator electrodes. Peak defibrillator current is the maximum current which passes through the defibrillator electrodes and hence, through the transthoracic cavity of the patient.
During defibrillation, high TTRs cause low current and low TTRs cause high current to pass through the myocardium tissues. While high current through the heart damages its tissues, low current through the heart, may not be enough to defibrillate the heart.
current through the TTR is adjusted by switching in a by-passing
network consisting of a power switch auid a power resistor.
In this project, to simulate the operation of a defibrillator, a
hardware device with scaled values was designed and built. Also, the
algorithm proposed by this research, for the implementation of the
adaptive defibrillator, was successfully tested.
smygyLftj^Y
O F C O I S T T E I S T TIn chapter 1, the principal electrical and physiological activities of
the heart are discussed. Mechanism of fibrillation, electric shock and
defibrillation are also discussed in chapter 1,
The defibrillator's structure and a review of past work in
determination of the TTR and defibrillator threshold current is given
in chapter 2,
In chapter 3, an outline of the requirements for an adaptive
defibrillator is given. Based on this outline, a hardware model which
simulates the operation of a defibrillator is designed. Technical
considerations in designing this model and their implication in an
adaptive defibrillator are described in this chapter. The look-up
tables used for calculation of the TTR are also given in chapter 3,
Chapter 4 describes the steps taken in testing the model. The plots and
photographs of the resultant waveforms for various test resistors are
given in this chapter. The operation of the model and the results are
also discussed in chapter 4.
Chapter 5 includes a general description of the project, conclusions,
CHAPTER!
F H Y S X P L O G X C A L
A S : E > E C T SIn this chapter, the basic information of electro-physiology of a
living cell membrane is initially discussed and then used as an
introduction to myocardial tissue activities ( e.g, rhythmicity and
refractory period), Also, several aspects related to the heart and
defibrillator functions are included. Some of these aspects are
the electrocardiogram, the cardiac cycle, causes of fibrillation and
electric shock,
1 . 1 M E M B R - A I S T E E > O T E l S r T X A L S ^
Small electric potentials exist across all living cell membranes. Some
cells such as nerve and muscle cells are excitable. This means they
can generate electrochemical impulses at their membranes and they
can use these impulses to transmit signals along the membranes.
There are two basic means by which membrane potentials can develop:
1) Diffusion of ions through the membrane due to ion concentration
differences between the two side of the membrane, and
2) Active transport of ions through the membrane.
Both generate an imbalance between negative and positive charges
( hence generating a potential across the membrane ),
When a concentration difference of a single type of ion across a
membrane causes diffusion of ions through the membrane ( generating a
membrane potential ), the magnitude of the potential inside the
membrane versus the outside is determined by the following equation
( derived for body temperature SS^C ) :
concentration inside EMF (millivolts) = -61 log
concentration outside
This is the Nernst equation and the potential is the Nernst potential. Two conditions are necessary for the Nernst potential to develop as a result of diffusion:
1) The membrane must be selectively permeable, allowing a single type of ion to diffuse through the membrane while other ions do not diffuse.
2) The concentration of the diffused ions must be greater on one side of the membrane than the other side.
When a membrane is permeable to several different ions , the resultant diffusion potential depends on :
a) The polarity of the electrical charge of each ion
b) The permeability of the membrane to each ion, and
c) The concentration of the ions on the inside and outside of the membrane.
The Goldman-Hodgkin-Katz equation calculates the membrane potential when two univalent positive ions, sodium( Na*) and potassium ( K"*") and one univalent negative ion, chloride ( Cl~ ) are involved [15]:
*^Na+i ^Na+ * '-'k+i ^K+ "*• "o
^Cl-EMF (millivolts) = -61 log — r__^__^ ^Na+o % a + + "^k+o ^K+ + Cci-i
^Cl-where the C is the concentration in milli-equivalence (mEq) and P is the permeability in milli-mole/m^/sec.
Sodium, potassi\im and chloride ions are the most important ions involved in creating membrane potentials in nerve, muscle fibres
( skeletal, cardiac and smooth ) and neurones.
transport ). This is an electrogenic pump. As more positive charges result on the outside than the inside, a positive ion deficit on the inside remains. That is, the intracellular potential is negative.
This sodium-potassium pump causes a concentration gradient for sodium and potassium across the resting membrane. The ratio of the concentration of ions from the inside to the outside is:
Na+ inside/ Na* outside = 13,5/135 = 0.1 K"*" inside/ K"*" outside = 140/4 = 35.
On the other hand, there exists a channel type of transport protein in the cell membrane through which potassivim and sodium ions can leak. These channels are called potassium-sodium "Leak" channels and are 100 times more permeable to potassium than sodium.
The normal concentration of potassium ions inside the nerve fibre is approximately 140 mEq per litre and 4 mEq per litre on the outside. Hence the Nernst potential is :
EMF = -61 log 140/4 = -94 mV
On the other hand, if there is no pumping of ions through the nerve membrane and if the membrane was only permeable to sodium but not to all other ions, then :
EMF = -61 log 0,1 = +61 mV
In the resting state, the diffusion potentials alone caused by potassium and sodium diffusion would create a membrane potential of approximately -86 mV, Almost all of this being determined by the potassium diffusion. An additional -4 mV is contributed to the membrane potential by the electrogenic Na'*'-K* pump giving a total resting membrane potential of -90 mV ,
1 - 2 A . C T X O I S r I ^ O T E I S I ' r X A . U
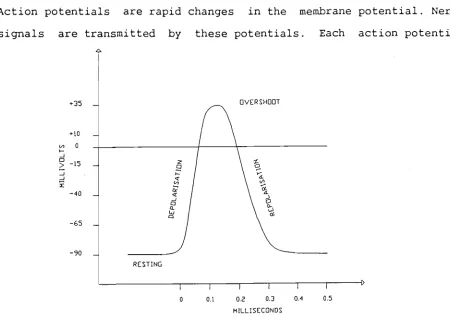
Action potentials are rapid changes in the membrane potential. Nerve signals are transmitted by these potentials. Each action potential
f35 _
no
0 5-15
- 4 0
-65 -90
DVERSHDQT
Figure 1.1 A typical action potential
begins by a sudden change from negative resting potential to a positive membrane potential and almost ends with equally rapid change back again to the negative potential, A typical action potential is shown in Figure 1,1,
At the resting stage the membrane is said to be polarised because of the negative membrane potential ( -90 mV ),
At the depolarisation stage, the membrane suddenly becomes very permeable to sodium ions allowing tremendous numbers of sodium ions to flow to the interior of the axon. In large nerve fibres, the result is that, the resting potential of -90 mV is changed to a positive potential. However, for smaller fibres and central nervous system neurones the potential only approaches the zero level with no overshoot, towards a positive voltage.
potassium ions as the sodium channels close as rapidly as they had opened. Hence the normal resting potential is re-established.
The principal factor in causing both depolarisation and repolarisation of the nerve membrane during the action potential, is the voltage-gated sodiiim and potassium channels. These two voltage-gated channels are in addition to the Na^-K* pump and Na^-K* leak channels.
As long as the membrane of a nerve fibre remains undisturbed, no action potential is generated. However, if any event causes the resting potential to rise from -90 mV to threshold level, voltage-gated sodium channels are affected and opened. This allows rapid inflow of sodium ions which increases the membrane potential further until all of the voltage-gated sodium channels are opened. But, within another fraction of a millisecond the rising membrane potential causes inactivation of the sodium channels and the action potential terminates.
An action potential occurs only when the initial rise in membrane potential is great enough. Usually a sudden rise of 15 to 30 mV in membrane potential is required to generate an action potential, (e,g, from -90 to -65 mV ), The minimum membrane potential required to generate an action potential is called the stimulation threshold
( e,g, -65 mV ),
The action potential propagates by exciting the adjacent portion of the membrane. In this way depolarisation and repolarisation are transmitted,
There exists a relative refractory period lasting one quarter to one half of the absolute refractory period during which stronger than normal stimuli can excite the fibre.
1 , 3 F g - H Y T H i y i X C X T Y O F E 3 C C X T A . B 3 L . E T X S S T J E S
If the threshold for stimulation is reduced, repetitive discharge of excitable tissues can occur. In the heart, most smooth muscles and main neurones of the central nervous system, repetitive discharges occur normally. These rhythmical discharges are the basis of the heart beat, control of breathing and peristalsis.
Rhythmicity occurs if the membrane, even in its natural state is permeable to sodium ions ( or to Ca'^'^-Na* slow channels ) to allow automatic membrane depolarisation. So for automatic depolarisation the resting potential must be only -60 to -70 mV, This voltage is not negative enough to keep closed the sodium ( or Na^-Ca** ) channels. As a result sodium and calcium ions flow inward, increasing the permeability of the membrane which increases flow of these ions. Hence a regenerative condition begins until an action potential is created.
At the end of the action potential, the membrane repolarises and shortly after, with a new action potential generated in the same way, the membrane depolarises. The depolarisation-repolarisation cycle continues again and again causing self induced rhythmical excitation.
It must be noted that due to the long refractory period of the excitable tissues, the depolarisation cannot occur immediately after the repolarisation, hence the cycle of depolarisation-repolarisation is sustained,
1 , 4 T H E C X R . C U L A . T O F t . Y S Y S T E I V I
carries these substances to a l l the tissues in the body via the blood
vessels. Figure 1.2 i l l u s t r a t e s the main features of the circulatory
system.
PULMONARY
SYSTEMIC
di i L
HEART, RIGHT HEART, LEFT
Figure 1.2 Circulatory system of h\jman body
1 , 5 T H E H E A . F t T
5 . n T H E S T R U C T U R E O F T H E H E A R T
The heart has the cardiac muscle types:
a) Atrial b) Ventricular
c) Specialised excitatory and conductive muscle.
The atrial and ventricular muscles contract the same way as skeletal muscles except that the duration of a single twitch is much longer. The specialised excitatory and conductive fibres contract only feebly because they contain few contractile fibres. These fibres, however provide an important excitatory system for the heart and a transmission system for rapid conduction of the cardiac excitatory signals through the heart.
pericardium
fibrous pericardium serous pericardium (pariolal layer)
space serous pericardium (visceral layer; epicardium)
myocardium
(muscle layer)
endocardium
(inner endothelial ining covering trabeculae)
brachiocephalic artery
superior vena cava z^.
branches of right pulmonary artery
branches of right pulmonary vein
right atrium
tricuspid valve
chordae tendineae
right ventricle
inferior vena cava
left common carotid artery
left subclavian artery
aorta
pulmonary artery
branches of left pulmonary vein
semilunar valves
mitral (bicuspid) valve
T . 5. 2, T H E C A R D I A C C Y C L E
The cardiac cycle is a two stage cycle, namely:
a) Diastole (relaxation)
b) Systole (contraction)
Figure 1,4 illustrates the relation of systole and diastole with
ventricular and aortic pressure, the valvular mechanics, atrial
pressure, the ECG and phonocardiogram.
During diastole, the atria and ventricles are relaxed. Blood returning
from the lungs and the body flows into the atria. The tricuspid and
mitral valves are both open allowing blood flow into the ventricles.
The aortic and pulmonary valves are both closed from pressure in their
outflow vessels. Hence, blood cannot flow back into the ventricles
( Figure 1.3 ) .
During systole, the heart contracts forcing blood into the arterial
system. The cycle starts with atrial systole pumping blood into the
EJECTION ISOVOLUMIC _^
CONTRACTION^
rISOVOLUMIC RELAXATION -RAPID INFLOW
-DIASTASIS
-ATRIAL SYSTOLE
X 100 H
^--AORTIC PRESSURE
ATRIAL PRESSURE VENTRICULAR PRESSURE
VENTRICULAR VOLUME
ELECTROCARDIOGRAM
ventricles. This, however, accounts for only 10-15% of the ventricles, blood volume capacity. After a brief pause, in order to allow the ventricles to fill completely, ventricular systole begins. The contraction commences at the apex of the heart and spreads towards the base of the heart, thus forcing blood out through the pulmonary and aortic valves into the arteries. Both sides of the heart contract in unison. The blood vessels convert the pulsating output of the heart
into a smooth flow of blood through the capillaries.
1 , 6 , E I l . E C T F t . X C A . 3 1 . A . C T X V X T Y O F T H E H E A J R . T
1 . 6 . 1 E L E C T R I C A L P R O P E R T I E S O F T H E M V O C A R D I U M
The myocardium cell membrane has the ability to propagate a depolarisation wave to other cells resulting in myocardial contraction. Myocardium structure is a syncytium (e.g. continuous cell membrane for all cells). Once a part is depolarised, it travels to all others ( all or nothing effect).
There are three very important differences between the electrical activity of cardiac muscle and skeletal muscle.
1. In skeletal muscle, a depolarisation wave travels at a uniform rate. In the myocardium, there are specialized high speed conductive pathways which conduct a depolarisation wave throughout the heart much more rapidly than others,
2. The duration of depolarisation and hence, of the refractory period in myocardium is approximately 100 times longer than in skeletal muscle.
1 . 6 . 2 C E L L G R O U P S W I T H I N T H E H E A R T
Figiire 1,5 shows some special cells within the myocardium. They have characteristics different from those of normal cells.
Supeiioi vena cava
Sinoatiial node Internodal pathways Alrioveniricular node
Bundle of His
SA node Aliial muscle
AV node
Right bundle branch
Comnmn bundle
Bundle branches _ » Puikinie libers
Vcntriculai muscle
ECG
Purkinie system
Icliposiciioi fascicle
Figure 1.5 Pacemaker cells in the myocardiiam [9].
I . . I O R S I I i I I I I I i L -02 04 0 6
Time Isl
The pacemaker cells, which depolarise at the fastest rate, are grouped in the Sino Atrial (SA) node located in the back wall of the right atrium. These cells depolarise at the rate of about 70 to 75 per minute. The next fastest rate is found in the Atrio-Ventricular (AV) node at the junction between the atria and ventricles. The cells in the AV node depolarise at the rate of about 60 per minute.
The highly conductive paths of the heart start with the "Bundle of His" at the AV node which spontaneously depolarise at a rate of 50 to 55
times per minute and terminate in the "Purkinje Network" whose cells automatically depolarise at a rate of 40 to 45 per minute.
The muscle cells, which make up the bulk of the heart (myocardium), depolarise at a rate of 30 to 35 per minute,
1 . 6 . 3 E L E C T R I C A L A C T I V I T Y O F T H E C A R D I A C C V C L E
which the other cells in the heart depolarise. The cells in the SA node, being the natural pacemaker for the heart, have the highest depolarisation rate. These cells depolarise and initiate a depolarisation wave. From the SA node, the depolarisation wave passes from right to left over both atria, resulting in atrial systole.
The depolarisation wave is stopped by a non-conductive layer of tissue between the atria and ventricles. At about the same time the wave reaches the AV node where specialized cells delay the progress of the wave by about 70 msec. This built-in delay is very important, as it allows atrial systole to reach completion before ventricular systole commences.
From the AV node the depolarisation wave continues in "Bundle of His" and its right and left bundle branches. The depolarisation wave rapidly travels throughout the Purkinje network- a fine mesh of faster conductive fibres which distribute to inner surfaces of both ventricles. Contraction of the ventricles commences at the apex and spreads towards the base of the heart and blood is forced out through the pulmonary and aortic valves. The resultant pressure closes the mitral and tricuspid valves.
Should the SA node stop operating, the group of cells with the next highest depolarisation rate will take over the role of the pacemaker due to their automaticity. Thus a natural back-up system exists.
The natural SA node rate is increased when the body requires more oxygen during periods of physical and emotional stress. The SA node is liberally supplied with nerve endings, which can stimulate its cells more rapidly if called for, A variety of drugs can alter the SA node rate, both speeding it up and slowing it down,
1 . V E I L . E C T F i . O C A . R . D X O G F t J V i y i
from the pacemaking activities of the heart.
Three electrodes are usually connected to the human body to detect an ECG signal. The electric potential between two electrodes is measured with respect to the third electrode namely, the reference point (earth). This method of measurement (e,g, measuring the potential of two points with respect to another point) is a differential method which is advantageous in detection of small electrical signals in an electrically noisy environment.
Depending on the position of the electrodes, three types of ECG signals are usually detected. The reference electrode is always connected to the right leg (RL),
If the second electrode is connected to the right arm (RA) and the third electrode is connected to the left arm (LA), the ECG is called Lead I, If the two electrodes are connected to RA and left leg (LL), the ECG is called Lead II, and if the electrodes are connected to the left arm (LA) and left leg the ECG is called Lead III, Figure 1,6 shows a normal Lead II electrocardiogram (ECG).
0.2 0.4
Time (s)
There are five notable points labeled P, Q, R, S and T and each point corresponds to a certain stage of the cardiac cycle.
The different parts of the Lead II ECG, can be itemised as follows:
P Wave -represents the atrial myocardiiim depolarisation.
PR Segment -represents the period for which the depolarisation
wave is delayed in the AV node, by 70 msec.
QRS Complex -represents ventricular depolarisation.
ST Segment -is the interval between the end of ventricular depolarisation and the beginning of repolarisation. This segment represents the delay caused by the extended refractory period in myocardial cells.
T Wave -as the ventricular myocardium repolarises, the
electrical cell potentials are measured as this wave,
1 , 8 T H E IVIECHA-ISrXSiyi O F F X B F t . X 3 1 . L J V T X 0 1 S r
Fibrillation is characterized by an uncoordinated contraction and relaxation of the myocardial fibres. In a normal cardiac cycle the SA node acts as a pacemaker and the resulting cycle is "Sinus Rhythm", When the ventricular myocardium fibrillates it contracts randomly and synchronous activity is lost. The heart no longer acts as a pump. There are two basic theories employed to explain the mechanism of
fibrillation.
As mentioned in section 1,3, the refractory period ensures that a depolarisation wave will not travel back upon itself and cause muscle oscillation. Under certain conditions such an oscillation can occur and is called "Circus Motion" or re-entrant excitation.
These abnormalities can result from a longer propagation pathway and decreased refractory period of the heart muscle. For example, when the heart becomes enlarged, longer propagation pathways are created and any disorder in the Purkinje system causes slower conduction of the wave. Both of these may result in circus motion, A third cause of circus motion may be due to a decreased refractory period. This sometimes results from increased cardiac excitability caused by adrenaline ( the adrenal hormone stimulating autonomic adrenergic nerve action ), sympathetic activity, or irritation of the heart as a result of disease.
In any of these cases, a resultant circus motion will cause a re-entrant excitation of the cardiac muscle resulting in fibrillation.
Fibrillation will only be sustained under the right circumstances. There is a concept of "Critical Heart Mass" below which the
fibrillation will not be sustained. An increase in temperature will cause a decrease in the refractory period which aids the re-entrant excitation.
Multiple site pacemaker activity will also result in fibrillation [37]. Such activity occurs if two or more areas of the latent pacemaker tissue become active at the same time. One cause of this is the stimulation by beta adrenergic neurohiimours. In addition, if some cells are damaged, electric potentials may be created between different areas of the cells. Cells which are not normally pacemaker in character may become pacemakers, resulting in ventricular tachycardia. If myocardial mass is large there is a greater likelihood of having multiple pacemaker sites.
1 , 9 C A U S E S O F F X B R X L L A T X O I M
9 . 1 M Y O C A R D I A L I N F A R C T I O N
When a coronary artery becomes narrowed or blocked, the myocardial tissue becomes hypoxic ( oxygen starved ) due to ischaemia ( lack of blood flow ) . Hypoxic myocardial cells may begin to act as pacemakers. Should some tissue die, it is surrounded by dying tissue which is hyper-excitable and exhibits pacemaking activity. The infarct constitutes a region of non-uniformity and the stage is set for the excitation that can zig-zag around the ventricular mass and become self sustaining (circus motion) and fibrillation occurs.
1 . 9 . 2 E L E C T R I C S H O C K
The two types of electric shock which cause fibrillation, are macro-shock and micro-shock.
Macro-shock refers to the application of electric current to the surface of the human body. The most common type of macro-shock is electrocution from a power distribution system. Other sources of macro-shock are things such as, lightening strike, and high voltage capacitor.
Power distribution systems, depending on their voltage and energy, cause different damages to living bodies. Burning of living tissue results if the energy delivery of the source is high. Fibrillation due to macro-shock, usually, results from a power distribution system.
1 . 9 . 2 . 1 M A C R O — S H O C K
In macro-shock, there is a range of frequencies (45 Hz to 65 Hz) for which, at a constant voltage, less electrical current is required to cause fibrillation. However, dc currents, and ac currents outside 45 Hz and 65 Hz can also cause fibrillation [37],
100
80
<
^ 60
40
20
TTTTT] I I I | l l l l | M M llll| I I I III!!
All I I I m i l l I I I I m i l I
10 50 100 500 1000
Frequency (Hz)
5000
Figure 1.7. Curve of current versus frequency above which 50% of men cannot let go of the electrodes [3],
As illustrated in Figure 1.7, when the frequency of the stimulating voltage increases, a larger current is required to disrupt normal activities of muscles.
In a macro-shock, current can pass through different pathways. For example, when a voltage difference exists between two points, electric shock can occur if the body of a person contacts with these two points in one of the following ways:
a) contact of two hands with two points
d) contact of two or more parts of the body with two points
In any of the above cases, the closer the pathway is to the heart, the greater the risk of fibrillation.
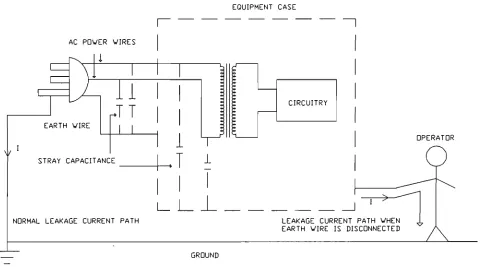
The most common type of macro-shock which results from a power distribution system (e.g., a 240 volts and 50Hz system) is shown in Figure 1.9. As the neutral conductor ( also known as the cold conductor) of a power distribution system is usually near ground potential, any contact of the body with the active conductor ( the hot or live conductor) will cause aui electrical current to pass through the body to the ground. This current results from a direct physical contact with a live conductor or it can be due to the leakage current of equipment.
In all electrical or electronic equipment there is a leakage current flow from the ac power section to the metal case of the equipment. This leakage current usually flows to ground through the ground wire in the power cord. The main source of this leakage current is the stray capacitance of the ac power sections and ground and/or the power transformer and its case. In some equipment, to reduce Electromagnetic Interferences, additional capacitors are placed between power wires and ground. These capacitors increase leakage current and their use has been limited by statuary organisations in terms of the leakage current they generate and based on their place in equipment categories (e.g. maximum 200 ]iA leakage current for hand held equipment).
If the leakage capacitance C is 20 nF, for a 50 Hz power distribution system, the leakage current calculation is as follows:
Xj, = 1/2nfC = 1 .6 X 105 n
Assuming the stray resistances and inductances are negligible then:
EQUIPMENT CASE
AC PDWER VIRES
i
• E • E E E E
CIRCUITRY
DPERATDR
LEAKAGE CURRENT PATH WHEN EARTH WIRE IS DISCONNECTED
GROUND
Figure 1.8. Schematic of an electrical instrument showing the leakage capacitances.
instrument. As shown in this figure, if the earth wire is disconnected, the case of the instrument acts as a voltage source which can supply a current equal to its leakage current. Depending on the value of this leakage current, fibrillation can result if the case of the equipment is in contact with the body.
Rechargeable, battery operated instruments, and instruments powered with dc voltage, minimise the generation of the leakage current due to 50 Hz supply. The reason is that for a dc supply f = 0, so X^, = «, and hence the leakage current is zero. This reduces the risk of macro-shock due to leakage current.
fibrillation depends on the body size, the path of the current flow and the duration of the shock application. The least current is required when the pathway is in the head-to-foot direction,
Tacker smd Geddes [37] state that the threshold of fibrillation caused by a 60Hz current can be estimated from Equation 1.1:
L O O P A
C U R R E N T P A T H
F i g u r e 1.9 Macro-shock
I = 69.4 wO-533
I = 29,7 W 0,51
I = 33.6 W 0.437
LEAD I
LEAD II
LEAD III
Equation 1,1
1 . 9 . 2 . 2 M I C R O - S H O C K
Micro-shock is the situation where the heart is affected via intravascular, intracardiac catheters or electrodes. In this case very little current is required to precipitate fibrillation. With an electrode catheter in direct contact with the heart, only 5 to 20mV is required for fibrillation. However, if the circuit connected to the heart includes a peripheral saline or blood-filled catheter, 20 to 100V is required [37],
Micro-shock occurs in medical situations. In an Intensive Care Unit (ICU), patients usually have arterial catheters for blood pressure measurements and venous pressure manometry. These catheters provide low-resistance electrical paths directly to the heart, and they increase the possibility of micro-shock. It has been suggested that micro-shock via internal electrodes may be a significant factor in
fatal accidents in operating rooms and ICUs [3], Micro-shocks of this nature involve very small currents that are well below the perception levels of staff members and thus would not be felt by them.
Macro-shock and micro-shock cause fibrillation by creating a rapid firing pacemaker or by the process of vulnerable period stimulation. The latter refers to the generation of fibrillation by the delivery of a single stimulus during the vulnerable period, i.e., during the first part of the T wave of the ECG. This is due to a lack of uniform recovery from the refractory state, and areas of block (refer to section 1.6.3) probably facilitate re-entry of propagated excitation,
1 . 9 . 3 E F F E C T O F D R U G S
fibrillation. Hypothermia increases the excitability of the myocardium and can also cause fibrillation. This is due to the increase in the propagation velocity of the pacemaking wave and the decrease in the refractory period which results in circus motion,
1 . 1 O A . T ] R X A . 3 1 . : F X B F t X 11.31. A . T X 0 1 S r
Atrial fibrillation is the un-coordinated contraction and relaxation of the atria. Hence, they do not force blood into the ventricles. The AV node is not supplied with rhythmic stimulation from the SA node. The ventricles still pump, although not to capacity, and somewhat irregularly. This condition is not life threatening. As shown in Figure 1,10, the P waves are absent and QRS complexes are temporarily irregular.
Atrial fibrillation is often converted to sinus rhythm using drug therapy. Alternatively if drugs fail, or urgency prevails, a stronger measure of "Elective Cardioversion", is applied.
Elective cardioversion is the use of synchronized electric shocks for the treatment of arrhythmias other than ventricular fibrillation.
(approximately 25 Joules) lower than the ventricular defibrillation energy, is applied to the patient,
1 , 1 1 XrEISrTIR.XCUIl.A.Fg. F X B F g . X L X . A . T X O I S r
Ventricular fibrillation (VF) is the most serious arrhythmia, VF is the im-coordinated contraction of ventricular myocardial fibres. When in VF, all pumping action is lost, and if not treated, VF is lethal within a matter of minutes (3 to 16 minutes). Figure 1.11 shows a Lead I ECG of a heart in VF.
i-l
t
ffi
^ ^ ^ j ijlii ji 1 ' uM t! 1 ' ' 1' I y\ i ' 1 1 1 1 1 ' ' ' ' ' ' ' 1j ! ! ! Il^llhl'il! ;li-l::;4""
• 111 lit i t h i n i t l i M M M l i i l r
j; ! jj
^^^^^^^^^^^^^^^^^^g
2 2 } ™
triiliH'
Hr::rtn|5^rrr
rrfrfrrrr [tTii I I I : ~
• ! • 1
^^glP
III 1 ;' !rr?
, 1 , 1 1 ; 1 ' 1 , . 1 1 1 ; [ I t
i l l l l l ' i l l ' i l T i T T T T I *T*
Figure 1.11 ECG of a heart in Ventricular Fibrillation.
1 , 1 2 D E F X B F t X X . l l . A T XOIST
Ventricular fibrillation is a very serious condition diagnosed explicitly by ECG as a zero cardiac output and might also be due to asystole ( flat ECG ). In either, death occurs in a matter of minutes.
1 . 1 2 . 1 C H E M I C A L D E F I B R I L L A T I O N
Potassium Chloride (KCl) as a cardioplegic solution can be injected directly into the coronary arteries. This renders the cells depolarised and after a few moments, fibrillation ceases. The KCl is flushed out with continued cardiac compressions and the excitability of the myocardial cells is restored. To accelerate the restoration of excitability, a small amoxint of Calcium Chloride (CaCl2) can be introduced by injection (CaCl2 increases the force of contraction), A coordinated pacemaking stimulus can then excite a coordinated contraction. Excess KCl makes the cells hypo-dynamic whereas excess CaCl2 may restart fibrillation. This technique is difficult to perform and direct access to the heart is necessary ( suitable for open heart surgery ).
1 . 1 2 . 2 E L E C T R I C A L D E F I B R I L L A T I O N
A substantial proportion of the myocardium must be rendered inexcitable to achieve defibrillation.
The most effective and reversible method of making myocardial cells inexcitable is to depolarise or hyperpolarise them by passage of an electric current pulse. Current entering a cell will hyperpolarise it. Current emerging from a cell will depolarise it.
It is very important that the method of achieving defibrillation should not damage the myocardial tissue. If the current duration and intensity is adequate the cells of the myocardium will be rendered inexcitable.
CHAPTER 2
3 1 i X T E F t A . T T J F t . E S U F t - V E Y
2 - 1 H X S T O R . X C A . X . B A . C K : O F ? . O U I S r D
In 1899, Prevost and Battelli ^ reported that a suitable electric discharge through canine ventricles was able to stop fibrillation. This observation initiated broad research activities which led to the first electrical resuscitation of a human by Paul Zoll in 1956. This event occurred after a series of research by scientists such as Hooker, Kouwenhoven, and Langworthy in the area of electrocution threshold, chemical and electrical defibrillation.
With the success of electrical ventricular defibrillation, Kouwenhoven ^ continued to investigate different waveforms for defibrillation. He originally used a 60 Hz sinusoidal current and later on pointed out the safety and portability requirements of defibrillators.
This investigation, in line with the research performed by other scientists such as Lown and others ^, resulted in the realisation of the original version of the modern defibrillator, constructed from a charged capacitor as an energy source with an inductor in series with it to generate a damped sinusoidal waveform which has been widely used till today. Although different defibrillation current pulse waveforms have been proposed by researchers [32], [12], [17], [37],
[40], the damped sinusoidal waveform is regarded to be the most efficient waveform in defibrillation.
Today, portable and compact defibrillators are available in the market which have facilities such as Electrocardiogram (ECG), synchronised defibrillation and patient resistance recorders. Although there are
still wide differences in the components used and the waveforms generated by different defibrillators supplied by different manufacturers (Appendix A ) , there exists a universal agreement that defibrillation occurs when the electrical current through the heart reaches a threshold level [21], [12], [27],
2 , 2 C 0 I S r V E l S r T X 0 1 S r A . L D E F X B F g . X X . X . A . T O F g . S
2 . 2 . 1 D E F I B R I L L A T O R S T R U C T U R E
As described earlier, most modern defibrillators generate a damped sinusoidal waveform (Figure 2,2), This type of waveform has proven to be the most effective so far and the generating circuit is relatively simple.
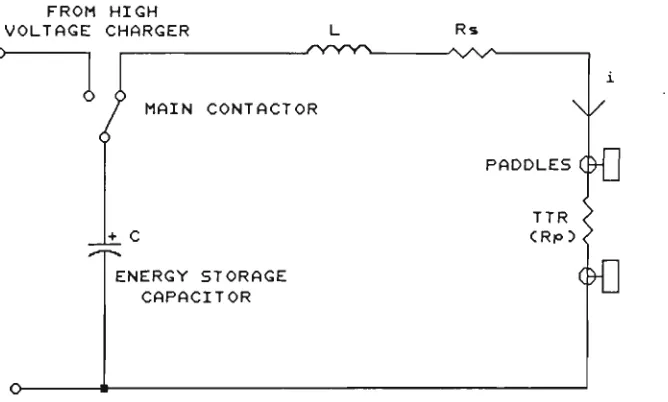
The basis of this type of defibrillator is a simple series RLC circuit (Figure 2.1) and the electric current produced is shown in Figure 2.2,
The capacitor is initially charged to a high voltage by a switched charging circuit (e.g,, a switch mode power supply). When the defibrillator is fired, the capacitor discharges through the inductor/body resistance path (Figure 2.1) and generates a damped sinusoidal waveform, the shape of which can be predicted if the circuit parameters (e.g,, initial energy, L, C, Rs and TTR) are known. To calculate the current in the circuit shown in Figure 2,1 for various TTRs, the following second order differential equation for the circuit must be solved. The solution to this differential equation will be discussed later.
FROM HIGH
VOLTAGE CHARGER L Rs
MAIN CONTACTOR \ /
PADDLES
ENERGY STORAGE CAPACITOR
c>0
TTR < C R p 5 <
^ ^
Figure 2.1 The simplified circuit of a defibrillator.
I <A)
UNDERDAMPED
CRITICALLY DAMPED
T (nSEC)
Depending on the parameters of the circuit, the resultant current waveform of the circuit after the discharge of the capacitor can be overdamped, critically damped or underdamped.
The main components in a defibrillator are the capacitor, inductor and paddles. Also, the energy delivery of a defibrillator is an important parameter in the selection of a good defibrillator.
The capacitor used has a value in the range of 16 to 45 y.F. It may be charged up to 6000V. Currently available defibrillators use single mylar or polyvinylidene flouride (K film) capacitors. The recently developed K film capacitors are reduced in size and weight by about 50% relative to older mylar capacitors.
K film capacitors are susceptible to undershoot (negative part of the waveform which occurs in the case of an underdamped situation, e.g.,
low TTR value ) and the life of the capacitor will be severely reduced if it is exposed to undershoot of over 10%. To overcome this, the preferred waveform is a critically damped sinusoid and the RLC parameters are adjustable accordingly.
The inductor (or choke) is introduced to smooth the waveform and eliminate switching spikes. The inductor, however, has a parasitic resistance which absorbs some of the stored energy.
The paddles are the defibrillator's electrodes . There are two types of external paddles.
A-P paddles are less commonly used, (although they are thought to be more effective) as a large plate-like electrode must be placed under the patient. This can be inconvenient in an emergency accident scene,
Energy selection is important in passing different currents through different TTRs. For a given defibrillator and a given TTR, the higher the energy setting, the more electrical current passes through the patient's resistance.
Energy of defibrillation is selected based on recommendations from regulatory organizations. For example, the maximum recommended energy level is 360 Joules, Older units might be capable of delivering energies up to 400 Joules.
fer^wf
PADDLES
It has been proven that higher defibrillation energies cause myocardial damage [13], [36], [38], [8], so new designs of the defibrillators need specific approval from statuary organizations if they can deliver energies of more than 400 Joules to the patient.
2 . 2 . 2 E F F E C T O F E L E C T R I C A L C U R R E N T W A V E F O R M
The first defibrillator used to defibrillate a human heart, operated with 60Hz alternating current [11], [35]. This was due to the fact that by 1933 scientists knew that the heart could fibrillate if 60Hz electrical current was passed through it and the effect of electrical current in defibrillating canine heart was known since 1899. Also, as the defibrillator was first developed in the U.S.A., 60Hz power source was used in experiments regarding fibrillation and defibrillation.
Kouwenhoven [35] was the first scientist who proposed a quantitative value of 60 Hz current for fibrillation and defibrillation in dogs. After the first successful defibrillation in a human (by Paul Zoll in 1956), Kouwenhoven started a systematic study about the effect of frequency and current in fibrillating and/or defibrillating dogs.
His main objective was to find the safest operating frequency for the power distribution system and also to find the most effective frequency and current for defibrillation.
By connecting electrodes directly to the apex of the ventricles and applying electrical current to the electrodes, he found that ventricular fibrillation could be most easily precipitated with 0.2-0.4 mA (mean value) pulses in a frequency range from 42 to 120Hz.
After Kouwenhoven 's 2801b defibrillator was successfully tested in a human, he pointed out the greater safety cuid portability of the capacitor-discharge defibrillator. His first capacitor-discharge defibrillator consisted of two 25yF capacitors charged to 2000 volts. When discharged by a relay to the thorax of the patient, one capacitor generated the positive current and the other generated the negative current through the thorax. Later on, as more scientific works were performed for safety of defibrillators, double phase (positive and negative current) defibrillators led to the modern defibrillators with damped sinusoidal waveform.
Defibrillators with a trapezoidal waveform are an important family of defibrillator used clinically. Niebauer et al [27] investigated the efficacy and safety of defibrillation with 10-millisecond trapezoidal waveforms of different tilts. They found that there were no differences in defibrillation threshold current and myocardial depression for waveforms of 10%, 45%, 65% and 80% tilt. However, they confirmed the dose-duration of current for defibrillation.
Other sources such as Tacker [34] and Peleska [29] found a higher incidence of atrioventricular (AV) block after defibrillation with a direct capacitor-discharge (no series inductor) than when a damped-sine waveform was used.
Holmes [16] also found that short-duration, high-peak current trapezoidal wave shocks produced significantly more hemodynamic impairment than longer duration, lower tilt trapezoidal wave shocks.
2 , 3 E X . E C T F t X C A . 3 :
-r > F t . O -r > E F t T X E S O F T H E S K : X l S f
In the measurement of skin resistance [22] [43], the voltage at which the measurement is made is of crucial importance.
electrodes is in the range of 2kfl to 20kn . The value may be lowered slightly by good skin preparation, which normally involves cleaning the skin with alcohol and abrasion of the stratum corneum with emery paper. This low skin resistance is desirable when measuring ECG, EMG and EEG.
On the other hand, when the resistance between the paddles of a cardiac defibrillator is measured, it has a value of 25SI to 125n at peak defibrillation current [21]. This peak value of current is usually in the range of 25A to 100A. The voltage between the two paddles varies from 3000V to 6000V depending on the defibrillator internal circuitry and patient resistance.
Maxwell [22] showed that this enormous change in resistance was due to a phenomenon known as the skin resistance breakdown. He found that
50visec after the initiation of the defibrillation pulse, the skin resistance drops to a value not more than 500fi ,and that there are negligible changes in the skin resistance after 200p.sec,
Until this time, little research has been done to understand the behaviour of the TTR during the early stages of a defibrillator pulse.
Some researchers [21] [2] have recorded the TTR diiring defibrillation, but these records show the TTR at the peak defibrillator current, and do not show the behaviour of the skin resistance at the early stage of application of the defibrillator pulse.
Also, records from different research groups, have some major differences in the measurement of the TTR. Some of the discrepancies in different records from various sources can be explained by studying Maxwell's results. These discrepancies will be discussed and results summarised in the next section.
defibrillators has been static for many years. A low voltage ac signal is applied to the chest and the current is measured and hence the TTR can be estimated. For instance, the HP78670A defibrillator uses a 31.25 kHz signal to measure the TTR. This method does not take into account the skin resistance breakdown which is due to a high voltage/current presence during the shock.
Before the evolution of the most recent generation of defibrillators, Geddes et al [14] had first tried to predict the TTR and the threshold current for defibrillation from the physical characteristics of the patients. They had assumed that the TTR and threshold current changed with physical conditions such as weight.
Although they found linearity between current dose and weight, there were some exceptions. Hence, this method did not seem accurate. Other experiments were performed so as to predict the Transthoracic Resistance and the defibrillation threshold current.
They selected 71 dogs and applied a low level sinusoidal signal (1mA constant current, 10-500 kHz) to measure the resistance between the paddles. Then they applied electric shocks to the anaesthetized dogs and calculated the resistances between the paddles by measuring the currents through and voltages across the paddles during the defibrillation,
By comparison of the low level ac voltage measurement of the TTR and the actual resistances measured during the high voltage shock, they concluded that both results were similar if the low level signal frequency was 29 kHz, This might be the reason why the Hewlett-Packard defibrillator uses a 31.25 kHz low level signal to estimate the TTR, This method may also be questionable for the following reasons:
First, because the tests by Geddes et al [14] were performed on dogs and the behaviour of the human TTR might be different.
Maxwell [22] and Tulloh [43] measured the human TTR during actual defibrillations. The method they both employed to measure TTR was similar in principle. They both measured the current and voltage of the paddles during the application of the shock (defibrillation process) and hence calculated the TTR.
Tulloh [43] used sleeves of aluminium foil around the cables which connected the internal circuit of the defibrillator to the paddles. The voltage induced in the capacitance between each paddle and its corresponding sleeve was used as a potential divider to represent the voltage between the paddles. This was done to provide Class B isolation required by safety standards. Tulloh reported difficulties in calibration of the circuit due to the movement of the aluminium sleeves inside the equipment. These difficulties arose from the change in capacitance between each cable and its corresponding sleeve as a result of physical movement of the cable inside the defibrillator enclosure. It seemed that the sleeves were displaced by the high level of Electro-Magnetic Interference (EMI) resulting from the contactor switching (this effect is analogous to the physical movement of a conductor in an electric or magnetic field),
Maxwell [22], however, used optocouplers to sense the voltage across the paddles and hence recorded successful results in the measurement of the TTR. In Maxwell's work, the values of current and voltage of the patient's TTR were converted to digital values using two 8 bit A / D converters. These values were saved in a battery backed memory array during real defibrillations. Then, they were extracted and taken to a computer for analysis. Some of these results are shown in Figure 2.4 . These results are very valuable for understanding the TTR's behaviour at the early stage of the application of the defibrillation pulse.
peak cxirrent and the patient resistance) of the HP78670A defibrillator with the Maxwell technique in recording the Transthoracic Resistance.
The HP defibrillator uses a look-up table to calculate TTR. The TTR value and other data related to the test condition such as delivered energy and peak defibrillation current is recorded after each defibrillation. This method is based on the peak current measurement of defibrillation and the solution of the second order differential equation based on known parameters of the defibrillator [2]. This method assumes that the patient resistance is linear and does not provide any data in relation to the breakdown of the TTR.
As Maxwell showed the behaviour of the skin resistance during defibrillation, it is necessary to discuss his results in more detail and compare them with results from other sources.
In the 17 records he collected, it is observed that 50)isec after the initiation of the pulse the skin resistance falls to the range of 50-500 ohms and from 200visec on there is little difference in TTR value.
Maxwell stated that if the skin resistance is measured by an ohm meter (e.g. a digital multimeter, DMM) at any two arbitrary points (e.g. between left and right hands), a value in the kn (e.g. 5kn) range should be expected (this value depends on pressure on electrodes, skin preparation , etc.). He stated that this high resistance is due to the low voltage/low current measurement . In his work he showed that during the real defibrillation as the transthoracic cavity of all of the 17 patients were exposed to high voltage and current, the value of their TTRs dropped to a value between 25 and 125 ohms. The decrease in TTR occurred in the first 200 y.sec after the initiation of the defibrillation pulse and reached a value between 25 and 125 ohms at the peak defibrillator current.
OHns
350 300 250 200 150 100 50 0
0 100- 200
nnE us
owns
OHns
100
nnE us
100 200
results that he collected from a HP78670A showed a range between 40 and 150 ohms and a mean value of 86.8 ohms. Both results have been reported to be the TTR values at the peak defibrillator current (Figure 2.5).
It can be seen that compared to the Cardiac Recorders 61A, the HP78670A recorded a higher mean value of TTR.
Some of the differences are expected because the HP78670A does not use a conductive gel in the defibrillation process, while the Cardiac Recorders 61A does. It has been reported by Tacker and Paris [37] that using good quality conductive gel can decrease the TTR by 19%.
Other parameters such as pressure on the paddles and physiological characteristics of patients are also important and may have caused the differences in TTR measurements, [39], [24], [18], [17], [6], [7],
[40], [5], [10],.
In general, it is difficult to compare the results from different sources in the measurement of the TTR, This is because there are many parameters in defibrillation that affect the TTR measurement. These parameters are, the paddle sizes, skin preparation, pressure applied on paddles, physical conditions of the patients, interface material between the skin and the paddles, nxomber of counter-shocks, energy setting of the defibrillation and the internal parameters of the defibrillator,
25 23
c 21
t 19
17
15
13
11
9
7
5 3
1
2 - 58-2
25 35 IS 55 65 75 85 95 105
z. n Cardiac Recorders
17 ">• 15
Of
«t: H
9 7 5
3[
1
Z = 86-8
m m n
O) 50 50 70 80 90 100 110 120 130 1W 150z, n Hewlett-Packard
In the process of this research, a software program (Appendix C) was developed to determine if the skin resistance breakdown had any effect on this difference in recording of the TTR by the HP and Cardiac Recorder defibrillators. In this software program, based on the data from Maxwell's research, the skin resistance breakdown was simulated and the current in the circuit of Figxire 2.1 was calculated (a nonlinear TTR, e.g., TTR value was assumed to be 5000ft for the first
50 >isec and then 50ft for the rest of the calculation). The results were compared with the condition that no TTR breakdown occurred (linear TTR, e.g., son for all time). The comparison showed that, for the calculation of the look-up table values for the adaptive defibrillator, TTR could be assumed linear. However, a skin resistance breakdown coefficient must be considered in calculation of the values tabulated in the look-up tables. It means that the defibrillator current waveform can be approximated by a damped sinusoidal waveform which has been shifted in time by 50 ysec. Hence a linear model (no skin resistance breakdown) can be used to solve a nonlinear process ( skin resistance breakdown).
The software simulation also explained why the results from the HP defibrillator and Cardiac Recorder defibrillator, in measurement of the TTR were different.
In chapter 5, a quantitative comparison is given between the linear and non-linear model of the skin resistance (skin resistance breakdown) based on the software simulation.
2 , 5 D E F X B R . X X . L A T X 0 1 S r T H F g . E S H O X . D C U F g . r t E l S r T
It is universally accepted that for successful defibrillation, the electrical current passing through the heart has to reach a threshold level, [25], [31], [12], [37], [19], [38].
heart and measured the pressure inside the heart ventricles. The pressure and the visual observation of the heart were referred to as a measure of defibrillation. Then they recorded the current at which the defibrillation occurred as the defibrillation threshold current.
% O«pr»»s>on" A „ - A ,
tlOQ
Figure 2.6 The defibrillation threshold current measurement [12].
Monzon and Guiller [25] designed a simulated current mode defibrillator on the basis that current defibrillates. They proposed that in a defibrillator the storing element could be an inductor rather than a capacitor. They stated that by switching off the energizing path of an inductor with no path other than the Transthoracic Resistance of the patient, due to the stored energy in the inductor, the defibrillator will act as a current source and no matter what the patient resistance is, the same initial peak current would result from the defibrillation.
The main problem with this technique (the circuit was realized with lower energy capacity than commercial defibrillators) is that the proposed equipment to deliver energy levels up to 400 Joules is bulky and cannot be implemented in practice except in coronary care units as a fixed (non-portable) defibrillator. However, one of the major characteristics of a practical defibrillator is its portability.
In the case of ventricular fibrillation (no blood pumping), death will occur in 3 to 16 minutes. So it is necessary for a current mode defibrillator to be portable so that ambulance personnel can carry the equipment to the victim especially at the scene of an accident.
McDaniel and Schuder [20] introduced an algorithm to determine the defibrillation threshold current. This algorithm was based on computer simulation and basic theory of probability involving an assumed underlying dose-response relationship. They stated that higher accuracy at the expense of a higher number of fibrillation episodes was achieved in determining the defibrillation threshold current.
CHAPTER 3
7 \ . D A . E > T X V E D E F X B F g . X L X . A . T 7 0 F t D E S X C I M
3 , 1 D E F X I S T X I S I G T H E
A . D A . I > T X V E A - L G O R - X T H M :
From the discussion in chapter 2 about the TTR and defibrillation threshold current, the following hypotheses can be made:
a) The Transthoracic Resistance breakdown occurs at approximately 50 ^sec after the initiation of the current pulse, and, after 200 )isec, there is a negligible change in TTR value.
b) There are differences in the lower and higher values of the measured TTR from different sources. However, the range of 25 to 125 ohms has been widely recorded.
c) The major factor in effective defibrillation is the peak defibrillation current achieved with a 5-10 msec damped sinusoidal waveform. Hearts of hviman subjects can be defibriHated with about
1 A (peak)/kg of body weight [37],
d) The peak current flowing through the patient can be modified by switching in an appropriate by-passing resistive network.
Based on the above conclusions, the adaptive defibrillator has to:
a) Measure the TTR before the occurrence of the peak current.
b) Predict from the look-up tables the peak electrical current and the time it flows through the heart. If this peak current exceeds the defibrillation current threshold level, calculate the time that the switching network has to operate in order to by-pass the excess energy.
d) Switch in the by-passing network.
The defibrillator is set to a level of energy which can deliver the required threshold current density to the patient with the highest Transthoracic Resistance of 125 ohms.
3 - 2 iyiEA.STJFt.EiyiEISrT O F T H E T T F t
The circuit of a Lown (damped sinusoidal) waveform defibrillator is modelled in Figure 3.1 As all the parameters of the circuit are known (i.e., L, C, Rg and V(0)), the patient's TTR (Rp) can be found at any time by measuring the current in the circuit.
Figure 3.1 The simplified model of a Lown waveform defibrillator.
To calculate the relationship between the current in the circuit and the resistance Rp, the differential equation of Equation 3.1 must be solved.
L di2/dt2 + (Rg+Rp)di/dt + 1/C i = 0 Equation 3.1
Assuming Rp is constant, if i(t) is measured, and since the initial voltage of the capacitor V(0), capacitance C (and hence the energy level), inductance L, and series resistance Rg are known, Rp or the Transthoracic Resistance can be found by solving the above equation.
Alternatively, this equation can be solved for i(t) for a range of TTRs (e.g. 25 to 125 ohms) in increments of say 5 ohms (depending on the required accuracy of the system). A look-up table can then be set up indicating the peak current associated with each TTR.
For instance, if a defibrillator has the following parameters,
C = 33 >iF, L = 50 mH, Rg = lift, V(0) = 4671 V
(from which its energy setting , W = 1/2,C,V^ is 360 Joules), by measuring the current i(ti) at t = ti the value of Rp or TTR can be
found.
The solution of the differential equation is monolithic and there is just one value of TTR that can result in the measured current at time t = tj.
The second order differential equation can be solved by classical methods ( Laplace Transform ) or numerical methods. Appendix B gives the classical solution of the above equation.
To investigate the validity of the concept in practice, a simulated defibrillator was designed with low capacitor voltage and energy level. The parameters of this simulated circuit were selected as follows:
C = 30 vF, L = 53.3 mH, Rs = 15 ft, V(0) = 12 V
current of the circuit is measured, then from this table, the TTR can be found. Alternatively, if TTR is known then the peak current can be found.
3 . 2 . 1 S I N G L E S A M P L I N G M E T H O D F O R D E T E R M I N A T I O N O F T H E T T R
The algorithm for the operation of the adaptive controller which had been originally proposed, can be siommarised as follows:
a) Initiate the defibrillation pulse.
b) Measure the current at a time greater than 50 )isec (after the break down) after the initiation of the pulse and well short of the required threshold current occurrence at the worst case condition
(374 usee, refer to Table 3.3), say at 200 usee after the initiation of the pulse.
c) Obtain the TTR from a look-up table for t = 200us.
d) Calculate the time at which the peak current will occur and the time that the controller must wait for the current to reach the threshold value.
e) Switch in the by-passing network to modify the current.
As discussed in the next section, due to bouncing of the relay, it was not possible to identify the initiation time of the pulse, so the current had to be measured at two stages in order to calculate the TTR.
3 . 2 . 2 B O U N C I N G O F T H E R E L A V

![Figure 1.4. Cardiac cycle [15]](https://thumb-us.123doks.com/thumbv2/123dok_us/7935097.1317482/21.561.82.521.476.772/figure-cardiac-cycle.webp)
![Figure 1.7. Curve of current versus frequency above which 50% of men cannot let go of the electrodes [3],](https://thumb-us.123doks.com/thumbv2/123dok_us/7935097.1317482/29.561.144.403.118.424/figure-curve-current-versus-frequency-men-let-electrodes.webp)

![Figure 2.4 Maxwell's results [22] in determination of the TTR value before and after the skin resistance breakdown](https://thumb-us.123doks.com/thumbv2/123dok_us/7935097.1317482/48.561.61.458.29.758/figure-maxwell-results-determination-ttr-value-resistance-breakdown.webp)