Clinical Interventions in Aging
Dove
press
O r I g I n A l r e s e A r C h open access to scientific and medical research
Open Access Full Text Article
effects of age, sex, and ethnicity on bone health
status of the elderly in Kuala lumpur, Malaysia
Kok-Yong Chin1
Alia Annessa Ain
Kamaruddin2
nie Yen low2
soelaiman Ima-nirwana1
1Department of Pharmacology,
Faculty of Medicine, Universiti Kebangsaan Malaysia Medical Centre, Cheras, Kuala lumpur, 2AsAsIpintar,
PerMATApintar national gifted Centre, Universiti Kebangsaan Malaysia, Bangi, selangor, Malaysia
Background: Osteoporosis is a significant health problem in the developing countries and its prevalence data are important for the estimation of health care burden and policy making. This study aimed to determine the age-related changes in bone health and the prevalence of osteo-porosis in males and females aged 50 years or above living in Kuala Lumpur, Malaysia.
Methods: A cross-sectional study was conducted between December 2014 and December 2015. Subjects answered a demographic questionnaire and underwent body anthropometric and bone health measurement. Assessment of bone health was performed using a quantitative ultrasound device that generated speed of sound, broadband ultrasound attenuation, stiffness index, and T-score based on stiffness index value as bone health indices.
Results: The prevalence of osteoporosis was 10.6% in males and 8.0% in females. Significant age-related decline of bone health indices (speed of sound, broadband ultrasound attenuation, stiffness index, and T-score) and a concurrent increase in the prevalence of osteoporosis and osteopenia were observed in females (P,0.05) but not in males (P.0.05). Ethnic differences in bone health indices and prevalence of osteoporosis/osteopenia were not observed (P.0.05).
Conclusion: A significant proportion of males and females age 50 years or above have suboptimal bone health. Preventive measures such as early screening should be implemented to retard the progression of osteoporosis.
Keywords: aging, osteopenia, osteoporosis, prevalence, T-score
Introduction
Osteoporosis is a systemic metabolic bone disease defined by low bone mass and disintegration of bone microarchitecture, leading to bone fragility and ultimately fracture.1 Clinically, osteoporosis is diagnosed based on bone mineral density (BMD)
determined using dual-energy X-ray absorptiometry (DEXA) because it is predictive of fracture.2 However, accessibility to DEXA is limited especially in the developing
countries.4 Quantitative ultrasound (QUS) devices offer a solution to this problem. Bone
health indices generated by QUS were found to correlate significantly with BMD and fracture risk.5–8 The QUS device is safe, easy to handle, and portable, thus, permitting
its use in mass screening of bone health and epidemiological studies.9
The effects of age and sex in bone health are well documented. Incidence of fragility fractures increases and BMD declines with advancing age.10,11 Global prevalence of
fragil-ity fracture showed a female-to-male ratio of 7 to 3.12 This is in accord with a higher BMD
and QUS values found in males compared to females.13,14 Ethnicity is also an important
determinant of bone health. This is evidenced by the significant ethnic disparity in the prevalence of osteoporosis among the Non-Hispanic Whites, African Americans, and Hispanics in the US.14,15 Survey on hip fracture incidence among Malaysian populations
consisting of the Chinese, Malays, and Indians also revealed distinct ethnic differences.10
Correspondence: soelaiman Ima nirwana Department of Pharmacology, Faculty of Medicine, Universiti Kebangsaan Malaysia Medical Centre, Jalan Yaacob latif, 56000 Cheras, Kuala lumpur, Malaysia Tel +60 39 145 5002
Fax +60 39 145 6633
email imasoel@ppukm.ukm.edu.my
Journal name: Clinical Interventions in Aging Article Designation: Original Research Year: 2016
Volume: 11
Running head verso: Chin et al
Running head recto: Effects of age, sex, and ethnicity on bone health status of the elderly DOI: http://dx.doi.org/10.2147/CIA.S108772
Clinical Interventions in Aging downloaded from https://www.dovepress.com/ by 118.70.13.36 on 20-Aug-2020
For personal use only.
Number of times this article has been viewed
This article was published in the following Dove Press journal: Clinical Interventions in Aging
Dovepress
Chin et al
Several small-scale bone health studies have been conducted in Malaysia using QUS devices in females and a study has been performed in males.17–20 Subjects included in these
stud-ies were not reflective of the Malaysian population because they captured bone health in a limited subset of the diverse ethnic groups in Malaysia.21 Since the report of Lee and Khir
on hip fracture incidence in 1997,10 more comprehensive and
updated data on ethnic difference in bone health in Malaysia are not available. In bridging the knowledge gap, we could identify groups susceptible to osteoporosis and device suitable interventions to retard the progression of the disease.
The current study aimed to determine the age-related changes and prevalence of osteoporosis and osteopenia in males and females aged 50 years or above in Kuala Lumpur, Malaysia. Three major ethnic groups, that is, the Malays, Chinese, and Indians, representing 99.3% of the Malaysian population will be included in this study.21 A calcaneal
QUS device was selected as the bone health screening tool as per the recommendation of the International Society of Clinical Densitometry.22 Males and females aged 50 years or
above were the focus of this study because previous studies highlighted that fracture incidence increased after the age of 50 years.12 We hypothesized that there were significant
age-related changes and ethnic discrepancy in bone health in the Malaysian population.
Materials and methods
This cross-sectional study was conducted from December 1, 2014 to November 31, 2015 at Universiti Kebangsaan Malaysia Medical Centre. A purposive sampling method was adopted and subjects recruited were Malaysian males and females aged 50 years old or above living in Kuala Lumpur and its environs. The subjects were solicited onsite without prior invitation. Subjects previously diagnosed with osteoporosis, hyper/hypoparathyroidism, or hyper/hypocalcaemia and/or were receiving pharmacological treatment for osteoporosis (bisphosphonates, teriparatide, denosumab, and strontium ranelate) or other treatments, which could significantly impact bone metabolism (hormone-replacement therapy, sex hormone deprivation therapy, glucocorticoids, and thyroid supplements) were excluded. Those with mobility problems, with implant in their lower limbs, or could not complete the questionnaire or screening procedure were excluded as well. The subjects were informed of the project details and pro-vided written consent before participating in the study. The study protocol was reviewed and approved by the Research Ethics Committee of Universiti Kebangsaan Malaysia Medical Centre (approval code: UKM-AP-TKP-09-2009).
Subjects completed a demographic questionnaire before undergoing the screening process. The age of the subjects was calculated based on records in their identification cards. Ethnicity, sex, and presence of preexisting medical condition(s) and medical treatment(s) were self-declared. Standing height of the subjects without shoes was measured using a stadiometer (Seca, Hamburg, Germany) and recorded to the nearest 1 cm. Body weight of subjects with light clothing but without shoes was determined using a weighing scale (Tanita, Tokyo, Japan) and was recorded to the nearest 0.1 kg. Body mass index (BMI) was calculated as per the convention. Bone health of the subjects was assessed using a water-based QUS device (Achilles EXPII, GE Healthcare UK Ltd, Little Chalfont, UK). During the scanning, the subjects were required to sit on a chair and place their right foot on the food pad. The inflatable transducer transmitted ultrasound waves across the right calcaneal bone and the signal received was measured and analyzed. Subjects were measured three times with repositioning and the average values were taken. Trained technicians were responsible for the measurements. Quality control and calibration were per-formed daily using a phantom. Short-term in vivo coefficient of variation for the device was ,2.0%. The device generated three bone health indices, namely, speed of sound (SOS), broadband ultrasound attenuation (BUA), and stiffness index (SI). Calcaneal SOS is the SOS waves traveling though the calcaneus and bears the unit of meter per second (m/s). The SOS value is directly proportional to BMD value. Calca-neal BUA is the slope between attenuation of sound signals while traveling through the calcaneus and its frequency and the unit is dB/MHz. Stronger bones preferentially attenuate sound waves of higher frequencies. SI combines SOS and BUA values using the formula SI = ([0.67× BUA] + [0.28×
SOS] -420) and has a lower precision error than either SOS or BUA alone. In general, higher SOS, BUA, and SI values indicate better bone health.9,23
T-score generated based on the SI was used as the basis for bone health classification. It is different from T-score based on BMD obtained from DEXA, which is used to diagnose osteoporosis clinically. In this study, bone health of subjects was classified into normal (T-score more than -1.0), osteopenia (T-score between -2.5 and -1.0), and osteoporo-sis (T-score less than -2.5) based on sex-specific reference values obtained from Mainland Chinese population provided by the manufacturer due to the absence of local reference. The term “normal” indicated a low risk for osteoporosis, “osteopenia” indicated a moderate risk for osteoporosis, and “osteoporosis” indicated a high risk for osteoporosis.
Clinical Interventions in Aging downloaded from https://www.dovepress.com/ by 118.70.13.36 on 20-Aug-2020
Dovepress effects of age, sex, and ethnicity on bone health status of the elderly
statistical analysis
Normality of the data was assessed using Kolmogorov– Smirnov test. Skewed data were transformed for analysis. Subjects were categorized according to age groups (5 years interval), sex, and ethnicities for the comparison of bone health indices. Comparison of characteristics between male and female subjects was performed using independent t-test. Comparison of bone health indices between ethnicities and age groups was performed using univariate analysis with adjust-ment for BMI. Pair-wise comparison of bone health indices between selected age groups was done using Gabriel’s post hoc test. The BMI adjusted age-trend of all three bone health indices was examined using multiple linear regression analy-sis. Age and BMI were entered into the multiple regression analysis via the forced entry method. Differences in the pro-portion of subjects in each bone health category according to sex, ethnicity, and age group were analyzed using chi-square. Significance value was set at P,0.05. Statistical analysis was performed using Statistical Package for Social Science Version 21 (IBM Corporation, Armonk, NY, USA).
Results
A total of 772 male and female subjects enrolled in this study, but 127 were excluded based on the exclusion criteria (40 for the use of hormone-replacement therapy, 30 for the use of antiosteoporotic agents, eleven for the use of glu-cocorticoid, 44 for the use of thyroid supplement, and two did not complete the screening process). The 645 subjects included in the final analysis consisted of 283 males (mean age: 63.38 years [standard deviation (SD): 7.41 years]) and 362 females (mean age: 61.69 years [SD: 7.52 years]). Ethnic distribution for males was 38.9% Malays, 49.5% Chinese, and 11.7% Indians, while for females was 34.3% Malays, 57.5% Chinese, and 8.3% Indians. The males were significantly older, taller, and heavier, and had a higher BMI compared to
females (P,0.05). Their SOS, BUA, and SI values were also higher compared to females after adjusted for BMI (P,0.05). However, their BMI-adjusted T-score was significantly lower compared to their female counterparts (P,0.05) (Table 1).
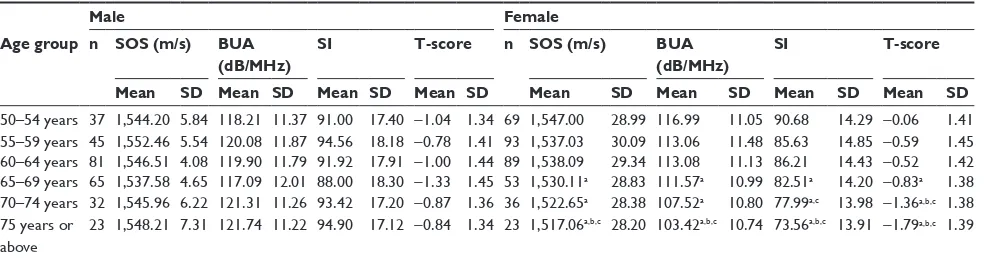
Age-related decline in bone health, as indicated by SOS, BUA, SI, and T-score, was significant in females but not in males. The values of these indices started to decrease significantly at the age of 65 years for females (P,0.05). In comparison, the bone health indices of males did not show significant age trend (P.0.05). The results persisted after adjustment for BMI of the subjects (Table 2). No significant association was found between age and indices of bone health in males as a whole and among the different ethnic groups after adjustment for BMI in the linear regression analysis (P.0.05). On the other hand, there were significant nega-tive associations between age and indices of bone health in females (P,0.05). As the age increased by 1 year, the SOS reduced by 1.136 m/s, BUA by -0.438 dB/MHz, SI by 0.607 unit, and T-score by 0.06 unit in females as a whole. Similar decline was observed in Malay and Chinese females but not in Indian females probably due to the small sample size of that particular ethnic group (Table 3).
Table 1 Basic characteristics of the subjects
Variables Male (n=283) Female (n=362) P-value Mean SD Mean SD
Age (years) 63.38 7.41 61.69 7.52 0.004
height (cm) 165.87 7.21 153.70 5.64 ,0.001
Weight (kg) 71.07 12.32 60.36 11.25 ,0.001
BMI (kg/m2) 25.95 4.20 25.59 4.67 0.307
sOs (m/s) 1,544.45 37.01 1,535.39 37.76 0.009
BUA (dB/Mhz) 119.33 12.85 112.65 13.26 ,0.001
sI 91.33 17.80 84.67 18.21 ,0.001
T-score -1.04 1.68 -0.66 1.67 0.002
Abbreviations: BMI, body mass index; BUA, broadband ultrasound attenuation;
sD, standard deviation; sI, stiffness index; sOs, speed of sound.
Table 2 Body mass index-adjusted bone health indices according to age group
Male Female
Age group n SOS (m/s) BUA (dB/MHz)
SI T-score n SOS (m/s) BUA (dB/MHz)
SI T-score
Mean SD Mean SD Mean SD Mean SD Mean SD Mean SD Mean SD Mean SD
50–54 years 37 1,544.20 5.84 118.21 11.37 91.00 17.40 -1.04 1.34 69 1,547.00 28.99 116.99 11.05 90.68 14.29 -0.06 1.41 55–59 years 45 1,552.46 5.54 120.08 11.87 94.56 18.18 -0.78 1.41 93 1,537.03 30.09 113.06 11.48 85.63 14.85 -0.59 1.45 60–64 years 81 1,546.51 4.08 119.90 11.79 91.92 17.91 -1.00 1.44 89 1,538.09 29.34 113.08 11.13 86.21 14.43 -0.52 1.42 65–69 years 65 1,537.58 4.65 117.09 12.01 88.00 18.30 -1.33 1.45 53 1,530.11a 28.83 111.57a 10.99 82.51a 14.20 -0.83a 1.38
70–74 years 32 1,545.96 6.22 121.31 11.26 93.42 17.20 -0.87 1.36 36 1,522.65a 28.38 107.52a 10.80 77.99a,c 13.98 -1.36a,b,c 1.38
75 years or above
23 1,548.21 7.31 121.74 11.22 94.90 17.12 -0.84 1.34 23 1,517.06a,b,c 28.20 103.42a,b,c 10.74 73.56a,b,c 13.91 -1.79a,b,c 1.39
Notes: Alphabets indicate significant difference between the denoted group with a50–54 years; b55–59 years; c60–64 years. Abbreviations: BUA, broadband ultrasound attenuation; sD, standard deviation; sOs, speed of sound.
Clinical Interventions in Aging downloaded from https://www.dovepress.com/ by 118.70.13.36 on 20-Aug-2020
Dovepress
Chin et al
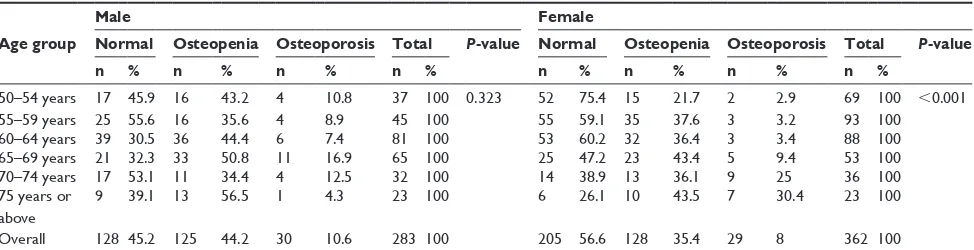
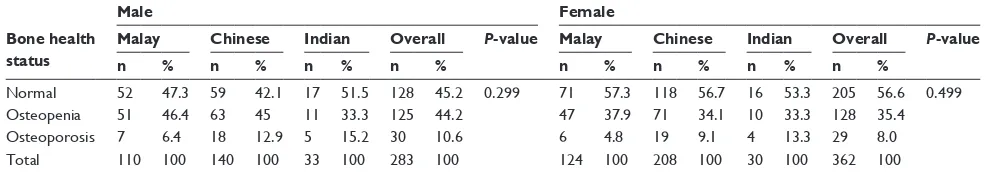
In addition, bone health status of the subjects differed significantly by age groups in females but not in males (P,0.05). The proportion of females classified as osteoporo-tic increased significantly in the older age group but this was not observed in males. Overall, 44.2% of the males and 35.3% of the females studied were osteopenic, while 10.6% of the males and 8.1% of the females were osteoporotic (Table 4). There was no difference in terms of bone health among the three ethnic groups studied (P.0.05) (Table 5).
Discussion
The prevalence of osteoporosis is surging in the develop-ing countries due to the increase in lifespan and elderly population.24 Despite this, information on bone health status
of the Malaysian population, which is important for assessing the health care burden of osteoporosis and health policy mak-ing, is limited. The current study revealed that a significant proportion of Malaysian males (54.8%) and females (43.4%) had suboptimal bone health. Despite the higher prevalence of suboptimal bone health in males compared to females, the age-related decline of bone health indices was not significant in males. Ethnic differences in bone health were not observed
in the study population as the age-related decline of bone health indices and the prevalence of suboptimal bone health were uniform across all three ethnic groups.
There were several small-scale studies determining the prevalence of osteoporosis in the Malaysian population using QUS. Most studies only recruited female subjects.18–20
A study by Hasnah et al19 reported that among the 125
post-menopausal Malay females (mean age: 59 years [SD: 4] years) assessed using a QUS device, 6% were osteoporotic and 37% were osteopenic. Damodaran et al18 observed that
among 164 perimenopausal and postmenopausal females attending a menopause clinic, only four (2.44%) were osteo-porotic. The low prevalence could be due to the fact that those attending the menopause clinic were health conscious individuals. A previous study conducted by Chin et al17 on
Malaysian males using a QUS device (mean age: 47.9 years [SD: 14.3 years]) identified that the prevalence of osteopenia was 21.3% and osteoporosis was 2.6%. This was lower com-pared to the findings of the current study, whereby 45.2% of males were classified as osteopenic and 10.6% were classified as osteoporotic. Besides, Chin et al17 reported no significant
difference in SOS value between Chinese and Malay males
Table 3 Body mass index-adjusted association between age and bone health indices
Ethnicity, sex SOS (m/s) BUA (dB/MHz) SI T-score
B SE P-value B SE P-value B SE P-value B SE P-value
Malay, male -0.160 0.516 0.756 0.056 0.151 0.711 -0.038 0.232 0.870 -0.002 0.019 0.927
Chinese, male -0.477 0.323 0.142 -0.019 0.114 0.869 -0.127 0.157 0.420 -0.015 0.012 0.218
Indian, male 0.713 0.963 0.465 0.401 0.294 0.184 0.424 0.470 0.374 0.041 0.038 0.290
Overall, male -0.152 0.274 0.578 0.076 0.086 0.380 0.009 0.128 0.942 -0.001 0.010 0.887
Malay, female -1.486 0.380 ,0.001 -0.384 0.143 0.008 -0.667 0.181 ,0.001 -0.067 0.018 ,0.001 Chinese, female -1.144 0.240 ,0.001 -0.530 0.100 ,0.001 -0.650 0.125 ,0.001 -0.067 0.012 ,0.001
Indian, female -0.803 0.775 0.310 -0.169 0.301 0.580 -0.524 0.386 0.186 -0.036 0.039 0.369
Overall, female -1.136 0.193 ,0.001 -0.438 0.077 ,0.001 -0.607 0.097 ,0.001 -0.060 0.010 ,0.001
Abbreviations: B, unstandardized regression coefficient; BUA, broadband ultrasound attenuation; SE, standard error of regression coefficient; SOS, speed of sound.
Table 4 Bone health of the subjects according to sex and age groups
Male Female
Age group Normal Osteopenia Osteoporosis Total P-value Normal Osteopenia Osteoporosis Total P-value
n % n % n % n % n % n % n % n %
50–54 years 17 45.9 16 43.2 4 10.8 37 100 0.323 52 75.4 15 21.7 2 2.9 69 100 ,0.001
55–59 years 25 55.6 16 35.6 4 8.9 45 100 55 59.1 35 37.6 3 3.2 93 100
60–64 years 39 30.5 36 44.4 6 7.4 81 100 53 60.2 32 36.4 3 3.4 88 100
65–69 years 21 32.3 33 50.8 11 16.9 65 100 25 47.2 23 43.4 5 9.4 53 100
70–74 years 17 53.1 11 34.4 4 12.5 32 100 14 38.9 13 36.1 9 25 36 100
75 years or above
9 39.1 13 56.5 1 4.3 23 100 6 26.1 10 43.5 7 30.4 23 100
Overall 128 45.2 125 44.2 30 10.6 283 100 205 56.6 128 35.4 29 8 362 100
Notes: Quantitative ultrasound is not a diagnostic tool for osteoporosis. The T-score generated by QUs is different from T-score based on BMD obtained from DeXA.
Pertaining to this study, the term “normal” indicates a low risk for osteoporosis, “osteopenia” indicates a moderate risk for osteoporosis, and “osteoporosis” indicates a high risk for osteoporosis.
Abbreviations: BMD, bone mineral density; DeXA, dual-energy X-ray absorptiometry; QUs, quantitative ultrasound.
Clinical Interventions in Aging downloaded from https://www.dovepress.com/ by 118.70.13.36 on 20-Aug-2020
Dovepress effects of age, sex, and ethnicity on bone health status of the elderly
in Malaysia, which was similar to this study. However, a significant decline of SOS was documented in Chinese and Malay males after the age of 30 years.17 This was
differ-ent from our study, which found no significant age-related decline in bone health indices in males. The discrepancy might be due to the limited age range included (50 years and above) compared to their studies (20 years and above). Besides, the sample size in this study is only moderate and may not be capable of detecting the gradual change in bone health of males. No other studies the male osteoporosis in Malaysia were performed thus far, showing that this problem has been constantly overlooked by the medical and scientific community.
Among the 514 Malaysian urban female subjects (mean age: 51.07 years [SD: 5.28 years]) examined using DEXA, Lim et al25 found that the prevalence of osteoporosis was
8.6% based on spine BMD and 21.4% based on hip BMD, while the prevalence of osteopenia was 38.9% and 51.6%, respectively. The estimates were similar to the findings of this study, whereby 8% of the female were osteoporotic and 35.4% were osteopenic. Lim et al25 also reported no ethnic
differences in the prevalence of osteoporosis/osteopenia established based on BMD in Malaysian females. The preva-lence of osteoporosis/osteopenia reported was 16.9% in the Malays, 27.4% in the Chinese, and 18.2% in the Indians based on either spine or hip BMD.25 This was higher than
our estimates, which were 4.8% in the Malays, 9.1% in the Chinese, and 13.3% in the Indian. However, one should be cautious in comparing prevalence derived from QUS and DXA because discrepancy might exist.20
The third National Health and Nutrition Examination Survey revealed that there were significant differences in the prevalence of osteoporosis and osteopenia established based on BMD among the ethnic groups in the US. The prevalence was the highest in non-Hispanic Whites, followed by Mexican Americans and non-Hispanic Blacks.14 This was
in accordance with their BMD values assessed by DEXA,
which was the highest among the non-Hispanic Blacks, followed by Mexican Americans and non-Hispanic Whites.26
Similar to the US, Malaysia consists of three major ethnic groups and ethnic differences in the distribution of diseases were observed.10,27,28 Previous reports on fragility fractures in
Malaysia in the year 1997 revealed that the incidence rate was the highest among the Chinese (males 94/100,000; females 220/100,000) and Indians (males 98/100,000; females 204/100,000) and several folds lower in the Malays (males 27/100,000; females 43/100,000).10,29 In Singapore with a
similar ethnic composition as Malaysia, the incidence of fragility fracture was the highest among the Chinese (males 180/100,000; females 437/100,000), followed by the Indians (males 198/100,000; females 242/100,000) and the lowest in the Malays (males 97/100,000; females 233/100,000).29 In
contrast, the results of this study revealed no significant ethnic difference in the prevalence of osteoporosis/osteopenia and bone health indices for both sexes. The discrepancy between hip fracture incidence and bone health indices/prevalence of suboptimal bone health in terms of ethnic differences could be attributed to several reasons. Firstly, there are many pre-dictors of falls and fragility fracture other than bone density, such as muscle weakness, gait and balance deficits, visual and cognitive impairments, and postural hypotension.30 Thus,
variations in bone health alone could not explain the differ-ences in fracture risk incidence among the ethnic groups. Secondly, assimilation and secular changes in the lifestyle among these ethnic groups during the period between the fracture incidence data first put forward (1997)10 and this
study (2015) could have contributed to the discrepancy. The age-related reduction in bone health indices and increase in prevalence of osteoporosis were significant in females but not in males in this study. Males have higher peak bone mass compared to females due to a higher rate of periosteal apposition.31 Besides, females universally
experi-ence the cessation of estrogen production after menopause, leading to rapid deterioration of bone health.32 Testosterone
Table 5 Bone health of the subjects according to sex and ethnicity
Male Female
Bone health status
Malay Chinese Indian Overall P-value Malay Chinese Indian Overall P-value
n % n % n % n % n % n % n % n %
normal 52 47.3 59 42.1 17 51.5 128 45.2 0.299 71 57.3 118 56.7 16 53.3 205 56.6 0.499
Osteopenia 51 46.4 63 45 11 33.3 125 44.2 47 37.9 71 34.1 10 33.3 128 35.4
Osteoporosis 7 6.4 18 12.9 5 15.2 30 10.6 6 4.8 19 9.1 4 13.3 29 8.0
Total 110 100 140 100 33 100 283 100 124 100 208 100 30 100 362 100
Notes: Quantitative ultrasound is not a diagnostic tool for osteoporosis. The T-score generated by QUs is different from T-score based on BMD obtained from DeXA.
Pertaining to this study, the term “normal” indicates a low risk for osteoporosis, “osteopenia” indicates a moderate risk for osteoporosis, and “osteoporosis” indicates a high risk for osteoporosis.
Abbreviations: BMD, bone mineral density; DeXA, dual-energy X-ray absorptiometry; QUs, quantitative ultrasound.
Clinical Interventions in Aging downloaded from https://www.dovepress.com/ by 118.70.13.36 on 20-Aug-2020
Dovepress
Chin et al
level declines gradually in males and testosterone deficiency syndrome is not universal, thus the deterioration of bone health in males is less severe.33 While the significant
age-related decline of QUS indices in females of this study was similar to previous reports,13,34,35 the decline was merely
marginal in male subjects. Significant decline of QUS indices in males was documented in some studies involving wider age range,36–38 but in other studies, the decline was marginal
or observed at the very late in life.13,39 This is in line with the
fracture incidence of Malaysian males, which did not increase significantly until males were over 75 years.10
Limitations
This study is not without its limitations. A nonrandomized sampling technique was used; hence, generalization of the findings of this study should be done with caution. However, the ethnic composition recruited was similar to that of Kuala Lumpur as reported in the latest census. This study was cross-sectional in nature; hence, the rate of age-related decline in bone health might differ from longitudinal observations. The reference value of mainland Chinese was used in our device because there is no local reference. This might cre-ate some discrepancies in the classification of subjects into different risk groups according to T-score based on SI. The study is notable because it is the first to access bone health of Malaysian males and females aged 50 years and above concurrently. All three major ethnic groups in Malaysia were represented in this study. The analysis was adjusted with BMI, which is a major confounding factor in bone health,40
to depict a more accurate decline of bone health with age in the subjects.
Conclusion
In conclusion, a significant proportion of elderly males and females living in Kuala Lumpur are facing the problem of osteoporosis and osteopenia. Therefore, both sexes deserve equal attention in the prevention and treatment of osteoporo-sis. Bone health in the Malaysian elderly shows a significant sex but not ethnic difference. However, true differences in rate of bone loss between sexes and ethnic groups await validation from comprehensive longitudinal studies. As the demographic trends of the nation are approaching that of a developed nation characterized by a high proportion of elderly in the population, preventive measures should be taken to slow down the progression of osteoporosis for minimizing the health care and economic burden. In this case, QUS may be useful in enabling early detection of osteopo-rosis because it can identify the age-related decline in bone
health. Our study has contributed to filling the gap in the knowledge of bone health in Malaysia, but more updated data on bone health are needed to establish strategies to prevent osteoporosis in Malaysian elderly.
Acknowledgments
We thank Mr Fadlullah Zuhair Japar Sidik, Ms Juliana Abdul Hamid, Ms Nurul Hafizah Abas, Ms Sabariah Adnan, Mr Azlan Mohd Arslamsyah, Mr Mustazil Mohd Noor, Ms Nur Farhana Mohd Fozi, Ms Siti Zulfarina Mohamed and Mr Sharkawi Ahmad from the Department of Pharmacology, and Ms Sharifah Nurul Aqilah Sayed Mohd Zaris from the Department of Orthopaedic and Traumatology, Universiti Kebangsaan Medical Centre, who offered invaluable assis-tance in the screening sessions. Universiti Kebangsaan Malaysia funded this study via grants FF-2015-412 and FF-2015-396.
Disclosure
The authors report no conflicts of interest in this work.
References
1. Edwards MH, Dennison EM, Aihie Sayer A, Fielding R, Cooper C. Osteoporosis and sarcopenia in older age. Bone. 2015;80:126–130. 2. Schuit SC, van der Klift M, Weel AE, et al. Fracture incidence and
association with bone mineral density in elderly men and women: the Rotterdam Study. Bone. 2004;34(1):195–202.
3. World Health Organization. Assessment of fracture risk and its applica-tion to screening for postmenopausal osteoporosis. Report of a WHO study group. World Health Organ Tech Rep Ser. 1994;843:1–129. 4. Mithal A, Ebeling P. The Asia-Pacific Regional Audit: Epidemiology,
Costs & Burden of Osteoporosis in 2013. Nyon: International
Osteo-porosis Foundation; 2013.
5. Cavani F, Giavaresi G, Fini M, et al. Influence of density, elasticity, and structure on ultrasound transmission through trabecular bone cyl-inders. IEEE Trans Ultrason Ferroelectr Freq Control. 2008;55(7): 1465–1472.
6. Chan MY, Nguyen ND, Center JR, Eisman JA, Nguyen TV. Absolute fracture-risk prediction by a combination of calcaneal quantitative ultrasound and bone mineral density. Calcif Tissue Int. 2012;90(2): 128–136.
7. Kwok T, Khoo CC, Leung J, et al. Predictive values of calcaneal quantitative ultrasound and dual energy X ray absorptiometry for non-vertebral fracture in older men: results from the MrOS study (Hong Kong). Osteoporos Int. 2012;23(3):1001–1006.
8. Padilla F, Jenson F, Bousson V, Peyrin F, Laugier P. Relationships of trabecular bone structure with quantitative ultrasound parameters: In vitro study on human proximal femur using transmission and back-scatter measurements. Bone. 2008;42(6):1193–1202.
9. Chin KY, Ima-Nirwana S. Calcaneal quantitative ultrasound as a deter-minant of bone health status: what properties of bone does it reflect?
Int J Med Sci. 2013;10(12):1778–1783.
10. Lee J-K, Khir ASM. The incidence of hip fracture in Malaysians above 50 years of age: variation in different ethnic groups. APLAR J Rheumatol. 2007;10(4):300–305.
11. Krassas GE, Papadopoulou FG, Doukidis D, Konstantinidis TH, Kalothetou K. Age-related changes in bone density among healthy Greek males. J Endocrinol Invest. 2001;24(5):326–333.
Clinical Interventions in Aging downloaded from https://www.dovepress.com/ by 118.70.13.36 on 20-Aug-2020
Clinical Interventions in Aging
Publish your work in this journal
Submit your manuscript here: http://www.dovepress.com/clinical-interventions-in-aging-journal
Clinical Interventions in Aging is an international, peer-reviewed journal focusing on evidence-based reports on the value or lack thereof of treatments intended to prevent or delay the onset of maladaptive correlates of aging in human beings. This journal is indexed on PubMed Central, MedLine,
CAS, Scopus and the Elsevier Bibliographic databases. The manuscript management system is completely online and includes a very quick and fair peer-review system, which is all easy to use. Visit http://www.dovepress. com/testimonials.php to read real quotes from published authors.
Dovepress
Dove
press
effects of age, sex, and ethnicity on bone health status of the elderly
12. Johnell O, Kanis J. An estimate of the worldwide prevalence and dis-ability associated with osteoporotic fractures. Osteoporos Int. 2006; 17(12):1726–1733.
13. Maggi S, Noale M, Gonnelli S, et al. Quantitative ultrasound calcaneous measurements: normative data for the Italian population. the ESOPO study. J Clin Densitom. 2007;10(3):340–346.
14. Looker AC, Orwoll ES, Johnston CC, et al. Prevalence of low femoral bone density in older U.S. adults from NHANES III. J Bone Miner Res. 1997;12(11):1761–1768.
15. Looker AC, Melton LJ, Borrud LG, Shepherd JA. Lumbar spine bone mineral density in US adults: demographic patterns and relationship with femur neck skeletal status. Osteoporos Int. 2012;23(4):1351–1360. 16. Mithal A, Kaur P. Osteoporosis in Asia: a call to action. Curr Osteoporos
Rep. 2012;10(4):245–247.
17. Chin KY, Soelaiman IN, Mohamed IN, et al. Discrepancy between the quantitative ultrasound value of Malaysian men and the manufacturer’s reference and the impact on classification of bone health status. J Clin
Densitom. 2013;16(2):189–195.
18. Damodaran P, Subramaniam R, Omar SZ, Nadkarni P, Paramsothy M. Profile of a menopause clinic in an urban population in Malaysia.
Singapore Med J. 2000;41(9):431–435.
19. Hasnah H, Amin I, Suzana S. Bone health status and lipid profile among post-menopausal Malay women in Cheras, Kuala Lumpur.
Malays J Nutr. 2012;18(2):161–171.
20. Zaini WM, Md Ariff A. Bone mineral density assessment in pre- and postmenopausal women: comparison between t-scores by heel QUS and DXA in HRPZII. Med J Malaysia. 2012;67(5):487–490. 21. Department of Statistics Malaysia. Population Distribution and Basic
Demo-graphic Characteristic Report 2010. 2011. Available from: https://www.
statistics.gov.my/index.php?r=column/cthemeByCat&cat=117&bul_id
=MDMxdHZjWTk1SjFzTzNkRXYzcVZjdz09&menu_id=L0pheU43
NWJwRWVSZklWdzQ4TlhUUT09. Accessed January 31, 2016. 22. Krieg MA, Barkmann R, Gonnelli S, et al. Quantitative ultrasound in
the management of osteoporosis: the 2007 ISCD official positions.
J Clin Densitom. 2008;11(1):163–187.
23. Holi MS, Radhakrishnan S, Swaranamani S, Jayavelan NA. Quantitative ultrasound technique for the assessment of osteoporosis and prediction of fracture risk. J Pure Appl Ultrason. 2005;27:55–60.
24. Handa R, Ali Kalla A, Maalouf G. Osteoporosis in developing countries.
Best Pract Res Clin Rheumatol. 2008;22(4):693–708.
25. Lim PS, Ong FB, Adeeb N, et al. Bone health in urban midlife Malaysian women: risk factors and prevention. Osteoporos Int. 2005;16(12): 2069–2079.
26. Looker AC, Borrud LG, Hughes JP, Fan B, Shepherd JA, Melton LJ 3rd. Lumbar spine and proximal femur bone mineral density, bone mineral content, and bone area: United States, 2005–2008. Vital Health Stat 11. 2012;(251):1–132.
27. Letchuman GR, Wan Nazaimoon WM, Wan Mohamad WB, et al. Prevalence of diabetes in the Malaysian national health morbidity survey III 2006. Med J Malaysia. 2010;65(3):180–186.
28. Zainal Ariffin O, Nor Saleha IT. National Cancer Registry Report:
Malaysia Cancer Statistics – Data and Figure 2007. Putrajaya: Ministry
of Health Malaysia; 2011.
29. Lau EM, Lee JK, Suriwongpaisal P, et al. The incidence of hip fracture in four Asian countries: the Asian Osteoporosis Study (AOS). Osteoporos
Int. 2001;12(3):239–243.
30. Rubenstein LZ. Falls in older people: epidemiology, risk factors and strategies for prevention. Age Ageing. 2006;35(Suppl 2):ii37–ii41. 31. Duan Y, Turner CH, Kim BT, Seeman E. Sexual dimorphism in
verte-bral fragility is more the result of gender differences in age-related bone gain than bone loss. J Bone Miner Res. 2001;16(12):2267–2275. 32. Riggs BL, Khosla S, Melton LJ. Sex steroids and the construction and
conservation of the adult skeleton. Endocr Rev. 2002;23(3):279–302. 33. Chin KY, Ima-Nirwana S. Sex steroids and bone health status in men.
Int J Endocrinol. 2012;2012:208719.
34. Pluskiewicz W. Bone status assessed by quantitative ultrasound in healthy postmenopausal Polish women: normative data. Clin Rheumatol. 1998; 17(1):40–43.
35. Trovas G, Tsekoura M, Galanos A, et al. Quantitative ultrasound of the calcaneus in Greek women: normative data are different from the manufacturer’s normal range. J Clin Densitom. 2009;12(3):353–359. 36. VanderJagt DJ, Damiani LA, Goodman TM, et al. Assessment of the
skeletal health of healthy Nigerian men and women using quantitative ultrasound. Bone. 2004;35(2):387–394.
37. Zhang ZL, Qin YJ, Huang QR, et al. Bone mineral density of the spine and femur in healthy Chinese men. Asian J Androl. 2006;8(4):419–427. 38. Zhu ZQ, Liu W, Xu CL, Han S-M, Zu SY, Zhu GJ. Reference data for
quantitative ultrasound values of calcaneus in 2927 healthy Chinese men. J Bone Miner Metab. 2008;26(2):165–171.
39. Kastelan D, Kujundzic-Tiljak M, Kraljevic I, Kardum I, Giljevic Z, Korsic M. Calcaneus ultrasound in males: normative data in the Croatian population (ECUM study). J Endocrinol Invest. 2006;29(3):221–225. 40. Chin KY, Soelaiman IN, Mohamed IN, Ibrahim S, Ngah WZW. The
effects of age, physical activity level, and body anthropometry on cal-caneal speed of sound value in men. Arch Osteoporos. 2012;7(1–2): 135–145.
Clinical Interventions in Aging downloaded from https://www.dovepress.com/ by 118.70.13.36 on 20-Aug-2020