726+,%$
Telecommunication Systems DivisionDigital Business Telephone Systems
Publication Information
Toshiba America Information Systems, Inc., Telecommunication Systems Division, reserves the right, without prior notice, to revise this information publication for any reason, including, but not limited to, utilization of new advances in the state of technical arts or to simply change the design of this document.
Further, Toshiba America Information Systems, Inc., Telecommunication Systems Division, also reserves the right, without prior notice, to make such changes in equipment design or components as engineering or
manufacturing methods may warrant. D42-SG-INSIT-VA
4016162
Toshiba America Information Systems, Inc. Telecommunication Systems Division
All rights reserved. No part of this manual, covered by the copyrights hereon, may be reproduced in any form or by any means—graphic, electronic, or mechanical, including recording, taping, photocopying, or information retrieval systems—without express written permission of the publisher of this material.
Strata is a registered trademark of the Toshiba Corporation. Insight DK is a trademark of Toshiba America Information Systems, Inc.
Contents
Introduction
Organization ...iii
Conventions ...iii
Related Documents ... v
Chapter 1 – The Grand Tour
Before You Begin ... 1Hardware ... 1
Software ... 1
Main Menu and Tool Bars ... 2
Online Help ... 2
Chapter 2 – Real Time Displays
Creating Real Time Displays ... 3Composite Screen Layout ... 4
Agent Status Window ... 5
Create a new Agent Status Window ... 5
Configure the Agent Status Window ... 5
Real Time Statistics ... 6
Setting Real Time Stats ... 6
Agent Statistics ... 7
Create a new Agent Statistics Window ... 7
Configure the Agent Statistics Window ... 7
Wait Time Graph ... 8
Create a Wait Time Graph Window ... 8
Change Properties for the Wait Time Graph ... 9
Calls in Queue Graph (Insight DK Plus only) ... 10
Creating Calls in Queue Graph ... 10
Configuring the Calls in Queue Graph ... 11
Large Character Window ... 12
Create Large Character Window ... 12
Configure a Large Character Window ... 12
Duplicate a Large Character Window ... 13
Chapter 3 – Reports
Overview ... 15Report Concepts and Terminology ... 16
Devices ... 16
Shifts ... 16
Wallboards
Templates ... 19
Scheduling ... 19
Reports ... 19
Event Reports ... 19
Traffic Reports for Agents or Extensions ... 21
Traffic Reports for Lines or DNIS/DID Numbers ... 24
Utilization Reports ... 27
Contention Reports (Insight DK Plus Only) ... 28
Wait Time Distribution Report ... 28
Account Code Report ... 28
Using MIS Reports to Improve Performance ... 29
Abandoned calls and long waits ... 29
Complaints of busy signals ... 30
Unexpected out-of-hours customer demand ... 30
Complaints about too many transfers ... 30
Creating Reports ... 31
Create a Report Template ... 31
Edit the Report Contents ... 32
Filter the Report Contents (optional) ... 33
Print the Report ... 34
Exporting Reports ... 35
Forecasting ... 36
Forecasting Reports ... 36
Forecasting Profile Report ... 38
Chapter 4 – Wallboards
Configuring Wallboards ... 41Changing Fonts ... 44
Creating Temporary Wallboard Messages ... 45
Queuing Messages ... 46
Chapter 5 – Alarms
Configure Alarms ... 47To View Alarms ... 49
Glossary
General Terms ... 51Report Terminology ... 55
Introduction
This guide provides instructions for using the Strata DK Insight and Insight DK Plus Management Information System (MIS) for call centers. DK Insight and Insight DK Plus are compatible with the following Strata DK Systems:
♦ DK280 (Release 3.0 or higher) with the RCTUBA/BB, RCTUC/D, RCTUE/F processors
♦ DK424, with the RCTUBA/BB, RCTUC/D, RCTUE/F processors
Organization
This guide is divided as follows:
♦ Chapter 1 – The Grand Tour covers the basic requirements for Insight DK and DK Plus. It also
provides an overview of the toolbars.
♦ Chapter 2 – Real Time Displays explains how to create and edit status, statistics, graphical,
wait time, and large character displays.
♦ Chapter 3 – Reports details how to create and edit report templates, reports, as well as how to
filter, compile, print, import and export report data.
♦ Chapter 4 – Wallboards shows how to configure wallboards, set up schedules and messages.
♦ Chapter 5 – Alarms covers configuring alarms, displaying alarms, and explains the various
colors and thresholds associated with specific alarms.
♦ Glossary
Conventions
This guide uses these conventions:
➤
Denotes a procedure1. Actions you perform appear in this column. They can consist of either a single step or a series of numbered steps.
Conventions
Letters in [brackets] represent buttons which have Directory Numbers on them. For example:
Note Elaborates specific items or references other information. Within some tables,
unnumbered notes apply to the entire table and numbered notes apply to specific items.
Important! Calls attention to important instructions or information. 2. When the action you
perform results in a screen, menu, dialog box, etc., the example to the right displays.
[PDN] represents a Primary Directory Number (also known as an Extension Number for your telephone.
[SDN] represents a Secondary appearance of a [PDN]. A [PDN] which appears on another telephone is considered an [SDN].
[PhDN] represents a Phantom Directory Number button (an additional Directory Number).
[DN] represents a Directory Number button (also known as an Extension or Intercom Number). Whenever [DN] is used in this guide, it means the user can use any [PDN], [SDN], or [PhDN].
([WUDEROG represents buttons on a telephone.
Courier shows a computer keyboard entry or screen display. “Type” indicates entry of a string of text. “Press” indicates entry of a single key. Example: Type
prog then press Enter.
Times Roman words that are capitalized represent a specific dialog box button. For example: Transfer button.
“Click” means to press and then release the mouse button without moving the mouse.
~ means “through”
+ is used for multiple key entries.
➤ denotes the step in a one-step procedure.
represents an icon button on a feature toolbar. When you click on this icon, it achieves the same result as the step that it appears next to.
27
Related Documents/Media
CAUTION! Advises you that hardware, software applications or data could be damaged if the instructions are not followed closely.
Related Documents/Media
Refer to the following documents for more information:
♦ Strata DK Call Center Solutions – Chapters 3~5 provide an overview of the Insight DK and
Insight DK Plus Management Information System (MIS). It summarizes the differences between the Insight DK and DK Plus. It also provides examples of various PBX/MIS configurations, including some with wallboards, backup servers, and sub-clients.
♦ Insight DK inView Quick Reference Guide provides instructions for viewing and
customizing the on-screen wallboard and large character views of the real time call center data.
♦ Insight DK Installation Guide explains how to set up the network, install the server software,
install clients and explains how the data files are organized.
♦ Insight DK CD-ROM which includes training, all Insight DK documentation, Insight DK
software and the upgrade to Insight DK Plus, and Demo software.
♦ Strata DK Library CD-ROM enables you to view, print, navigate and search publications
The Grand Tour
1
This chapter explains how to use the Strata Insight DK and Insight DK Plus MIS features.
Before You Begin
Strata Insight DK and Insight DK Plus require the following:
Hardware
♦ Pentium PC running at 133 MHz or higher
♦ 16 MB memory (32 MBs preferred)
♦ Hard Disk with capacity to store data records (1.6 GB minimum). Program memory will use approximately 10 MBs.
♦ SVGA monitor
♦ 1 parallel port and 2 serial ports – must have unique Interrupt Requests (IRQs) available
Software
♦ Microsoft® Windows® 95, Windows 98, Windows NT® 4.0 or higher
♦ Windows 95 version 4.00.950, a, b, or c. Right click on My Computer, select Properties. Listed
under system will be the operating system Window 95.
♦ Or, use Windows NT 4.00.1381 (must install Service Pack 3 (SP3), available from Microsoft).
Main Menu and Tool Bars
Main Menu and Tool Bars
The Insight DK Main Menu provides access to all of its features. The software is presented in a Windows format, which is easy to use. The following shows the Main Menu items and icons.
When you click on the Reports Icon, the Reporter Toolbar appears (shown below).
Online Help
You can access online help with specific help on virtually any window of Insight DK and DK Plus. Click on the help icon to view definitions and instructions.
Help
Wallboard Template Send
Message Delete Template
Pull-down a list Display Templates
Change Window Properties
Add New Window to Template Reports
Configurator
Alarms
Send Messages to inView Users Save Current
Layout
3461
Insight DK (Main Menu)
Configurator New Report
Open Report
Size to Window Width Size to Window Height
Templates
Auto Report Scheduling
Configure Auto Report Schedules Help
Print Export
Save
Real Time Displays
2
This chapter covers setting up and interpreting Real Time Displays. These displays provide immediate feedback on the activity on your call center; they update every second. You can create custom templates using a variety of display windows. Standardized colors indicate various alarm states and status conditions.
Real Time Displays are configured into templates. A template is a set of display windows that can be viewed directly on the screen. Insight DK supports four templates, while the Insight DK plus has an unlimited number of templates.
Creating Real Time Displays
Real time displays are used to monitor activity in the call center during working hours. You will want to determine how many and what type of the following displays you would initially like to see. Refer to the table below for Display types.
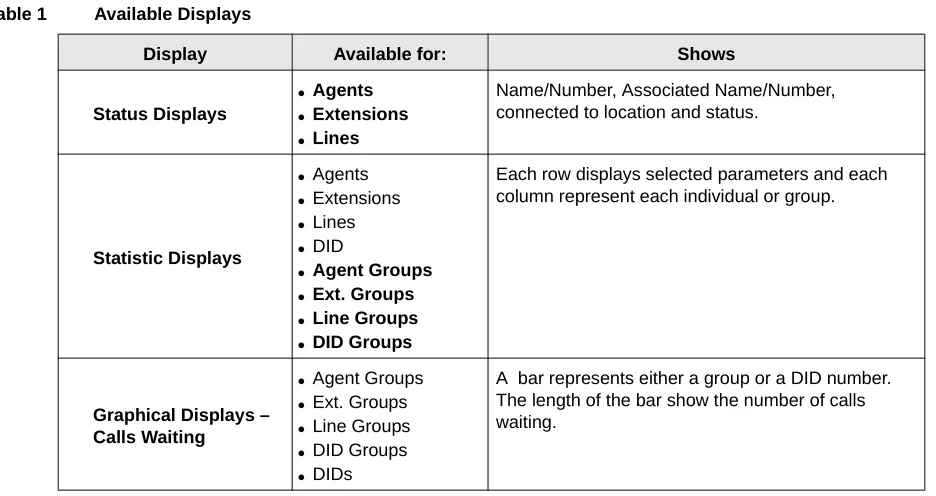
Note Table 1 describes all of the displays available with Insight DK Plus. Insight DK provides a subset of these displays, shown in bold.
Table 1 Available Displays
Display Available for: Shows
Status Displays
● Agents ● Extensions ● Lines
Name/Number, Associated Name/Number, connected to location and status.
Statistic Displays
● Agents ● Extensions ● Lines ● DID
● Agent Groups ● Ext. Groups ● Line Groups ● DID Groups
Each row displays selected parameters and each column represent each individual or group.
Graphical Displays – Calls Waiting
● Agent Groups ● Ext. Groups ● Line Groups ● DID Groups ● DIDs
Creating Real Time Displays
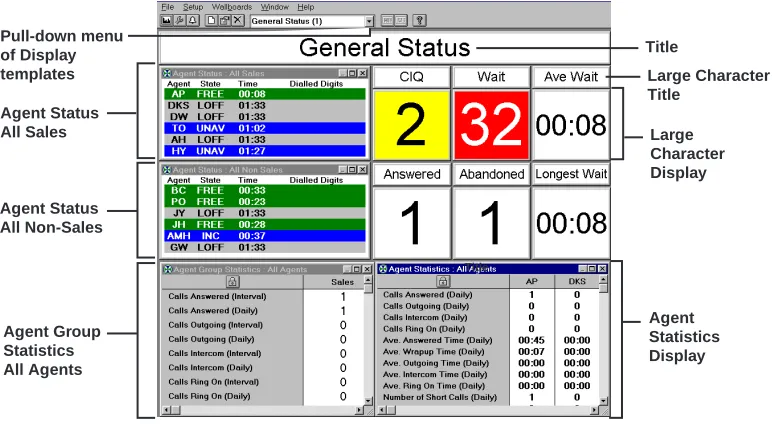
Composite Screen Layout
The following figure shows an example of a composite layout with various real time display windows. When a layout like this one is saved, you can easily pull up the same windows by selecting this layout.
Indication Colors
On a color monitor, the above windows will show the status of agents and/or devices. Insight DK uses five colors for various alarms and call states.
Graphical Displays – Wait Time
● Agent Groups ● Ext. Groups ● Line Groups ● DID Groups ● DIDs
A bar represents either a group or a DID number. The length of the bar show the number of seconds for the longest call waiting.
Large Character Displays
● Agents ● DIDs ● Extensions ● Lines
● Agent Groups ● DID Groups ● Ext. Groups ● Line Groups
Each display shows the selected parameter from the device being monitored. A Large Character Display can also be defined as a label for placing titles on the screen.
Color Meaning Notes
Red Alarm Waiting time threshold exceeded, etc.
Yellow Ringing Device or line is ringing
Blue Busy Agent on call, in wrap up, etc.
Green Idle Agent is idle. Line is free.
Table 1 Available Displays (continued)
Display Available for: Shows
Title
Title
Large Character Title
Large Character Display
Agent Statistics Display Agent Status
All Non-Sales Agent Status All Sales Pull-down menu of Display templates
Agent Status Window
The following procedures describe how to create and configure Agent Displays. The procedures for each type of display are the same. For instance, the procedure to create Agent Status Displays is the same for Extension and Line Displays.
Agent Status Window
This window shows the current status of each agent in the selected group. Short descriptions of each agent’s status appears with a background color that represents various call and/or alarm states. The amount of time that each agent has been in the current state is shown. Additional information can be displayed by selecting those parameters within the Configuration window.
Create a new Agent Status Window
Configure the Agent Status Window
1. From the Windowmenu, click on the New icon.
2. From the Agent Status, select Agent Status, click OK.
1. Right click on the Agent Status window
...or click the Properties for Agent Status Window icon.
2. From Properties for the Agent Status window, enter/ select:
♦ Agent Group
♦ Agent information to be shown
♦ Extension information
♦ Connected to information
3537
Real Time Statistics
Real Time Statistics
Statistics can be presented as:
♦ Interval Call Statistics in which you set the length of time (from 1~1140 minutes) that the
calculations should cover.
♦ Daily Call Statistics, which are based on shift schedules. The counter is reset to zero at the
beginning of each shift.
The parameters for Interval and Daily Call Statistics are defined under Setup, Realtime Stats.
Statistical Thresholds and Alarm Thresholds are established in the Configurator. Interval Time periods and Daily Shifts which have already been created can be added or removed for calculation purposes from the Setup menu.
Setting Real Time Stats
Access Real Time Stats to configure how the interval call statistics and the daily call statistics operate. This is a list of the shifts available to use to control the daily call statistics.See also Configuring real time call statistics
♦ (Optional) Check Show Extensions in Preference to Agent.
This options always displays the name/number of the extension an agent is connected to, even if the agent is logged on at another extension. If unchecked, the agent number/name displays.
♦ (Optional) Check
Show Line in Preference to DID.
When checked, this displays the number/name of the line that the agent is connected to, even if there is a DID number associated with the line. If unchecked, the DID number/name displays.
♦ (Optional) Check Dialed Digits.
Check this box to display dialed digits for outgoing calls or
Automatic Number Identification (ANI) or Caller ID (CLID) digits for incoming calls. (Requires RKYS4 key).
♦ Select Rows or
Columns.
Show additional agents in columns, using the horizontal scroll bar. Or, to show rows, use the vertical scroll bar.
3. Click OK when done.
1. Click Setup, Real Time Stats.
2. Add new shifts by
highlighting a shift from the Available Shift, then
Daily Shifts lists the shifts that are to be used in the Real Time Displays. These can be used to provide automatic start and ending times.
36
Agent Statistics
Agent Statistics
Statistics based on parameters and time periods that you select will be displayed in the Agent Statistics Window.
Create a new Agent Statistics Window
Configure the Agent Statistics Window
...or removeshifts by highlighting the shift(s), then click Remove.
1. From the Window menu, click on the New icon.
2. Select Agent Statistics, click OK.
After creating the Agent Statistics window, you can go to the Properties for the Agent Statistics Window to configure this display.
1. Right click on the Agent Statistics window.
Wait Time Graph
Wait Time Graph
This is one of the real time data windows that can be created in the work space area of the Insight DK MIS application window.
Each wait time bar graph window shows the wait time for the longest waiting call currently queued on a series of line groups, DID numbers, DID groups, extension groups or agent groups.
The graph uses status colors to provide an at-a-glance indication of the status of the longest wait time in each queue. If the longest wait time in a given queue exceeds the wait time alarm limit for that queue, then the corresponding bar turns red to show how much over the alarm threshold the call has been waiting.
Create a Wait Time Graph Window
2. From the Propertiesfor Agent Group Statistics window, enter or select:
♦ Agent Super Group
♦ Font Size
♦ Agent Name Format
♦ Select Displayed
Parameters, click Add or Remove
...or select a Parameter and click Alternative Label to rename it.
♦ (Optional) Use the lock button to toggle the Agent Statistics window between two display modes.
Button ON (pressed): Displays the single agent that was left most in the window before the lock button was pressed. The horizontal scroll bar is removed.
Button OFF: Displays all the agents within the selected agent group and provides a scroll bar if there are more agents than can fit in the window.
3. Click OK.
1. Click the New icon.
Wait Time Graph
Change Properties for the Wait Time Graph
3. Click OK.The bar graph can be orientated horizontally or vertically. It can also be set to auto-scale proportionally for the alarm limits configured for the displayed parameters.
1. Right click on the Wait Time Graph that you wish to change.
2. Select the desired Wait Time Graph, then choose Properties.
3. Select the Name of the Device that you wish to monitor the members of.
4. Select the graph orientation (horizontal or vertical).
For example, if you select DID Group, you can monitor the DID numbers belonging to the selected group. Whereas, if you choose DID Super Group you can monitor DID Groups within the selected Super Group.
5. Enter a bar Height/ Width (define the bar sizes in pixels).
6. Enter a Bar Separation (define spacing between bars in pixels).
36
54
Calls in Queue Graph (Insight DK Plus only)
Calls in Queue Graph (Insight DK Plus only)
Each Calls in Queue Graph window displays bar graphs of the number of calls currently queued on a series of line groups, DID numbers, DID groups, extension groups or agent groups. This graph displays real time data and can be placed in the composite real time display area.
The graphs are in color so that queue status can be determined at a glance. If too many calls are waiting to be answered in a given queue (as defined by the calls waiting alarm limit for that queue), the corresponding bar turns red. The red bar also shows how many calls are exceeding the alarm threshold.
Creating Calls in Queue Graph
7. Check the Text InBar box to display text labels within the bars.
If you choose text in bar, the label size is governed by the bar size. If you choose text outside the bar the label size is governed by the bar spacing.
8. Either check the Autoscale box or enter the maximum number of calls you wish the queue graph to display.
9. Choose the axis position (Top/Left, Bottom/Right, or both).
10. Click OK.
1. Click on the New icon
2. Select Calls In Queue Graph from the drop down list.
3. Click OK.
You can configure the contents of this window (see following instructions) to adjust the size and position of the window.
Calls in Queue Graph (Insight DK Plus only)
Configuring the Calls in Queue Graph
You can configure the Calls in Queue Graph properties: orient the bar horizontally or vertically, set the bar width, bar separation, set text in the bar, and scale the bar.
1. Select the New icon.
The New Real Time Window displays.
2. From the New Real Time window, select Calls in Queue Graph from the drop down list.
3. Right click on the Calls in Queue Graph Window that you wish to configure.
4. From the Properties for the Calls in Queue Window, select the Name of the Device that you wish to monitor the members of.
5. Select the graph orientation (horizontal or vertical).
6. Enter a bar Height/ Width (define the bar sizes in pixels).
7. Enter a Bar Separation (define spacing between bars in pixels).
For example, if you select DID Group, you can monitor the DID numbers belonging to the selected group. Whereas, if you choose DID Super Group you can monitor DID Groups within the selected Super Group.
8. Check the Text In Bar box to display text labels within the bars.
Large Character Window
Large Character Window
You can create large character windows that display a single parameter for a device or group of devices. These windows can display real time status information, such as the number of calls waiting to be answered or call statistics information, such as the average call wait time. Real time status data is shown with the correct background status color. And, both interval and daily call statistics are supported.
Create Large Character Window
Configure a Large Character Window
1. From the Windowmenu, click on the New icon.
2. In the New Real Time Window box, select Large Character, click OK.
A large character window appears.
1. Right click on the large character window that you wish to configure.
2. From the Properties for Large Character Window, enter or select:
♦ Device Type If you chose Device Type <None>, then enter Window Text that you
wish to display.
♦ Device Name
♦ Parameter
♦ Window Text (See Device Type.)
♦ Expected Display
Length digits
To minimize font size switching within the window, enter the Expected Display Length digits.
♦ (Optional) Hide Window Caption
Large Character Window
Duplicate a Large Character Window
♦ (Optional) Check Mouse Drag Window
Positioning When Caption Hidden
This option enables you to move the large character window when the window caption is hidden.
3. Click OK when done.
1. Click on the Large Character window to duplicate.
2. Click the New icon and enter
information (Substep 2‚
“Configure a Large Character
Window”).
A data window appears.
3. Click OK.
Tip: This is a good technique for creating windows with the same size dimensions for a uniform display appearance.
3552
Reports
3
This chapter provides an in-depth look at of the Insight DK Reporter. The Reporter program enables you to collate, view, and print historical reports. This chapter explains how to create report templates and how to interpret the report data. Also included are instructions for Insight DK Plus, which enables exporting data that can be imported into spreadsheet programs, such as Microsoft Excel®.
Overview
The programming in the Configurator is a key element for creating reports. The Configurator must mirror the telephone system configuration so that data can be collected for each device used in Strata DK, including Lines, Agents, Extensions, Agent Queue Groups and DID Numbers.
While Insight DK is running, all monitored telephone traffic is logged to the hard disk for analysis by the Reporter. To simplify the process of reporting, Insight Reporter provides the concept of a “report template” to define the contents of a report. You can create any number of report templates.
A report template is a series of reports used collectively to achieve a desired result. For example, a weekly report for Inside Sales may include a Line Traffic Report, an Agent Group Traffic Report, or Call Distribution Report.
Reports can be collated with respect to any number of definable weekly shifts. For example, if two sets of agents man the call center at different times during each day of the week, then Insight Reporter can generate reports for each shift as necessary. Once collated you can either view the report on screen or send a copy to the printer.
Insight DK and Insight DK Plus support Traffic and Event Reports.
♦ Traffic Reports provide general information on the call center and are useful for spotting
trends in work and areas for improvement.
♦ Event Reports give detailed information about an individual or a group (of agents, lines,
Report Concepts and Terminology
Report Concepts and Terminology
Understanding the key concepts and terminology used with the Reporter is vital to understanding the product. The following paragraphs explain these key concepts and terms. Also refer to “Report Terminology” on Page 55 of the Glossary.
Devices
Insight DK refers to lines, DIDs, extensions, agents and account codes as devices. Users can create “groups” and “super groups” of devices. A group is simply a collection of devices and a super group is a group of groups. Insight Reporter reports on:
♦ Individual devices
♦ Groups
♦ Super Groups
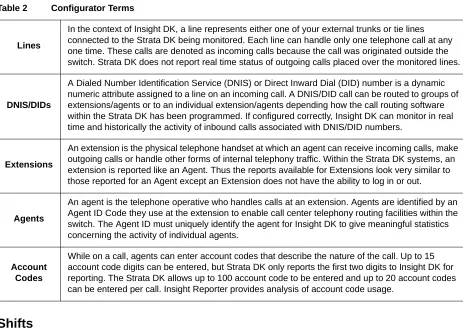
To ensure the accuracy of the reports it is vital that the configuration of the telephone system is reflected in the programming of Insight. The devices are configured in the Configurator. See Table 2 for more information:
Table 2 Configurator Terms
Shifts
Reports are compiled based upon shifts that are defined in the Configurator. These are used to filter the collected data to those times the user is interested. Real working shifts are used to create reports; however, shifts can also be used to determine what happens outside normal working hours, or certain days of the week, or just during certain hours (e.g., lunchtimes). For example, you can create a report over a six-month period that only reports the activity on Mondays.
Lines
In the context of Insight DK, a line represents either one of your external trunks or tie lines connected to the Strata DK being monitored. Each line can handle only one telephone call at any one time. These calls are denoted as incoming calls because the call was originated outside the switch. Strata DK does not report real time status of outgoing calls placed over the monitored lines.
DNIS/DIDs
A Dialed Number Identification Service (DNIS) or Direct Inward Dial (DID) number is a dynamic numeric attribute assigned to a line on an incoming call. A DNIS/DID call can be routed to groups of extensions/agents or to an individual extension/agents depending how the call routing software within the Strata DK has been programmed. If configured correctly, Insight DK can monitor in real time and historically the activity of inbound calls associated with DNIS/DID numbers.
Extensions
An extension is the physical telephone handset at which an agent can receive incoming calls, make outgoing calls or handle other forms of internal telephony traffic. Within the Strata DK systems, an extension is reported like an Agent. Thus the reports available for Extensions look very similar to those reported for an Agent except an Extension does not have the ability to log in or out.
Agents
An agent is the telephone operative who handles calls at an extension. Agents are identified by an Agent ID Code they use at the extension to enable call center telephony routing facilities within the switch. The Agent ID must uniquely identify the agent for Insight DK to give meaningful statistics concerning the activity of individual agents.
Account Codes
Report Concepts and Terminology
Types of Reports
This section defines the types of reports available for the user. The terms used on the reports are explained in the next section.
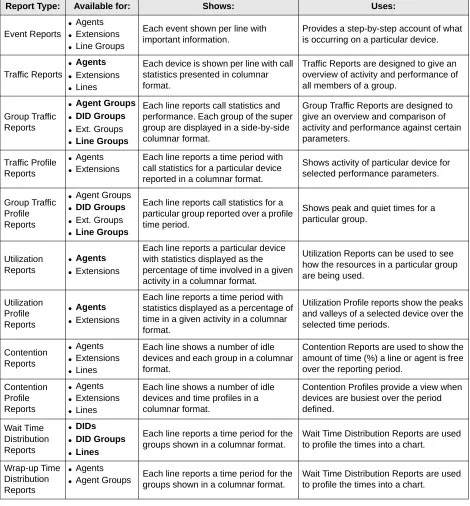
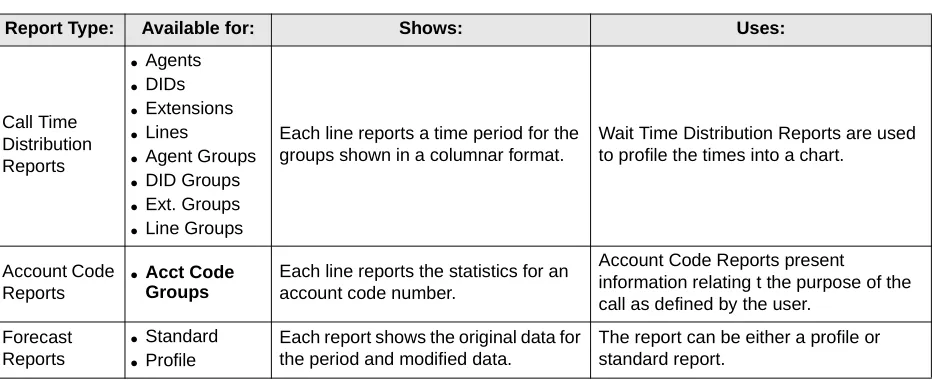
Note Table 3 describes all of the reports available through Insight DK Plus. Insight DK provides a subset of these reports, shown in bold.
Table 3 Available Reports
Report Type: Available for: Shows: Uses:
Event Reports
● Agents ● Extensions ● Line Groups
Each event shown per line with important information.
Provides a step-by-step account of what is occurring on a particular device.
Traffic Reports
● Agents ● Extensions ● Lines
Each device is shown per line with call statistics presented in columnar format.
Traffic Reports are designed to give an overview of activity and performance of all members of a group.
Group Traffic Reports
● Agent Groups ● DID Groups ● Ext. Groups ● Line Groups
Each line reports call statistics and performance. Each group of the super group are displayed in a side-by-side columnar format.
Group Traffic Reports are designed to give an overview and comparison of activity and performance against certain parameters.
Traffic Profile Reports
● Agents ● Extensions
Each line reports a time period with call statistics for a particular device reported in a columnar format.
Shows activity of particular device for selected performance parameters.
Group Traffic Profile Reports
● Agent Groups ● DID Groups ● Ext. Groups ● Line Groups
Each line reports call statistics for a particular group reported over a profile time period.
Shows peak and quiet times for a particular group.
Utilization Reports
● Agents ● Extensions
Each line reports a particular device with statistics displayed as the percentage of time involved in a given activity in a columnar format.
Utilization Reports can be used to see how the resources in a particular group are being used.
Utilization Profile Reports
● Agents ● Extensions
Each line reports a time period with statistics displayed as a percentage of time in a given activity in a columnar format.
Utilization Profile reports show the peaks and valleys of a selected device over the selected time periods.
Contention Reports
● Agents ● Extensions ● Lines
Each line shows a number of idle devices and each group in a columnar format.
Contention Reports are used to show the amount of time (%) a line or agent is free over the reporting period.
Contention Profile Reports ● Agents ● Extensions ● Lines
Each line shows a number of idle devices and time profiles in a columnar format.
Contention Profiles provide a view when devices are busiest over the period defined.
Wait Time Distribution Reports
● DIDs ● DID Groups ● Lines
Each line reports a time period for the groups shown in a columnar format.
Wait Time Distribution Reports are used to profile the times into a chart.
Wrap-up Time Distribution Reports
● Agents ● Agent Groups
Each line reports a time period for the groups shown in a columnar format.
Report Concepts and Terminology
Filters
The standard items that make up a report template tend to analyze your call center from one point of view only. For example, consider the DID Traffic Report and the Agent Traffic Report. These two reports analyze DID traffic and the associated agent traffic in isolation.
What if your call center is set up to route a series of DID numbers to the same group of agents. To obtain the performance of each agent on a per DID basis you need to attach report filters to the report items. In this example you could either create a series of DID traffic reports, each filtered to a different agent, or you could create a series of agent traffic reports each filtered to a different DID number.
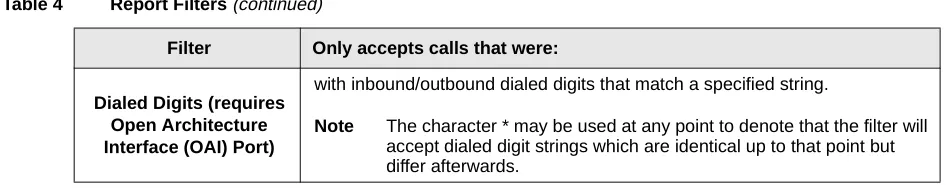
A report filter is made up of a logical combination of filter elements. Each report item within a report template can have a different report filter attached to it if necessary. Table 4 shows the filter elements that are supported:
Call Time Distribution Reports ● Agents ● DIDs ● Extensions ● Lines
● Agent Groups ● DID Groups ● Ext. Groups ● Line Groups
Each line reports a time period for the groups shown in a columnar format.
Wait Time Distribution Reports are used to profile the times into a chart.
Account Code Reports
● Acct Code
Groups
Each line reports the statistics for an account code number.
Account Code Reports present information relating t the purpose of the call as defined by the user.
Forecast Reports
● Standard ● Profile
Each report shows the original data for the period and modified data.
The report can be either a profile or standard report.
Table 4 Report Filters
Filter Only accepts calls that were: Line connected to a specific line.
DID associated with a specific DID number.
Extension connected to a specific extension.
Agent connected to a specific agent.
Account Code attached to a specific account code
Line Group connected to lines within a specified line group.
DID Group associated with DID numbers within a specified DID group.
Extension Group connected to extensions within a specified extension group.
Agent Group connected to agents within a specified agent group.
Account Code Group attached to a specified within an account code group with account codes.
Extension Queue Group inbound and that were finally queued to a specific extension group
corresponding to the Strata DK (EG501 ~ EG516).
Agent Queue Group inbound and finally queued to a specific agent group corresponding to the
Strata DK (AG501 ~ AG516).
Table 3 Available Reports (continued)
Reports
Templates
Individual reports are grouped together to form a template. Templates are created by the user to provide relevant information for the selected devices to be monitored. Report items are added to a template to create all the information desired. These report items can also be configured by the user to include or exclude certain event or traffic types. Once a report template is created, a report for a given time period can be created by selecting the template, work shift, starting time, and ending time for the report.
Keep in mind that Event Reports are highly detailed and therefore it is unlikely that you would want to run this report over long periods of time. Similarly, Profile Reports that are suitable for daily use (say with hourly resolution) would not make sense if the report were being compiled over a six-month time frame. This being the case you will be advised to create many templates all designed for specific use and each containing appropriate report items.
Scheduling
Once the Templates have been created, the final step is to create a schedule to create and print the information. This scheduling is totally optional for the user.
Reports
Having established the type of report you need, use this section to help chose exactly the right report for your needs. This section includes a list of the available report items that can be included in a report template for your reference.
Event Reports
There are three types of event reports, each recording all events that occur on the specified device (agent, extension or line group). Events are caused by the device, such as an agent, receiving an incoming call, accepting a call, dialing an intercom or outgoing call etc.
Agent or extension reports show exactly what an individual device has been doing over the period by examining all events caused by the device’s activities. The report is presented in a call event per row format. Pagination of the report occurs if either there are too many call events to fit in the height of a page or there are too many statistics parameters to fit in the width of a page.
A line group event report provides an event/call trace for a selected line group. You can select the call types in which you are interested, for example, incoming, outgoing or abandoned calls. For example to see a list of all abandoned calls the call center experienced, compile a line group event report for all lines, selecting abandoned calls only.
This report can be useful in finding out the Calling Line Identity (CLID) of the customers who abandoned so their calls may be returned. The report is presented in a call event per row format. Pagination of the report will occur if either there are too many call events to fit in the height of a
Dialed Digits (requires Open Architecture Interface (OAI) Port)
with inbound/outbound dialed digits that match a specified string.
Note The character * may be used at any point to denote that the filter will accept dialed digit strings which are identical up to that point but differ afterwards.
Table 4 Report Filters (continued)
Reports
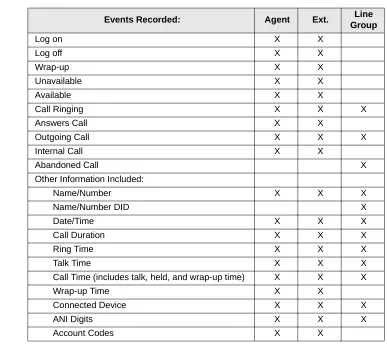
The types of events and call types supported are shown in Table 5.
Table 5 Recorded Call Events
Events Recorded: Agent Ext. Line
Group
Log on X X
Log off X X
Wrap-up X X
Unavailable X X
Available X X
Call Ringing X X X
Answers Call X X
Outgoing Call X X X
Internal Call X X
Abandoned Call X
Other Information Included:
Name/Number X X X
Name/Number DID X
Date/Time X X X
Call Duration X X X
Ring Time X X X
Talk Time X X X
Call Time (includes talk, held, and wrap-up time) X X X
Wrap-up Time X X
Connected Device X X X
ANI Digits X X X
Reports
Traffic Reports for Agents or Extensions
There are four different report types available on the Insight DK for traffic reporting on agents or extensions:
♦ Agent/Extension Traffic Report – provides a breakdown of the traffic for individual agents
within an agent group. An agent/extension traffic report provides historical call statistics data for each device within a selected group. The report is presented in an agent/extension per row format with a “totals“entry for the whole group being presented at the bottom of the report. Pagination of the report will occur if either there are too many devices to fit in the height of a page or there are too many statistics parameters to fit in the width of a page.
♦ Agent/Extension Traffic Profile Report – provides a profile of traffic information for an
individual agent over a number of time periods.
An agent/extension traffic profile report provides historical call statistics data for a selected device presented in a series of uniform time bands. The interval time governing the time bands can be anything from 1 minute up to 999 weeks.
The report is presented in a time band per row format. Pagination of the report will occur if either there are too many time bands to fit in the height of a page or there are too many statistics parameters to fit in the width of a page.
♦ Group Traffic Report – provides a breakdown of traffic information for all agent groups
within an agent super group (group of groups), such as “All Agents”.
An agent/extension group traffic report provides historical call statistics data for each agent group within a selected agent/extension super group. The report is presented in a device group per column format. Pagination of the report will occur if either there are too many groups to fit in the width of a page or there are too many statistics parameters to fit in the height of a page.
♦ Group Traffic Profile Report – provides a profile of traffic information for an agent group,
such as “Sales” or “Support,” over a number of time periods.
An agent/extension group traffic profile report provides historical call statistics data for a selected agent/extension group presented in a series of uniform time bands. The interval time governing the time bands can be anything from 1 minute up to 999 weeks.
Reports
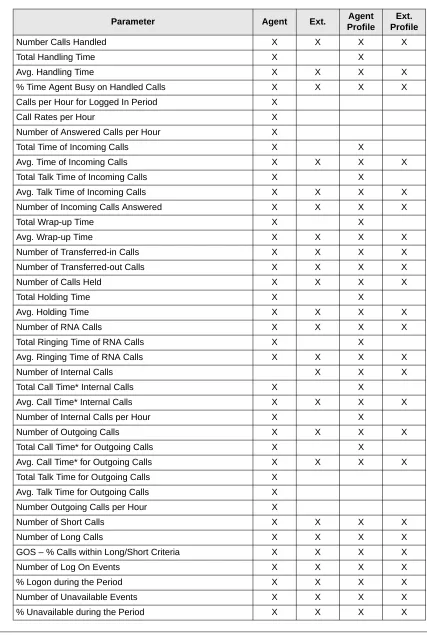
Table 6 shows the parameters available for individual agent or extension reports:
Table 6 Parameters for Agent or Extension Reports
Parameter Agent Ext. Agent
Profile
Ext. Profile
Number Calls Handled X X X X
Total Handling Time X X
Avg. Handling Time X X X X
% Time Agent Busy on Handled Calls X X X X
Calls per Hour for Logged In Period X
Call Rates per Hour X
Number of Answered Calls per Hour X
Total Time of Incoming Calls X X
Avg. Time of Incoming Calls X X X X
Total Talk Time of Incoming Calls X X
Avg. Talk Time of Incoming Calls X X X X
Number of Incoming Calls Answered X X X X
Total Wrap-up Time X X
Avg. Wrap-up Time X X X X
Number of Transferred-in Calls X X X X
Number of Transferred-out Calls X X X X
Number of Calls Held X X X X
Total Holding Time X X
Avg. Holding Time X X X X
Number of RNA Calls X X X X
Total Ringing Time of RNA Calls X X
Avg. Ringing Time of RNA Calls X X X X
Number of Internal Calls X X X
Total Call Time* Internal Calls X X
Avg. Call Time* Internal Calls X X X X
Number of Internal Calls per Hour X X
Number of Outgoing Calls X X X X
Total Call Time* for Outgoing Calls X X
Avg. Call Time* for Outgoing Calls X X X X
Total Talk Time for Outgoing Calls X
Avg. Talk Time for Outgoing Calls X
Number Outgoing Calls per Hour X
Number of Short Calls X X X X
Number of Long Calls X X X X
GOS – % Calls within Long/Short Criteria X X X X
Number of Log On Events X X X X
Reports
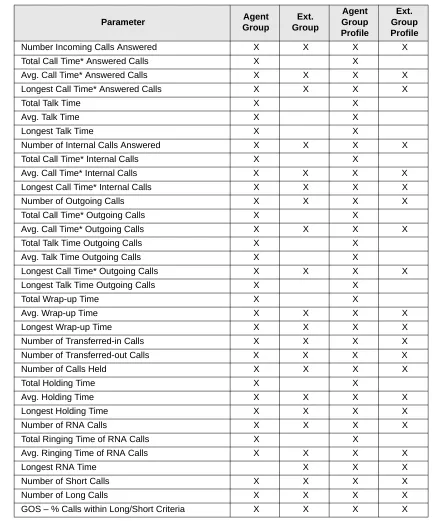
The parameters available for agent or extension group reports are shown in Table 7:
Table 7 Parameters for Agent or Extension Group Reports
Parameter Agent
Group
Ext. Group
Agent Group Profile
Ext. Group Profile
Number Incoming Calls Answered X X X X
Total Call Time* Answered Calls X X
Avg. Call Time* Answered Calls X X X X
Longest Call Time* Answered Calls X X X X
Total Talk Time X X
Avg. Talk Time X X
Longest Talk Time X X
Number of Internal Calls Answered X X X X
Total Call Time* Internal Calls X X
Avg. Call Time* Internal Calls X X X X
Longest Call Time* Internal Calls X X X X
Number of Outgoing Calls X X X X
Total Call Time* Outgoing Calls X X
Avg. Call Time* Outgoing Calls X X X X
Total Talk Time Outgoing Calls X X
Avg. Talk Time Outgoing Calls X X
Longest Call Time* Outgoing Calls X X X X
Longest Talk Time Outgoing Calls X X
Total Wrap-up Time X X
Avg. Wrap-up Time X X X X
Longest Wrap-up Time X X X X
Number of Transferred-in Calls X X X X
Number of Transferred-out Calls X X X X
Number of Calls Held X X X X
Total Holding Time X X
Avg. Holding Time X X X X
Longest Holding Time X X X X
Number of RNA Calls X X X X
Total Ringing Time of RNA Calls X X
Avg. Ringing Time of RNA Calls X X X X
Longest RNA Time X X X
Number of Short Calls X X X X
Number of Long Calls X X X X
Reports
Traffic Reports for Lines or DNIS/DID Numbers
There are four different report types available on Insight DK for traffic reporting on DNIS/DID numbers and three report types for lines:
♦ Line/DID Traffic Report – provides a breakdown of the traffic information for individual
Lines/DIDs within a group.
♦ DID Traffic Profile Report – provides a profile of traffic information for an individual DID
over a number of time periods.
♦ Line/DID Group Traffic Report – provides a breakdown of traffic information for all groups
within a Line/DID super group (group of groups), such as “All Lines” or “All DIDs”.
♦ Line/DID Group Traffic Profile Report – provides a profile of traffic information for a Line/
DID group, such as “Sales DIDs” or “Support Lines”, over a number of time periods.
For each of these reports, to configure the statistics analysis thresholds that control the calculation of GOS refer to “Configuring DID groups or Configuring lines” in the help file.
A Line/DID traffic report provides historical call statistics data for each line or DID number within a selected group. The report is presented in a line/DID per row format with a “Totals” entry for the whole group being presented at the bottom of the report. Pagination of the report will occur if either there are too many devices to fit in the height of a page or there are too many statistics parameters to fit in the width of a page.
A DID traffic profile report provides historical call statistics data for a selected DID number presented in a series of uniform time bands. The interval time governing the time bands can be anything from 1 minute up to 999 weeks. The report is presented in a time band per column format.
Pagination of the report will occur if either there are too many time bands to fit in the width of a page or there are too many statistics parameters to fit in the height of a page.
A Line/DID group traffic report provides historical call statistics data for each DID group within a selected super group. The report is presented in a group per column format. Pagination of the report will occur if either there are too many groups to fit in the width of a page or there are too many statistics parameters to fit in the height of a page.
Reports
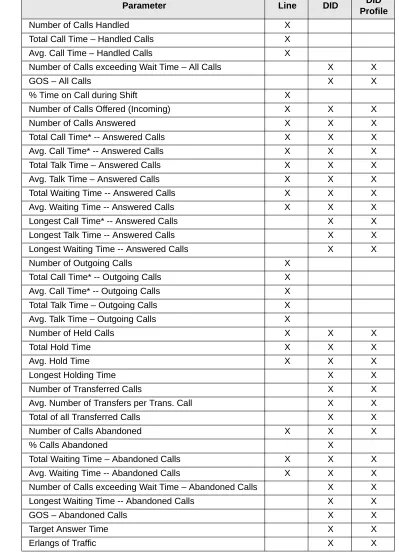
The parameters available for Line or DNIS/DID reports are shown in Table 8:
Table 8 Parameters for Line or DNIS/DID Reports
Parameter Line DID DID
Profile
Number of Calls Handled X
Total Call Time – Handled Calls X
Avg. Call Time – Handled Calls X
Number of Calls exceeding Wait Time – All Calls X X
GOS – All Calls X X
% Time on Call during Shift X
Number of Calls Offered (Incoming) X X X
Number of Calls Answered X X X
Total Call Time* -- Answered Calls X X X
Avg. Call Time* -- Answered Calls X X X
Total Talk Time – Answered Calls X X X
Avg. Talk Time – Answered Calls X X X
Total Waiting Time -- Answered Calls X X X
Avg. Waiting Time -- Answered Calls X X X
Longest Call Time* -- Answered Calls X X
Longest Talk Time -- Answered Calls X X
Longest Waiting Time -- Answered Calls X X
Number of Outgoing Calls X
Total Call Time* -- Outgoing Calls X
Avg. Call Time* -- Outgoing Calls X
Total Talk Time – Outgoing Calls X
Avg. Talk Time – Outgoing Calls X
Number of Held Calls X X X
Total Hold Time X X X
Avg. Hold Time X X X
Longest Holding Time X X
Number of Transferred Calls X X
Avg. Number of Transfers per Trans. Call X X
Total of all Transferred Calls X X
Number of Calls Abandoned X X X
% Calls Abandoned X
Total Waiting Time – Abandoned Calls X X X
Avg. Waiting Time -- Abandoned Calls X X X
Number of Calls exceeding Wait Time – Abandoned Calls X X
Longest Waiting Time -- Abandoned Calls X X
GOS – Abandoned Calls X X
Target Answer Time X X
Reports
The parameters available for Line or DNIS/DID group reports are shown in
Table 9:
Table 9 Parameters for Line and DNIS/DID Group Reports
Parameter Line
Group
DID Group
Line Group Profile
DID Group Profile
Number of Calls Offered (Incoming) X X X X
Number of Calls Answered X X X X
Total Call Time* -- Answered Calls X X X X
Avg. Call Time* -- Answered Calls X X X X
Total Talk Time – Answered Calls X X X X
Avg. Talk Time – Answered Calls X X X X
Total Waiting Time -- Answered Calls X X X X
Avg. Waiting Time -- Answered Calls X X X X
Longest Call Time* -- Answered Calls X X X X
Longest Talk Time -- Answered Calls X X X X
Longest Waiting Time -- Answered Calls X X X X
Number of Calls exceeding Wait Time – All Calls X X X X
GOS – All Calls X X X X
Number of Calls Abandoned X X X X
% Calls Abandoned X X X X
Total Waiting Time -- Abandoned Calls X X X X
Avg. Waiting Time -- Abandoned Calls X X X X
Longest Waiting Time -- Abandoned Calls X X X X
Number of Calls exceeding Wait Time – Abandoned Calls X X X X
GOS – Abandoned Calls X X X X
Number of Outgoing Calls X X
Total Call Time* -- Outgoing Calls X X
Avg. Call Time* -- Outgoing Calls X X
Longest Call Time* -- Outgoing Calls X X
Total Talk Time – Outgoing Calls X X
Avg. Talk Time – Outgoing Calls X X
Longest Talk Time – Outgoing Calls X X
Number of Held Calls X X X X
Total Hold Time X X X X
Avg. Hold Time X X X X
Longest Holding Time X X X X
Number of Transferred Calls X X X X
Avg. Number of Transfers per Trans. Call X X X X
Total of all Transferred Calls X X X X
Target Answer Time X X X X
Reports
Utilization Reports
Utilization reports apply to agents and extensions and are available in two formats: standard and profile. There are four utilization reports in all.
An agent or extension utilization report provides historical time utilization data for each agent or extension within a selected group. Note that the times are shown as a percentage normalized to the shift that you collated the report with. The report is presented in an agent per row format with a “totals” entry for the whole group being presented at the bottom of the report.
Pagination of the report will occur if either there are too many agents to fit in the height of a page or there are too many statistics parameters to fit in the width of a page. Utilization percentages can be calculated with respect to either the total reporting period or the amount of time each agent had spent logged on.
Note The “totals” entry for each column is the average for all the agents/extensions in the group.
An agent utilization profile report provides historical time utilization data for a selected agent presented in a series of uniform time bands. The interval time governing the time bands can be anything from 1 minute up to 999 weeks. The report is presented in a time band per column format. Pagination of the report will occur if either there are too many time bands to fit in the height of a page or there are too many statistics parameters to fit in the width of a page.
Utilization percentages can be calculated with respect to either each profile interval or the agent/ extension logged on time with each profile interval.
Note The times are shown as a percentage normalized to the shift that you collated the report with.
The parameters for Utilization reports are shown in Table 10.
Table 10 Utilization Report Parameters
Parameter Agent Ext. Agent
Profile
Ext. Profile
Time Handling Incoming Calls X X X X
Time Handling Outgoing Calls X X X X
Time Handling Internal Calls X X X X
Time Incoming Calls Held X X X X
Time Outgoing Calls Held X X X X
Time Internal Calls Held X X X X
Time in Wrap-up X X X X
Time Unavailable X X X X
Time Busy X X X X
Time Free X X X X
Time Ringing Incoming Calls X X X X
Time Ringing Internal Calls X X X X
Time Logged On X X X X
Reports
Contention Reports (Insight DK Plus Only)
Contention reports are available as standard or profiled over flexible time periods.
A standard contention report provides the percentage of time a variable number of members in a group were simultaneously free/busy. The statistics are presented either as non-cumulative or cumulative.
♦ Non-cumulative - Each line of the report gives the percentage of time that exactly that
number of members were free.
♦ Cumulative - The first line of the report gives the percentage of time zero members were free.
The second line gives the percentage that up to one member was free. The third line gives the percentage that up to two members were free and so on until the number of members in the group or Max Items has been reached.
A series of either line groups, extension groups, or agent groups can be analyzed within a single report. The report is presented in a group member per row format. Pagination of the report will occur if either there are too many group members to fit in the height of a page or there are too many groups to fit in the width of a page.
A contention profile report provides historical time data for the percentage of time a variable number of members in a group were simultaneously free/busy. The statistics are presented either as non-cumulative or cumulative.
A single report can analyze a line group, an extension group, or an agent group. The report is presented in a time band per column format. Pagination of the report will occur if either there are too many time bands to fit in the height of a page or there are too many statistics parameters to fit in the width of a page.
Wait Time Distribution Report
A wait time distribution report provides the number of calls and percentage of calls whose wait time fell within a series of user configurable time bands. The report can analyze the waiting time distribution of either answered or abandoned calls or both together if required. A series of either line groups, DID numbers or DID groups can be analyzed within a single report.
The report is presented in a wait time band per row format. Pagination of the report will occur if either there are too many time bands to fit in the height of a page or there are too many groups/DID numbers to fit in the width of a page.
Account Code Report
An account code traffic report provides historical call statistics data for each account code within a selected account code group. The call statistics parameters available are as follows:
♦ Total number of calls for each account code (this is a summation of the selected call categories
within the report).
♦ Average handling time of these calls.
♦ Number of incoming calls that were answered for each account code.
♦ Average call time of these answered calls (this includes wrap-up time).
♦ Number of incoming calls that were transferred from another extension/agent for each account
code.
♦ Number of incoming calls that were transferred to another extension/agent for each account
Using MIS Reports to Improve Performance
♦ Average holding time of these held calls.
♦ Number of internal/intercom calls for each account code.
♦ Average call time of these intercom calls.
♦ Number of outgoing calls for each account code.
♦ Average call time of these outgoing calls.
The report is presented in an account code per row format with a “totals” entry for the whole group being presented at the bottom of the report. Pagination of the report will occur if either there are too many account codes to fit in the height of a page or there are too many statistics parameters to fit in the width of a page.
Using MIS Reports to Improve Performance
Now that you are able to create report templates to provide you with the reports for the periods of interest what do they all mean? This section deals with some of the potential problems identified using the reporting package and possible solutions to those problems. As with many things there could be a number of ways to improve performance and increase productivity so you may need to try different things to see which work the best.
Abandoned calls and long waits
You may identify a problem of too many abandoned calls and complaints of long waits. Here are some solutions to this problem:
Solution A
Using methods for keeping the caller waiting is usually one of the first methods employed to handle the callers. This can be accomplished using the recorded announcement facilities. Well worded messages played to callers in the queue have proved to be very successful in this area. Avoid repeating the same message over and over and consider playing music or other recorded information between greetings.
Solution B
If your staff make outgoing calls at the same time as they receive inbound calls consider restricting the outbound activity to a less busy time of day. Use Profile Reports to identify the peak times and the quietist times.
Solution C
Consider overflowing calls to other members of staff in other areas of the business. Although this could be less than ideal it could eliminate the lost order or lost customer. Research has shown that 60% of callers who abandon do not call back.
Solution D
If you do not use headsets, consider introducing them. Headset use will speed up calls whenever keyboard work is involved. Headsets could also permit the use of the auto answer feature on Strata DK. This speeds up the call process and reduces noise and stress in the call center.
Solution E
Using MIS Reports to Improve Performance
Complaints of busy signals
Use the Contention or Contention Profile Report to identify the size and timing of the problem. Caution should be used before rushing out and adding more lines, even though they may be relatively inexpensive. The additional lines could result in periods where callers go unanswered if the staff available is not adjusted to take more calls.
Solution A
Assuming you have staff available to answer the extra volume, add more lines to your system.
Solution B
If your staff make outgoing calls at the same time as they receive inbound calls consider restricting the outbound activity to a less busy time of day. Use Profile Reports to identify the peak times and the quietest times.
Solution C
Find out if it is possible to reduce the duration of calls. If you can achieve this without reducing the quality of service then this will allow you to answer more calls with the same number of lines and people. Call duration can is the time spent on the call plus the wrap-up time allocated for the end of the call. Before embarking on a call time reduction campaign consider the profile of the best agent. Maybe when you look at this person you may consider training your staff to the performance level of this best person.
Solution D
Check out the wrap-up time associated with telephone calls. If the time is excessive, find out why. It could be, for example, that quotations have to be sent out, perhaps faxing from the PC could speed up the process thereby increasing the volume of calls that can be handled.
One client established that the average time spent in wrap-up where an order was placed took over ten minutes because the sales agent had to print off an order confirmation and take it to the mail room for processing. Now the printer is located in the mail room and wrap-up time is reduced by 75%.
Unexpected out-of-hours customer demand
Using the Out of Hours shift for reports, you establish that there is a demand for your services when you are closed.
Using Profile Reports identify the demand and the timing and consider opening at this time to handle the calls. If this is not possible consider giving callers the option to leave a message to be dealt with as a priority when you start work. The third option could be to overflow to a bureau. In all cases it is recommended to play an out of hours message apologizing for the fact you are closed, stating your opening times and if alternatives are available state what they are.
Complaints about too many transfers
You may have customers who complain their call gets passed around the organization before they get the person who can deal with their problem.
Creating Reports
If high proportions of calls are transferred because they are not dealt with by the receiving department consider other methods of routing the calls into the correct department without human intervention. Ideas here include using DID numbers to route calls into appropriate departments. This is ideal if you are in a position to educate your callers.
The ideal caller here would be a field employee, employees at other locations and customers. Another idea would be to answer all calls with an Auto-Attendant (AA) and make the user select from a menu. The AA would then route the call according to the selection made.
Creating Reports
Report templates define the look and content data included in a report. You can use any of the default report templates or create custom templates that can be used over and over. The steps show how to create a custom template.
Note To further refine the report content, also see “To Filter Reports” on Page 16.
Create a Report Template
1. Click on the Reporter icon
2. Click on the Report Template icon
...or select Set-up, Report Templates.
3. Type a new
template name over the existing name
From the Report Templates, you can create/edit
templates:
♦ Add ♦ Change ♦ Delete ♦ Rename
The Change button turns into the Add button when you type a new template name.
This is the template file name. The name that appears on the printed report is entered later, in Step 4.
Creating Reports
Edit the Report Contents
4. Click the Add...button, then enter the report title in the Print Name box.
...or click Delete, then select the name of a template to delete.
...or click Rename. From Rename Report Template, type in a New Template Name.
5. Click OK.
6. Click Close.
1. Select Reports, Report Templates.
2. From Report Templates, click Change.
3. Click Edit Item.
4. From the Configure Report dialog box:
♦ Select the Agent Group from the pull-down list
♦ Select Agent Number, Name or Both
♦ Select any of Total:
Calls, Time, Usage
3463
Creating Reports
Filter the Report Contents (optional)
Filtering is how to selectively determine the content of a report. The Configure Report window contains checkbox selections that indicate the data to be included. These items are defined in the Reports Glossary or the user guide glossary. We suggest that you create various reports selecting different Report Items and data to determine which combination works best for you.
♦ Select Calls: Answered, Transferred, Ring On, Intercom, Outgoing
♦ Select
Performance: Calls, Availability, Call Rate
You can set Call Rate (in the Performance section) to display twice: once for the Total Call Rate, once for the Average Call Rate.
The Call Rate is the number of calls taken/made per hour by an agent. However, the time that the agent is logged on is taken into account to give a more accurate figure. The Call Rate is then worked out by dividing the number of calls by the time logged on.
Call Rate = Total Number of Calls Time Logged On
♦ Display Times
♦ Miscellaneous
5. Click OK, then go to Filter the Report Contents (optional)
...or click Filter (optional), and refer to “Print the Report” on Page 34.
1. If you clicked Filter; from the Report Filter box, click Add Element, Delete Element or Edit Element.
...or, if you clicked OK in the previous window, proceed to the next step.
Creating Reports
Print the Report
If you have a color printer, Insight Reporter can produce color printouts. 2. Click Add
Element.
3. Select the type of filter(s) to be used.
4. Click OK three times, click Close.
Hint: It is helpful to rename filtered files so that you can identify which filter has been applied to it.
5. Select File, Print, OK.
1. Click on the New icon
...or select File, New.
Select:
♦ The time period for the report to cover
♦ Report Shift
♦ A report template
The available Report Shifts are created from Configure Shift window. See “Creating or Editing Shifts” on Page 13 for more details.
2. Click OK. The report should be compiled in a few minutes. A sample report is shown in Figure 1.
3547
Exporting Reports
Figure 1 Sample Agent Traffic Report
Exporting Reports
Report information can be saved in comma delimited ASCII format that can be imported into most commercial spreadsheet and database programs. Plain text fields are exported in double quotes.
♦ Integers are exported without quotes.
♦ Floating point number, such as averages, are exported without quotes with three decimal places
Note The Insight DK Plus ODBC import/export capability works with a Microsoft ODBC 16-bit Driver.
1. Click on the Export icon
...or click on File, Export.
2. In the Drives list box, select a drive to save the file in.
3. Select a Directory to save the file in
4. Enter a file name, click OK.
24 Hour START: STOP:
Monday 11/26/98 14:30 11/30/98 Agent Calls
Total Answered Calls RNA Outgoing
Part 1 of 2
Page 1 of 3 on 11/09/98 Ave. Time % Use Calls Ave. Call Ave. Talk Ave. Wrap Avg. Wait Avg. Talk Avg. Calls Calls All Reports on Insight DK+
Demonstration
Agent Traffic for All Agents
15:30 Friday
Andrew Parker 1 01:26:25 1.2 0 00:00 00:00 00:00 1
Dave Stringer 95 14:57 19.7 84 16:80 13:49 02:29 11
Dale Whitaker 96 09:47 13.0 81 11:18 08:32 02:46 15
Beverly Cardner 101 12:12 17.1 98 12:24 09:36 02:48 2
Phil Otell 0 00:00 0.0 0 00:00 00:00 00:00 0
Jane Yeasky 79 16:49 18.5 70 16:45 14:31 02:14 9
Jenny Harrington 0 00:00 0.0 0 00:00 00:00 00:00 0
Alan Harrson 15:01 13.6 58 16:33 14:27 02:06 7
Gareth Wear
65
13:23 13.4 63 14:27 11:43 02:44 8
Tracy Oldman 72
18:02 16.8 60 19:58 17:30 02:28 7
Alson Halton
67
16:28 17.4 51 16:24 02:16 25
00:00 00:00 00:00 06:57 00:00 00:00 00:00 00:00 06:39 00:00 00:00 67 14:08 01:26:25 04:38 01:37 04:55 00:00 17:20 00:00 02:13 05:50 01:25 16:35 01:26:25 04:38 01:37 04:55 00:00 17:20 00:00 02:13 05:50 01:25 16:35 76 Calls 0 0 0 1 0 0 0 0 1 0 0
Total 652 14:25 11.9 565 15:11 12:40 02:31 2 06:48 85 09:35 09:35