www.elsevier.nl/locate/susc
Role of image forces in non-contact scanning force
microscope images of ionic surfaces
L.N. Kantorovich, A.S. Foster *, A.L. Shluger, A.M. Stoneham
Department of Physics and Astronomy, University College London, Gower Street, London, WC1E 6BT, UKReceived 20 August 1999; accepted for publication 13 October 1999
Abstract
We consider the effect of the image interaction on the force acting between tip and surface in non-contact scanning force microscope experiments. This interaction is relevant when a conducting tip interacts with either a polar bulk sample or with a thick film grown on a conducting substrate. We compare the atomistic contribution due to the interaction between the microscopic tip apex and the sample with the macroscopic van der Waals and image contributions to the force on the tip for several representative NaCl clusters adsorbed on a metal substrate. We show that the microscopic force dominates above the plain (001 ) terrace sites and is solely responsible for image contrast. However, the image force becomes comparable to the microscopic force above the surface di-vacancy and dominates the interaction above a charged step. © 2000 Published by Elsevier Science B.V. All rights reserved.
Keywords: AFM; Construction and use of effective interatomic interactions; Insulating films; Metal–insulator interfaces; NaCl; Surface defects
1. Introduction metal tips are employed. However, recent
applica-tions of scanning tunnelling microscopy (STM ) to oxides [2] and insulating films grown on metal Although the importance of image interactions
substrates [3], and combined applications of STM has been recognised in metal–insulator interfaces,
and non-contact SFM (NC-SFM ) (e.g. see Refs. electrochemistry and other areas, their role in
[4–6 ]) bring these interactions to the forefront. In image formation in scanning force microscopy
these applications, conducting tips are interacting (SFM ) has not been analysed in detail [1]. The
with thin polar films grown on metal substrates or reasons are mainly related to the small number of
with conducting oxides. This means that both the experimental situations where these forces were
interactions of the tip with the film and of the film evidently important, e.g. where an ionic insulator
with the substrate involve the image force and it would make a contact with a conducting tip. In
should be taken into account in analysis and particular, in most of the SFM applications on
interpretations of SFM images. Although the same insulators, either insulating tips or oxidised Si and
is true for ‘contact mode’ imaging, in this paper we will focus on a more simple case of NC-SFM in vacuum.
* Corresponding author. Fax:+44-(0)171-3911360.
E-mail address:adam.foster@ucl.ac.uk (A.S. Foster) In most NC-SFM setups the cantilever is driven 0039-6028/00/$ - see front matter © 2000 Published by Elsevier Science B.V. All rights reserved.
with a constant frequency of 100–200 kHz and 2. Theory makes oscillations with an amplitude of about
2.1. Theoretical model 100–200 A˚ above the surface [6,7]. When the end
of the tip approaches the sample, the main
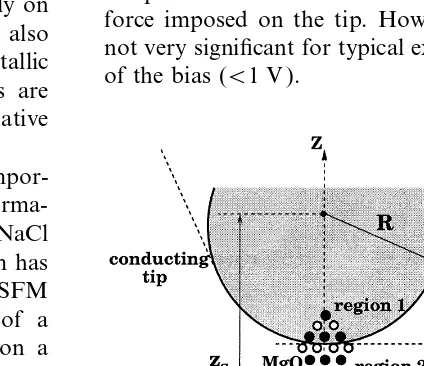
fre-We consider a conducting spherical tip of radius quency of the cantilever oscillations changes due
R interacting with a conducting semi-infinite sub-to the tip–surface interaction. The surface image
strate (substrate) with an adsorbed finite cluster of is obtained as a map of the displacements of the
ionic material (sample) on it (see Fig. 1). To model base of the cantilever required to maintain a
contamination of a conducting tip by an ionic constant frequency change as the tip scans the
material, we embed a finite cubic MgO cluster surface. Contrast in an image is produced by
oriented by one of its corners down to the NaCl making displacements away from the surface
cluster adsorbed on the metal substrate, as shown bright, and those towards it dark. The most stable
in Fig. 1. This model is similar to the one used in imaging has been obtained in the attractive region
Ref. [8], except that now the tip and substrate are of the tip–surface interaction near the surface.
conductive. Their conductivity should be enough Experimental [7] and theoretical estimates [8]
to keep their surfaces at constant potential at each demonstrate that, for stable imaging, the distance
point of slow cantilever oscillations. The tip and between the end of the tip and the surface atoms
substrate are connected in a joint circuit, as shown should be larger than about 4–5 A˚ . However, these
in Fig. 1. experimental conditions are very difficult to
main-Bias applied to the tip and substrate will pro-tain and, in most cases, the tip crashes into the
duce an external non-uniform electrostatic field surface many times during one series of
experi-and an additional contribution to the system ments [9], but a change of the tip structure during
energy, which will affect both the geometry of the one image is a relatively rare event. Therefore, the
sample atoms and those of the tip apex, and the structure of the tip apex is dependent not only on
force imposed on the tip. However, this effect is vacuum conditions and tip preparation but also
not very significant for typical experimental values on the stability of imaging. Most of the metallic
of the bias (<1 V ). or doped Si tips used in SFM experiments are
likely to be covered either by islands of a native oxide and/or by the surface material.
In this paper we consider the relative impor-tance of image forces in NC-SFM contrast forma-tion using the example of a finite cluster of NaCl adsorbed on a metallic substrate. This system has been studied in recent STM [3] and NC-SFM experiments [10,11] and is representative of a common case of an insulating film grown on a metal. First, we describe a numerical method for the effective calculation of the image force between tips and surfaces and its implementation within an atomistic simulation technique. Then we study the relative strength of the image force with respect to the van der Waals and chemical forces in different representative tip–surface systems. These include the surface terrace, neutral and charged steps, and
Fig. 1. Schematic picture of the microscopic model used here a dipole formed by a vacancy pair at a step. to simulate the interaction between the tip and the sample. The Finally, we discuss the results and limitations of coordinate axes are aligned with respect to the sphere centre (at
x=y=0,z=z
s) and the metal plane (atz=0) for convenience.
Another contribution, which can be more sig- Finally, the sample atoms in region 3 are also
nificant for the processes that take place in an allowed to relax, except in the two layers closest
SFM experiment, is to do with the polarisationof to the substrate (region 4). The interactions
conductive electrodes by the charge density of the between atoms in regions 1 to 4 are calculated
sample. The potential on the tip and substrate is using semi-empirical interatomic potentials and
maintained by external sources (we shall call them the shell model to treat atomic polarisabilities. a battery). The sample charge density will change Details of these calculations are given in this potential. To prevent this from happening, the Section 3.1.
battery will move some charge between the tip and In order to calculate the force imposed on the
substrate in order to keep the potential constant. tip we used the following expression for the total
Therefore, there will be some net distribution of energy of the system:
charge density on their surfaces that will also
interact with the sample and will affect the force U=1 2∑∞
ij
vij+U
vdW+Uel, (1)
imposed on the tip. This kind of induced charge has been commonly referred to as theimage charge
where v
ij is the interatomic potential between and we will call this interaction the image
atomsi,jin regions 1 to 4. This interaction energy interaction.
is a function of both the tip position z
s and the A preliminary account of this effect in
applica-coordinates r
i of all atoms (and shells) involved. tion to SFM has been given in Ref. [12], where a
The energy U
vdW represents the van der Waals
simple model example has been considered. Here
interaction between the macroscopic tip and sub-we present the theoretical microscopic model in
strate and depends only on the tip height z s with detail and propose an efficient method that can be
respect to the substrate (see Fig. 1). Note that in used to take this effect into account in a systematic
the present model the macroscopic van der Waals manner. Note that quantum effects in metal
polari-interaction does not affect atomic positions in sation [13–16 ] are neglected here and our
consider-regions 1 to 4. ation is based entirely on classical electrostatics.
The last term in Eq. (1) represents the total According to this model, the image charge does
electrostatic energy of the whole system. We not penetrate into the bulk of the metal. In reality,
assume that the Coulomb interaction between all however, there is some distribution of the charge
atoms in regions 1–4 is included in the first term inside the metals [13–15]. However, this effect is
in Eq. (1) and hence should be excluded from not important for processes that occur at distances
U
el. Therefore, the energy Uel includes the inter-of the order inter-of several A˚ ngstro¨ms outside the
action of the atoms in the system with the macro-metal and, therefore, will be neglected in this study.
scopic tip and substrate. As has been demonstrated All the atoms comprising the microscopic part
in Ref. [12], the correct electrostatic energy should of the system are split into three regions, as shown
incorporate the work done by the battery to main-schematically in Fig. 1. The tip apex is modelled
tain the constant potential on the electrodes. This by a cluster that is formally divided into two
can be written in the following form [12]: regions. The atoms in region 2 are allowed to
adjust their positions, whereas atoms in region 1 U
el=−12Q(0)V+∑ 1
q
iw(0)(ri)+12∑ i,j
q
iqjwind(ri,rj). are kept fixed in order to keep the shape of the
apex. The atoms in region 1 move together with
(2) the macroscopic part of the tip and, therefore,
their positions are determined only by the tip
Here V is the potential difference applied to the position along the vertical z-axes, which we will
metal electrodes. In the setup shown in Fig. 1, denotez
s. Atoms in region 2 follow the tip as well,
without loss of generality [12], one can choose the since they are strongly bound to the atoms in
potentialw on the metal plane to be zero, so that region 1. However, their positions can change
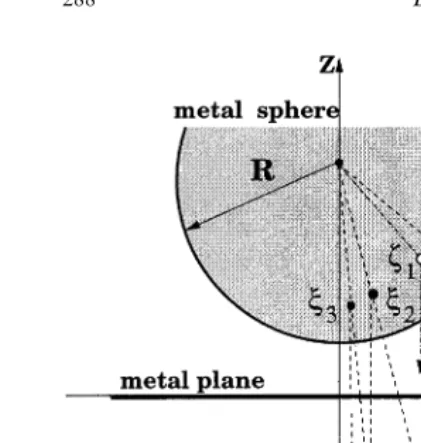
will be w=V. We also note that the substrate is the bare electrodes could be calculated [12] if we knew the exact Green function of the electrostatic considered in the limit of a sphere of a very big
problem radius R∞&R, since the metal electrodes formally
cannot be infinite [12]. The charge on the tip
Dr∞G(r,r∞)=−4pd(r−r∞) (4)
withoutcharges outside the metals (i.e. when there
with the corresponding boundary conditions are only bare electrodes and the polarization effects
[G(r,r∞)=0 when r or r∞ belong to either the can be neglected ) is Q(0) and the electrostatic
substrate or the tip surface] [18]. Therefore, given potential of the bare electrodes anywhere outside
the applied biasV, the geometric characteristics of the metals is w(0)(r). The charge Q(0) and the
the capacitor and the positions {r
j} of the point potential w(0)(r) depend only on the geometry of
charges {q
i} between the tip and sample, one can the capacitor formed by the two electrodes and on
calculate the electrostatic energyU
el. The problem
the bias V. The charge Q(0) can be calculated
is that the Green function for real tip–sample from the potentialw(0)(r) as follows [17]:
shapes and arrangements is difficult to calculate. However, for a number of simple geometries, exact Q(0)=− 1
4p
P P
∂w(0)
∂n ds, solutions of the corresponding electrostatic
prob-lems exist. The most common is the planar–planar
where the integration is performed over the entire geometry [19–22], although some non-planar
surface of the macroscopic part of the tip with the geometries have also been considered, for example integrand being the normal derivative of the poten- a planar–hyperboloidal [22,23], a planar–spherical tial w(0)(r); the normal n is directed outside the [24] and a planar–planar junction with a spherical
metal. Summation in the second term of Eq. (2) boss at one of the electrodes [25,26 ].
is performed over the atoms and shells of the In this study we use the planar–spherical
geome-sample and those of the tip apex that are repre- try of the junction, as depicted in Fig. 1. Although
sented by point charges q
i at positions ri. Note a similar model has already been considered in
that only those atoms and shells of regions 2–4 Ref. [24], no details were given and the authors of
are considered explicitly in the energy U
el and the cited paper claimed that the method of multiple
included in the summation in Eq. (2) (see images that they used did not give a well-converged
Section 3.1). expansion. Therefore, in Section 2.2 we give a brief
description of our method, which is also based on Finally, w
ind(r,r∞) in Eq. (2) is the potential at
the method of multiple images, together with some r due to image charges induced on all the metals
details that will be important later to derive the by a unit point charge at r∞. This function is
forces acting on the charges and on the tip. Our directly related to the Green function G(r,r∞) of
method appears to be more efficient than the one
the Laplace equation, w
ind(r,r∞)=G(r,r∞)− applied in Ref. [24], as we sum the series of image (1/|r,r∞|), and is symmetric [12], i.e. w
ind(r,r∞)= charges explicitly only for a small number of the
w
ind(r∞,r), due to the symmetry of the Green func- first terms, whereas the rest of the series is summed tion itself [18]. The total potential at r due to a
analytically up to infinity. Note that a similar idea net charge induced on all conductors present in
was employed in Ref. [20], where the rest of the the system by all the point charges {q
i}: series of image charges for the planar–planar
junc-w
ind(r)=∑ i
q
iwind(r,ri) (3) tion was integrated.
is the image potential. Note that the last double 2.2. Solution of the electrostatic problem of point
summation in Eq. (2) includes the i=j term as charges inside the sphere–plane capacitor
well. This term corresponds to the interaction of the chargeq
iwith its own polarisation (similar to First, let us consider the calculation of the
the polaronic effect in solid-state physics). potential w(0)(r) of the bare electrodes, i.e. the
The function w
ind(r,r∞) and, therefore, the capacitor problem. We note that the potential
w(0)(r) satisfies the same boundary conditions as image,w
the original problem, i.e. w(0)=0 andw(0)=−Vat charge z
k∞ (sˆ means reflection with respect to the
the lower and upper electrodes respectively. The substrate surface z=0). To find the charge Q(0),
solution for the plane–spherical capacitor is well which is also needed for the calculation of the
known [19] and can be given using the method of electrostatic energy, Eq. (2), one should calculate
image charges (see also Ref. [12]). Since we will the normal derivative of the potential w(0)(r) on need this solution for calculating forces later on, the sphere and then take the corresponding surface we have to give it here in detail. It is convenient integral (see above). However, it is useful to recall to choose the coordinate system as shown in Fig. 1. that the total charge induced on the metal sphere
Then it is easy to check that the following two due to an external charge is equal exactly to the
infinitesequences of image charges give the poten- image charge inside the sphere [17,18]. Therefore,
tial at the sphere and the metal planes as V and one immediately obtains:
zero respectively. The first sequence is given by
the image charges z
1=RV and then zk+1=zk/Dk Q(0)= ∑ k=1
k0
z:
k. (6)
for Yk=1, 2, …, where the dimensionless
constants D
k are defined by the recurrence Note that the potential w(0)(r) and the chargeQ(0)
relation D
k+1=2l−(1/Dk) with D1=2l and depend on the position zsof the sphere indirectly
l=z
s/R>1,zs being the distance between the via the chargesz
kand their positionsrzkaccording
sphere centre and the plane ( Fig. 1). The point to the recurrent expressions above. Therefore, one
charges {z
k} are all inside the sphere along the has to be careful when calculating the contribution
normal line passing through the sphere centre. to the force imposed on the tip due to biasV[i.e.
Their z-coordinates are as follows: z
1=zs and when differentiating w(0)(r) andQ(0)in Eq. (2)]. z
k+1=R[l−(1/Dk)]=R(Dk+1−l) for Yk= Now we turn to the calculation of the function 1, 2, …. The second sequence of charges {z
k
∞} is w
ind(r,r∞) in Eq. (2). This function corresponds to
formed by the images of the first sequence with the image potential at a point r due to a unit
respect to the metal plane, i.e. z
k ∞=−z
k and zk∞= charge atr∞. This potential is to be defined in such
−z
k. An interesting point about the images a way that, together with the direct potential of
charges {z
k} is that they converge very quickly at the unit point charge, it should be zero on both the point z
2=R앀l2−1 (i.e. zk2 with k2) electrodes (the boundary conditions for the Green and thatz
k+1<zkYk. This is because the numbers function). Thus, let us consider a unit chargeq= D
k converge rapidly to the limiting value 1 atr
qsomewhere outside the metal electrodes, as D
2=l+앀l2−1, which follows from the original shown in Fig. 2. We first create the direct image
recurrent relation above, D
2=2l−(1/D2). −q of this charge with respect to the plane at the Therefore, while calculating the potential w(0)(r),
point r q ∞=sˆr
q to maintain zero potential at the
one can consider the charges {z
k} and {zk∞} explic- plane. Then, we create images of the two charges, itly only up to some k=k
0−1 and then sum up q=1 and−q=−1, with respect to the sphere to
the rest of the charges to infinity analytically to
get two image charges j
1=−R/|rq−Rs| and obtain the effective charge
f
1=R/|sˆrq−Rs|, as shown in Fig. 2, where R
s=(0, 0,zs). These image charges are both inside
z
2= ∑
k=k0 2
z
k= ∑ n=0
2 z
k0 Dn 2
=zk0D2 D
2−1 the sphere by construction and their positions canbe written down using a vector function to be placed atz
2. This can be usedinsteadof the f(r)=R
s+R2[(r−Rs)/|r−Rs|2] as follows:
rest of the series: r
j1=f(rq) and rz1=f(sˆrq). Now the potential at the surface will be zero. At the next step we
w(0)(r)= ∑
k=1 k0
z:
k
A
1|r−r zk|
− 1
|r−sˆr zk|
B
, (5) construct the imagesj
1 ∞=−j
1andf1∞=−f1of the charges j
1andf1in the plane, at pointssˆrj1 and
sˆr
f1 respectively, to get the potential at the plane where z:
k=zk for k<k0 and z:k0=z2; then,
also zero. This process is continued, and in this r
zk=(0, 0,zk) is the position vector of the charge
z
notation, let us assume that the original charge is in thexz-plane. Then it follows from Eq. (7) that x
jk+1<xjk. It is also seen that xjk0 and z
jkz2=R앀l2−1 (see above) as k2 and the same for thef-sequence. This means that the image charges inside the sphere move towards the vertical line passing through the centre of the sphere and finally converge at the same point z
2. This is the same behaviour we observed for charges in the capacitor problem at the beginning of this section (see Fig. 2). In fact, the calculation clearly shows a very fast convergence, so that we can again sum
up the series of charges from k=k
0. Thus, the image potential at a pointrdue to the unit charge at r
qis:
w
ind(r,rq)=− 1
r−sˆr q
+ ∑
k=1 k0
C
j:k
A
1|r−r jk|
− 1
|r−sˆr jk|
B
Fig. 2. Construction of image charges in the sphere–plane +f: k
A
1
|r−r fk|
− 1
|r−sˆr fk|
BD
, (8)
capacitor system due to one chargeqoutside the metals.
where j:
k=jk for k<k0 and j:k0=j2=
j
k0(D2/D2−1), and similarly for the f-sequence.
constructed, which are given by the following Here D
2 is the geometrical characteristic of the
recurrence relations: capacitor introduced at the beginning of this
section.
As has already been mentioned in Section 2.1,
j
k+1=jk R
|sˆr
jk−Rs| the function wind(r,rq) must be symmetric with
respect to the permutation of its two variables. It is not at all obvious that this is the case, since the r
fk+1=f(sˆrjk)=Rs+R2
sˆr jk−Rs
|sˆr
jk−Rs|2
, (7)
meaning of its two arguments in Eq. (8) is rather different. Nevertheless, we show in Appendix A wherek=1, 2, … and similarly for thef-sequence.
that the functionw
ind(r,rq) is symmetric. Note, however, that the two sequences start from
different initial charges. Namely, the j-sequence
starts from the original chargeqand thef-sequence 2.3. The calculation of the total force acting on the tip
from its image in the plane−q. The two sequences {j
k} and {fk} are to be accompanied by the other two sequences {j
k
∞} and {f
k
∞}, which are the images In order to calculate the total force acting on
the tip, one has to differentiate the total energy, of the former charges with respect to the plane.
The four sequences of the image charges and the Eq. (1), with respect to the position of the sphere
R
s. Since we are interested only in the force acting chargesqand−q provide the correct solution for
the problem formulated above since they produce in the z-direction, it is sufficient to study the
dependence of the energy onz
s. There will be three the potential that is the solution of the
correspond-ing Poisson equation and, at the same time, is zero contributions to the force. The force from the
electrostatic energy is considered in some detail in both on the metal sphere and the metal plane.
Finally, the interatomic interactions in regions 1– energyU
sh. Therefore, finally we have: 4 lead to a force that is calculated by differentiating
the shell-model energy [the first term in Eq. (1)]. F
tip= ∑ iµ1
[F(sh) iz ]x0−
dU vdW dz
s
−
A
∂Uel∂z s
Bx
0, (12)
Therefore:
where the first summation runs only over atoms F tip=− dU sh dz s
−dUvdW dz
s
−dUel dz
s
, (9) in region 1. Thus, in order to calculate the force
imposed on the tip at a given tip positionz s, one has to relax the positions of atoms in regions 2
whereU
sh=12Sij∞vijis the shell model energy. We and 3 using the total energy of the system,
recall that the summation here is performed over U
sh+Uel. Then one calculates the shell-model all atoms in regions 1 to 4. Only positions of the force, F(sh)
iz , acting on every atom in region 1 in
atoms in region 1 depend directly on z
s, since thez-direction as well as the electrostatic contribu-atoms in regions 2 and 3 are allowed to relax. tion to the force given by the last term in Eq. (12). However, their equilibrium positions, r(0)
i , deter- The van der Waals force between the macroscopic
mined by the minimisation of the energy of tip and sample does not depend on the geometry
Eq. (1), will dependindirectlyonz
sat equilibrium, of the atoms and can be calculated just once for
r(0)
i =r(0)i (zs). Then, we also recall that the electro- every given z s. static energy U
el depends only on positions of Although the expression for the force obtained
atoms in regions 2 to 4, as well as on the tip above is exact for the model used in this study,
positionz
s. such a calculation is quite demanding since it
Let us denote the positions of atoms in regions requires using the electrostatic energyU
elalongside 2 to 4 by a vector x=(r
1,r2, …). The total energy with the shell-model energyU
shin the optimisation U=U(x,z
s), where the direct dependence on zs process. Most time is spent in the calculation of
comes from atoms in region 1 of the shell model the forces imposed on atoms due to the energy
energy U
sh and from the electrostatic energyUel. U
el. Therefore, in this work we have adopted the
In equilibrium the total energy is a minimum: following approximate strategy. For every tip
posi-tion, all atoms in regions 2 and 3 were allowed to relax to mechanical equilibrium in accordance with
A
∂U∂x
Bz
s=0, (10)
the shell-model interactions only and we neglected the effect of the image charges on their geometry. To investigate the effect of this, we performed where the derivatives are calculated at a given
some fully self-consistent calculations in the NaCl fixed tip position z
s. Letx0=(r(0)1 ,r(0)2 ,…) be the
step system. In these calculations, ions in regions solution of Eq. (10). Then, since x
0=x0(zs), we
2 and 3 are allowed to relax completely with have for the force:
respect to microscopicand image forces. We found that the displacements of ions in the system due F
tip=− dU[x
0(zs),zs] dz
s
=−
A
∂U ∂x0
Bz
s∂x 0
∂z
s to image forces was less than 0.01 Anot affect our results. ˚ and would The force acting on the tip was calculated using
−
A
∂U ∂zs
Bx
0=−
A
∂U ∂zs
Bx
0, (11)
an equation similar to Eq. (12):
where we have used Eq. (10). This result can be F
tip≈ ∑ iµ1
[F(sh) iz ]x0+ ∑
iµ2 [F(el)
iz ]x0− dU
vdW dz
s
−
A
∂Uel∂z s
Bx
0, simplified further. Indeed, the partial derivative of
the shell-model, −(∂U
sh/∂zs), is equal to the sum (13)
of all z-forces acting on atoms in region 1 due to
all shell-model interactions, since only these atoms where in the second summation we sum all
z-forces acting on all atoms of region 2 due to the
are responsible for the dependence on z
electrostatic energy U
el. The calculation of the code [28,29]. We will refer to this interaction as microscopic in further discussion. The nano-tip electrostatic contribution to the forces acting on
atoms is considered in detail in Appendix C. and the NaCl cluster are each divided into two
regions, I and II. In terms of Fig. 1, region I consists of region 2 and the top two layers of the cluster (region 3), and region II consists of region 3. Results
1 and the remaining bottom two layers of the cluster (region 4). The region I ions are relaxed In order to demonstrate the relative significance
of the image force with respect to the other forces, explicitly, whilst the region II ions are kept fixed to reproduce the potential of the bulk lattice and we applied the interaction model described above
to calculate the tip–surface forces of several char- the remaining tip ions in the relaxed ions. The calculation is periodic, so that the infinite surface acteristic systems. These systems were chosen as
they represent a surface–substrate class that has is represented; however, this means large surface
unit cells must be used to avoid interactions been studied extensively in STM [3] and NC-SFM
experiments [10,11]. Specifically, each of the sys- between tip images in different cells. We made sure that the shell-model contribution to the force is tems represents a feature that is likely to be found
in experiment, and in which image forces may play completely converged with respect to the size of
the periodically translated simulation cell. a significant role in the interactions.
Electronic polarisation of the ions is imple-mented via the Dick–Overhauser shell model [30]. 3.1. Details of the calculations
Buckingham two-body potentials were used to represent the non-coulombic interactions between The systems used to calculate the forces are all
set up as shown in Fig. 1, with only the exact the ions. The parameters for these interactions are
well tested and are fully described in Ref. [31]. structure of the NaCl cluster changing between
systems. For these calculations the tip consists of To calculate the shell-model contribution to the
microscopic force between tip and surface,
a sphere of radius 100 A˚ with a 64-atom MgO
cube embedded at the apex. The cube is orientated S
iµ1[F(sm)iz ]x0 [see Eq. (13)], we first calculate the total shell-model energy of the system at a range so that it is symmetric about the z-axis with a
single oxygen ion at the lowest point of the tip. of tip–surface separations, and then differentiate it numerically to find the force as a function of The top three layers of the cube fall within the
sphere’s radius and constitute region 1, as shown separation.
The image force is calculated by taking the in Fig. 1. The exact number of ions in region 1 is
set so as to keep the nano-tip attached to the relaxed geometry from the shell-model calculation
at each tip–surface separation. Any ions within sphere neutral. The remaining ions of the cube
constitute region 2. The clusters used consist of the sphere (i.e. region 1) are not considered in the image force calculation, as it is impossible to have four layers of NaCl, with the top two layers
designated region 3 and the bottom two layers ions within the conducting sphere. Also, any ions
closer than 2.5 A˚ to the sphere did not produce region 4, as in Fig. 1. The metal plate is 2 A˚ below
the bottom of the cluster and the bias is held at any images within the sphere, as these would
produce an unrealistically large interaction. The 1.0 V in all calculations. This setup is consistent
through all systems calculated and, where appro- force on each atom in the system due to the image
interaction is then calculated, and the force on the priate, for all interactions calculated. This gives us
confidence that we can compare the relative values tip atoms is summed to find the contribution of
the image force to the tip–surface force, see Eq. of forces in the same system and between
different systems. (13). This calculation is not periodic; the NaCl
cluster is now a finite body. However, since our The interaction between ions in regions 1–4 was
calculated using a static atomistic simulation tech- NaCl periodic cell is large enough that we can
can effectively consider the NaCl sample to be a block of atoms. We found that this interaction converges to a constant value when the radius of finite cluster at all stages of the calculation. The
only difference is that the periodic boundary condi- the sphere exceeds about 30 A˚ . The force exerted on one atom due to this interaction at characteris-tions in atomistic simulacharacteris-tions do not allow the
atoms at the cluster border to relax as in a free tic tip–sample distances is several orders of magni-tude smaller than the force between macroscopic cluster. However, this effect is small and does not
affect our conclusions. The approach described tip and substrate. Also, the force decays with
distance as r−4. This effectively means that only allows us to ensure the consistency of our model
shown in Fig. 1 throughout the whole modelling the top layer of the sample contributes to the
van der Waals force, and there are not enough process.
The final contribution to the force is the van der ions in that layer for it to be significant. Therefore,
we neglected this interaction in further
Waals interaction. It includes the following
contri-butions: (i) between the macroscopic Si tip of calculations.
conical shape with the sphere of radius R at the
end [27] and semi-infinite substrate; (ii) the disper- 3.2. NaCl step sion forces between the atoms in the sample treated
atomistically; and (iii) the interaction between the The first system studied was a stepped NaCl
cluster produced by placing a 5×3×2 (in terms macroscopic part of the tip and the sample atoms.
The first contribution is calculated analytically of an eight-atom cubic unit cell ) block on top of a 5×5×2 block so that two corners are aligned. [27]. In fact, the macroscopic contribution to the
van der Waals force is the same in each of the A schematic for the calculation cell of this system
is shown in Fig. 3. This system gives us a good three systems described below, as it depends only
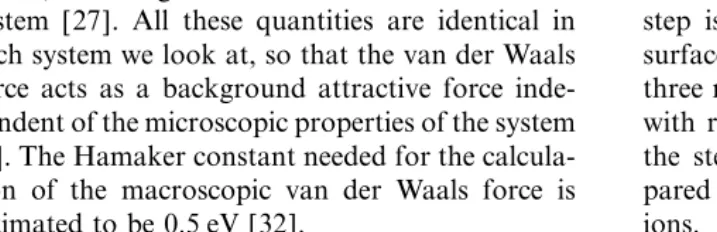
on the tip–surface separation, macroscopic sphere opportunity to study the interactions over sites of different coordination. The upper terrace of the radius, cone-angle and Hamaker constant of the
system [27]. All these quantities are identical in step is a good representation of the ideal (001)
surface of NaCl; as long as we remain at least each system we look at, so that the van der Waals
force acts as a background attractive force inde- three rows from the edge the forces are converged
with respect to row choice. However, the ions of pendent of the microscopic properties of the system
[8]. The Hamaker constant needed for the calcula- the step-edge have a coordination of four,
com-pared with a coordination of five for the terrace tion of the macroscopic van der Waals force is
estimated to be 0.5 eV [32]. ions.
To study the difference between these types of To estimate the importance of the third
contri-bution, we have calculated explicitly the dispersion site we calculated the interactions over an Na ion in the terrace and a Cl ion at the step edge, as interaction between one atom and a spherical
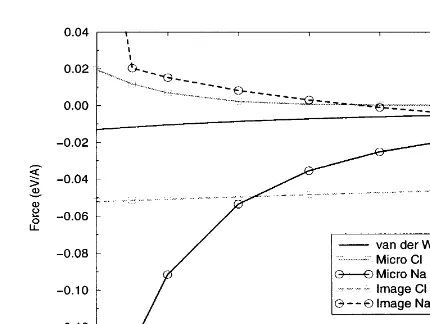
This means that for this system the image force acts in a similar way to the macroscopic van der Waals force, i.e. as an attractive background force that is blind to atomic identity and, therefore, does not contribute to the SFM image contrast.
3.3. Pairvacancy
The second system studied is formed by taking the NaCl step discussed in Section 3.2 and remov-ing an Na–Cl pair of nearest-neighbour ions from the upper terrace, as shown in Fig. 5. This effec-tively creates a dipole on the upper terrace of the step, but does not greatly affect the original geome-try of the step.
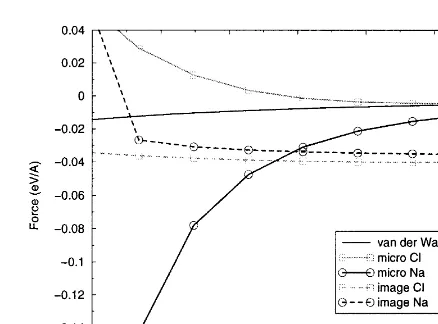
Fig. 4. Forces over NaCl step.
In this system we calculated the total force contributions over the ions at the edge of the pair vacancy: the Na ion labelled 1 in Fig. 5 and Cl shown in Fig. 3. This allows us to compare the
effects of coordination and chemical identity with ion labelled 2. The force contributions as a func-tion of tip–surface separafunc-tion are shown in Fig. 6. the forces between tip and surface.
The first point to note is that the macroscopic The macroscopic van der Waals force is obviously
identical to the previous example, and is here only van der Waals force is the same for both anion
and cation; this is an obvious effect from the way for comparison. The microscopic force is also very similar to the previous example. This is expected, in which we calculate this interaction. It is also
the least significant force at tip–surface separations as we are still looking at the interaction over the same ions and the double vacancy of oppositely less than 6 A˚ , as can be seen in Fig. 4.
The behaviour of the microscopic force is as charged ions has little significant effect on this force. The removal of the vacancy ions does change would be expected for the interaction of an oxygen
ion (which simulates the end of the tip apex, see the local coordination of the ions at the edge of
the vacancy, but this is compensated by relaxation above) with the ions in the surface. The force is
attractive over the positive Na in the terrace and of these ions away from the vacancy. This compen-sation means that the microscopic van der Waals repulsive over the negative Cl at the step edge.
The microscopic force becomes the dominant inter- and electrostatic force directly over the edge ions are similar to the force over the ions in the defect-action in the system at around 5.5 A˚ . As the tip
gets very close to the Na ion in the terrace the ion begins to displace towards the tip oxygen, greatly increasing the attractive force. When the separa-tion is closer than around 4.7 A˚ the displacement of the Na ion towards the tip exceeds 1 A˚ . This ion instability can be seen clearly both in the microscopic and image force curves for Na in Fig. 4 and has already been described in the litera-ture in the context of AFM [33].
The image force itself is the dominant inter-action at longer ranges, but it is fairly consistent over cation and anion in the NaCl terrace. The difference in image force over the Cl and Na ions
attractive and repulsive over the Na ion. The difference in magnitude of the image force over the two ions is due to the asymmetry of the nano-tip ions at the end of the conducting nano-tip. Although this result implies that the image force is somewhat sensitive to the geometry of the interacting feature, it does demonstrate that the image force would feel a defect in the surface.
3.4. Charged step
In the final system studied, we looked at a
charged step where similar ions run along each
edge of the step. Fig. 7 shows a schematic of the Fig. 6. Forces over pair vacancy in NaCl step. calculation cell used. The system is created by taking the neutral step setup from Section 3.2 and just removing ions from four rows of the upper free terrace. This is seen clearly by the onset of
Na ion instability at the same tip–surface separa- terrace. This charged row of ions is similar to the bridging oxygen rows seen in the TiO
2 (110)
tion of about 4.7 A˚ .
The image force over the edge ions demonstrates surface, a surface that has recently been studied experimentally by NC-SFM [34].
very different behaviour to the plain step system
studied in Section 3.2. The only similarity is that We calculated the contributions to the total
force over a Cl ion at one edge of the step, labelled the microscopic force becomes the dominant
inter-action at the same distance of 5.5 A˚ . The image 1 in Fig. 7, and over an Na ion at the other edge, labelled 2. The force contributions are shown force over the Cl vacancy edge ion is attractive
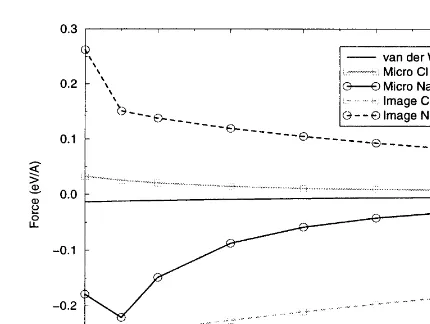
and almost twice as large (−0.05 eV/A˚ ) as the in Fig. 8.
The macroscopic van der Waals force for the force over the Cl at the plain step edge
(−0.03 eV/A˚ ). The image force clearly feels the charged step is again identical to previous examples and plotted only for comparison. The microscopic defect in the terrace and the increase in force
reflects the change in the local charge environment van der Waals and electrostatic forces over both the ions are increased compared with the previous of the Cl ion. This is even more clearly shown by
the image force over the Na ion at the vacancy two systems. Over the Na ion at the step edge the
force is −0.1 eV/A˚ at 5.5 A˚ compared with
edge. The force is much smaller than the
micro-scopic force at all separations and actually becomes −0.05 eV/A˚ at 5.5 A˚ for the Na ion in the terrace of the plain step. This doubling of the force is also repulsive at around 6.2 A˚ . This means that the
induced potential in the conducting tip reflects the seen over the Cl ion, where the force at 5.5 A˚ is 0.025 eV/A˚ over the charged step and 0.012 eV/A˚ change in local charge environment produced by
the vacancy. The net interaction over the Cl ion is over the plain step. This is a consequence of the
is very sensitive to the charge of the system between the electrodes.
4. Discussion
In this paper we considered the contributions to the force acting on a tip in a typical setup of an NC-SFM, including: (i) a macroscopic van der Waals interaction between the macroscopic tip and substrate that is always attractive and gives no image contrast; (ii) a microscopic force between the tip apex and the sample that we described using the shell model; for the first time (iii) the image interaction due to macroscopic polarisation Fig. 8. Forces over charged NaCl step.
of the metal electrodes (both tip and substrate). The latter two contributions may be either attrac-tive or repulsive depending on the distance to the change of geometry of the charged step system:
both ions have lower coordination than the ions surface and the nature of the surface site that the
tip is above. They both play a role in image in the plain step system. Lowering the coordination
increases the gradient of the electrostatic potential contrast in the NC-SFM experiment. We clearly
demonstrated in this paper the significance of the around these ions and, therefore, increases the
microscopic force between tip and surface. image interaction, which in some cases is the
dominant force. It is especially interesting to note The image force dominates the interactions over
the charged step at nearly all tip–surface separa- the ability of the image force to resolve the charged di-vacancy and charged step. This shows that the tions; only after the onset of Na ion instability at
4.7 A˚ does the microscopic attraction between the image force could be the dominant source of
contrast in NC-AFM images of charged features. tip and the step Na overcome the image force.
Over the Cl ion the image force is completely In this study we have adopted several
approxim-ations that we are now going to discuss. First, dominant, and is approximately an order of
magni-tude larger than the microscopic force. At the edge note that we have assumed a particular setup for our model, in terms of the way the bias is applied of the charged step, the row of similar ions
pro-duces a row of similar image charges of opposite to the system, as can be seen in Fig. 1. This type
of setup is commonly used [35], but other possi-sign in the conducting tip. In the other systems
this effect is effectively compensated by the bilities may exist. For example, a setup where the tip and substrate are decoupled and their potentials alternating ion species. As in the previous system,
the image force does feel the difference between are changed independently is equivalent, since only the absolute magnitude of the potential difference one side of the step and the other; this is manifested
in the opposition of the interactions at either side between the tip and the metal substrate matters. Another limitation of the present model is that, of the step. Over the Cl ion the image force is
attractive and over the Na ion the force is repul- for the calculation of the image interaction, we
studied finite clusters of a particular shape. sive. This is a reflection of the image charge
distribution produced in the tip by the charged However, it is important to understand how the
result of the calculation would depend on the size step system, an exaggerated version of the effect
seen over the vacancy. The significance of the of the cluster if we wish to make any general
conclusions about image forces in these systems. image force above the ions of the charged step is
in agreement with our preliminary results of As has been mentioned in previous sections, the
dependent on the geometry of the system being the image force could exaggerate the effects of ion displacement on imaging of conducting materials studied. Note that we cannot increase the cluster
size indefinitely, since it is limited to roughly twice or thin films with contact AFM.
The image force also depends on the charge the radius of the sphere used to model the tip.
Beyond this limit the top of the sphere affects the distribution and ionicity of the nano-tip used, as well as the charge itself. As has been discussed in interaction with the surface; this is an unphysical
result as, in reality, the tip has essentially infinite our recent paper [37], a more realistic model of an NC-SFM tip would probably consist of an height at this scale. In order to investigate the
effect of the size of the cluster, we calculated the ionic oxide layer covering a semiconducting silicon tip. The simplest model of this tip is an oxygen image force over the same terrace Na ion as in the
first system studied, but increased the size of atom or a hydroxyl group adsorbed on a silicon
cluster [37]. This model represents a nano-tip with the cluster by several hundred atoms (being still
within the limit of the maximum cluster size). This a decaying ionicity as you move away from the
apex. The reduction of the magnitude of the effectively means that the local geometry and
charge environment of the ion under the tip apex charges in the nano-tip would reduce the
magni-tude of the image charges in the conducting tip remain the same, but the total number of charges
in the system changes significantly. The calcula- and, therefore, the image force. tions show that the image force over the cluster
does increase as the number of atoms is increased,
but then converges. The increase in image force is Acknowledgements
due to the interactions of the extra charges in the
system, but the difference is an order of magnitude LNK and ASF are supported by EPSRC. We
are grateful to A. Baratoff, R. Bennewitz, E. Meyer smaller than the image force itself and so would
not affect our results significantly. and A.I. Livshits for useful discussions and to
A.L. Rohl for help in MARVIN calculations. For consistency, throughout this study we have
used a neutral nano-tip. It is known, however, that the tips used in real experiments can be highly
contaminated by external material, which may lead Appendix A
to tip charging. Therefore, it is relevant to study
the effect of a charged tip (i.e. a nano-tip with a In this appendix we show explicitly that the
function w
ind(rA,rB) of Eq. (8) is symmetric with different number of anions and cations) on the
image force. To simulate this, we added four respect to its variables. First of all, one has to be
clear about the notation. While considering the uncompensated oxygen ions to the original
nano-tip so that its net charge became −8e. We found function w
ind(rA,rB), we imply that the polarising unit charge is located at r
B and, therefore, all that the image force more than doubles over the
charged step. This system is an extreme example image charges and their positions entering Eq. (8)
will be designated by the letter B, e.g. f
k(B), of this effect, but an increase in image force can
be seen when using a charged tip in all the systems j
k(B), rjk(B), etc. Consequently, while considering the function w
ind(rB,rA) we imply that the source that have been studied here. The effects of tip
contamination could be even more significant in unit charge is at r
A and the image charges and
their positions will be marked by the letterA, e.g. the case of contact SFM. In previous studies of
contact SFM imaging [36 ], the importance of ion j
k(A),rjk(A).
Let us now write down separately Eq. (8) for displacements and ion exchange between tip and
surface has been demonstrated. Our results here w
ind(rA,rB) andwind(rB,rA) and compare them term by term. For simplicity we assume that the expan-show that displacement of ions causes a large
increase in the image force between the tip and sions are infinite. The first terms in both
expres-sions are obviously identical since |r
A−sˆrB|= surface. Ion exchange may also charge the tip,
again changing the image force. This means that |r
the first sum in both expansions are also identical Then, we notice that the denominator in the
left-hand side can be transformed as follows:
term by term, i.e. that for anyk
|r(k)A −f(r
B)|=|f(r(kA−1))−sˆf(rB)|=|f[r(kA−1)]−r(1)B | and similarly for the denominator in the
right-j
k+1(A)
|r
B−rjk+1(A)|
= jk+1(B)
|r
A−rjk+1(B)|
. (14)
hand side. In addition, the product x(r
A)x(rB) is cancelled out on both sides, so that we are left
First of all, a direct calculation shows that they with:
are identical fork=0, which can be written down in a symbolic form as
x[r(1)
A ],x[r(kA−2)]
G
x[r(k−1) A ]
|r(1)
B −f[r(kA−1)]|
H
x(x)
|y−f(x)|=
x(y)
|x−f(y)|, (15) =x[r(1)
B ],x[r(kB−2)]
G
x[r(k−1) B ]
|r(1)
A −f[r(kB−1)]|
H
. (18)
where x(r)=−R/|r−R
s|and the function f(r) has
Notice that the expression obtained is similar to been introduced in Eq. (7). It is implied in the
Eq. (16) withr
Br(1)B andrAr(1)Aand the orderk above identity that x=r
A and y=rB; however, it
reduced by one. Repeating the procedure, we obviously holds foranychoice of vectorsx andy.
reduce the order again and get Eq. (18) with Note that this result simply corresponds to the
r(1)
B r(2)B and r(1)A r(2)A . If k=2p is even, this case of a single sphere for which the potential
process is repeated until we get exactly Eq. (15)
w
ind(rA,rB) is known to be symmetric [18].
withx=r(p)
A andy=r(p)B , which is true. Ifk=2p+1
Consider now the case of any k. Let us denote
is odd, however, then we will get the same
expres-rA(n)=sˆr
jn(A) and r(n)B =sˆrjn(B) for Yn=1, 2, ….
sion |r(p+1)
B =f[r(p)A ]|−1 on both sides. Thus, Eq.
Then it follows from Eq. (7) that
(14) is provenYkso that the first terms in the first r
jn+1(A)=f[r(n)A ] and rA(n+1)=sˆf[r(nA+1)] for any
sum in Eq. (8) are identical in the two expansions. n≥1 [while r
j1(A)=f(rA) and r(0)A =rA for n=0];
Note again that Eq. (14) is valid for any two
similar formulae can be written for the charges
vectors r
A andrB. generated by the source unit charges at r
B. Using
Compare now the second term in the first sum
this notation, we have j
k(A)=(−1)k
in the expansion of w
ind(rA,rB) with the first term
x(r
A)x[r(1)A ]…x[r(k)A ] and the same forjk(B), so that
in the second sum in the expansion ofw
ind(rB,rA), Eq. (14) can be rewritten as:
see Eq. (8). They are identical as well for any k, term by term:
x(r
A)x[r(1)A ],x[r(kA−1)]
G
x[r(k) A ]
|r
B−f[r(k)A ]|
H
−jk+1(B)
|r
A−sˆrjk+1(B)|
= fk+1(A)
|r
B−rfk+1(A)|
. (19)
=x(r
B)x[r(1)B ],x[r(kB−1)]
G
x[r(k) B]
|r
A−f[r(k)B]|
H
. (16)
Indeed, by construction, the image charges j
k(A) are built due to the positive source unit charge at The expressions in the square brackets in either
r
A, whereas the image charges fk(A) are built due side of Eq. (16) can be simplified by means of the
to the source negative unit charge at r
A9=sˆrA, so identity in Eq. (15). Namely, we use x=r
A (k) and
thatf
k(A)¬−jk(A9) andrfk(A)¬rjk(A9). Therefore, y=r
B to simplify the expression in the square
Eq. (19) appears to be exactly the same as Eq. brackets in the left hand side of Eq. (16) and
(14) corresponding to one of the source charges x=r
B
(k)andy=r
A in the right-hand side, giving
at r
A9 rather than at rA. This also means that the second term in the first sum in the expansion of
x(r
A)x[r(1)A ],x[r(kA−1)]
C
x(r B)
|r(k)
A −f(rB)|
D
wind(rB,rA) is, term by term, identical to the firstterm in the second sum in the expansion of
w
ind(rA,rB). Similarly, one can prove that the
=x(r
B)x[r(1)B ],x[r(kB−1)]
C
x(r A)
|r(k)
B −f(rA)|
D
. (17)
expan-sions also coincide term by term. The proof is The calculation of the derivatives of the second part of the energy that is to do with charges {q
i} complete.
proceeds in a similar manner, although the calcula-tion is more cumbersome. We need the derivatives
with respect to z
s of the induced potential,
w
ind(rj,ri). It follows from Eq. (8) that for every
Appendix B chargeq
iwe should, therefore, consider the
deriva-tives of the charges j
k, jk∞ as well as of their
In this appendix we explain how the contribu- positionsr
jkandsˆrjk; after that, the same calcula-tion −(∂U
el/∂zs) to the total force acting on the tion should be repeated for the f-sequence. Note tip is calculated. The electrostatic energy U
el is that the actual dependence on z
s comes from
given by Eqs. (2), (6) and (8). As has been already r
s=(0, 0,zs) in Eq. (7). Let us fix some charge qi.
mentioned in Section 2, the calculation of the We first define the derivatives
derivative is not simple since the dependence of U
el on zs is not only explicit but also contains C(j
k)
a =
∂r jka
∂zs , (20)
some implicit dependencies. It is the purpose of this appendix to consider how this derivative is
calculated in some detail. where Greek indicesa,bwill be used to designate
The energy U
el consists of two parts: that due the Cartesian components of vectors. Using Eq.
to bare electrodes and that due to charges. We (7) one can get the following recurrent relations
first of all consider the first part, i.e. the derivatives for the quantities C(j
k)
a :
with respect to z
s of the charge Q(0) and the
potential w(0)(r). Using definitions of charges z
k C(j
k+1)
a =daz+ R2 R2
k
G
[haC(jak)−daz] given in Section 2.2, one has the following set of
recurrent equations for the derivatives of the charges with respect toz
s: − 2
R2 k
∑
b [h
bC(jbk)−dbz]RkaRkb
H
, (21)∂z
k+1
∂z s = 1 D k
A
∂z k ∂z s−zk D k ∂D k ∂z s
B
, where the vectorsR
k=sˆrjk−Rs,dabis Kronecker’s delta symbol and we also defined h
a as ha=1 for
a=x,y and h
z=−1. Note that this relation can
where ∂
z1/∂zs=0 and the derivatives ∂Dk/∂zs are be used starting fork=0 if we setR
0=ri−Rsand
in turn obtained from ∂D
k+1/∂zs=(2/R)+ C(j0) a =0. [D−k2(∂D
k/∂zs)], which starts from ∂D1/∂zs=2/R. Finally, the derivatives of the chargesj
kcan be The position of image charges z
k also depend on calculated using their definition in Eq. (7) and the z
s and the corresponding derivatives are easily quantities in Eq. (20) as follows:
expressed via the derivatives ∂D
k/∂zs as follows:
∂z
k/∂zs=R(∂Dk/∂zs)−1. The calculation of the derivative of z
2 and z2 with respect to zs is
∂j
k+1
∂z s =R R k
G
∂j k ∂z s−jk R2
k
∑
b [h
bC(jbk)−dbz]Rkb
H
, calculated easily owing to their explicit dependenceon it (see Section 2.2). Thus, the calculation pro- (22)
ceeds as follows. First of all, the derivatives
∂D
k/∂zs for all needed values of k≤k0 are calcu- where again this expression can be used starting fromk=0 if we set:∂j
0/∂zs=−1. First, one calcu-lated using the recurrent relations above, then the
derivatives of the charges and their positions are lates the derivativesC(jk)
a using the recurrent equa-tions in Eq. (21); then the derivatives of the also calculated. This makes it possible to calculate
the derivatives of Q(0) and w(0)(r) with respect to charges j
k are easily calculated from Eq. (22). Then this procedure is repeated for thef-sequence. z
sin a simple fashion in accordance with Eqs. (6)
calculate the contribution to the force on the tip References coming from the induced potential and the induced
charge caused by every charge q
i in the system. [1] N. Burnham, R. Colton, H. Pollock, Nanotechnology 4(1993) 64. This calculation proceeds by considering every
[2] R.E. Egdell, F.H. Jones, J. Mater. Chem. 8 (1998) 469. charge one after another and adding its
contribu-[3] W. Hebenstreit, J. Redinger, Z. Horozova, M. Schmid, R. tion to the total force. Finally, adding the contribu- Podloucky, P. Varga, Surf. Sci. 424 (1999) L321. tion to the force from the bare electrodes, we get [4] K. Fukui, H. Onishi, Y. Iwasawa, Phys. Rev. Lett. 79 the total electrostatic force,F(el)
z =−(dUel/dzs). (1997) 4202.
[5] M. Guggisberg, M. Bammerlin, R. Lu¨thi, C. Loppacher, F. Battiston, J. Lu¨, A. Baratoff, E. Meyer, H.-J. Gu¨ntherodt, Appl. Phys. A 66 (1998) S245. Appendix C
[6 ] S. Morita ( Ed.), Proceedings of the First International Workshop on Noncontact Atomic force Microscopy, In this appendix we consider the calculation of Appl. Surf. Sci. 140 (1999).
the contribution to the force acting on some charge [7] F.J. Giessibl, Science 267 (1995) 68.
[8] A.I. Livshits, A.L. Shluger, A.L. Rohl, A.S. Foster, Phys. q from the electrostatic energyU
el. Using Eq. (2), Rev. B 59 (1998) 2436.
we obtain:
[9] M. Bammerlin, R. Lu¨thi, E. Meyer, J. Lu¨, M. Guggisberg, C. Loppacher, C. Gerber, H.J. Gu¨ntherodt, Appl. Phys. F
ia=−
∂U el
∂r ia
=−q i
∂w(0)(ri)
∂r ia
A 66 (1998) S293.
[10] R. Bennewitz, M. Bammerlin, M. Guggisberg, C. Lop-pacqher, A. Baratoff, E. Meyer, H.-J. Gu¨ntherodt, Surf. Interface Anal 27 (1999) 462.
−q i12∑
j q
j
C
∂w
ind(ri,rj)
∂r ia
+∂wind(rj,ri)
∂r ia
D
,
[11] C. Loppacher, M. Bammerlin, M. Guggisberg, F. Battis-ton, R. Benewitz, S. Rast, A. Baratoff, E. Meyer, (23)
H.-J. Gu¨ntherodt, Appl. Surf. Sci. 140 (1999) 287. [12] L.N. Kantorovich, A.I. Livshits, A.M. Stoneham, J. Phys.: where Greek indexais used for Cartesian
compo-Condens. Matter (1999) submitted for publication. nents of vectors. Several terms emerge here. The
[13] M.W. Finnis, Surf. Sci. 241 (1991) 61. derivative of the potentialw(0)(r
i) defined by Eq. (5) [14] M.W. Finnis, R. Kaschner, C. Kruse, J. Furthmu¨ller, M. is straightforward, since the positions of the Scheffler, J. Phys. Condens. Matter 7 (1995) 2001. charges z
k depend only on the position zs of the [15] M. Garcı´a-Herna´ndez, P.S. Bagus, F. Illas, Surf. Sci. 409
sphere. The same is also true for the derivative (1998) 69.
[16 ] D.M. Duffy, J.H. Harding, A.M. Stoneham, Philos. Mag.
∂w
ind(ri,rj)/∂ria taken with respect to the first 67 (1993) 865. (explicit) variable of the induced potential, so that
[17] L.D. Landau, E.M. Lifshitz, L.P. Pitaevskii, Electrody-this derivative is calculated directly using Eq. (8)
namics of Continuous Media vol. 8 Pergamon, Oxford,
with respect to the first argument and then setting 1993.
r to r
i. The calculation of the other derivative, [18] J.D. Jackson, Classical Electrodynamics, Wiley, New York, 1999.
∂w
ind(rj,ri)/∂ria, is trickier and requires some subtle [19] W.R. Smythe, Static and Dynamic Electricity, McGraw-consideration similar to that of Appendix B. This
Hill, New York, 1968. leads to a set of recurrence relations for the
[20] M.J. Hagmann, Int. J. Quant. Chem.: (Symp.) 28 (1994) derivatives of image charges and their positions.
271.
This difficulty, however, can be easily overcome [21] J.G. Simmons, J. Appl. Phys. 35 (1964) 2472. by recalling that the functionw
ind(ri,rj) is symmet- [22] H.Q. Nguyen, P.H. Cutler, T.E. Feuchtwang, N. Miskov-sky, A.A. Lucas, Surf. Sci. 160 (1985) 331.
ric with respect to the permutation of its variables
[23] L.-H. Pan, T.E. Sullivan, V.J. Peridier, P.H. Cutler, N.M. (Appendix A). Finally, we have
Miskovsky, Appl. Phys. Lett. 65 (1994) 2151.
[24] H. Morawitz, I.P. Batra, R. Reinisch, G.R. Henry, Surf. F
ia=−qi
C
∂w(0)(r i)
∂r ia
+∑
j q
j
∂w
ind(ri,rj)
∂r ia
D
Sci. 180 (1987) 333.
[25] J. Bono, R.H. Good, Surf. Sci. 151 (1985) 543.
[26 ] A.A. Lucas, J.P. Vigneron, J. Bono, P.H. Cutler, T.E. Feuchtwang, R.H. Good, Z. Huang, J. Phys. (Paris)
=−q i
∂w
ind(ri)
∂r ia
. (24)
[27] C. Argento, R.H. French, J. Appl. Phys. 80 (1996) 6081. [33] A.L. Shluger, L.N. Kantorovich, A.I. Livshits, M.J. Gillan, Phys. Rev. B 56 (1997) 15 332.
[28] D. Gay, A. Rohl, J. Chem. Soc. Faraday Trans. 91
(1995) 925. [34] K. Fukui, H. Onishi, Y. Iwasawa, Phys. Rev. Lett. 79 (1997) 4202.
[29] A. Shluger, A. Rohl, D. Gay, R. Williams, J. Phys.
Con-dens. Matter 6 (1994) 1825. [35] H. Tomiye, H. Kawami, M. Izawa, M. Yosyhimura, T. Yao, Jpn. J. Appl. Phys. 34 (1995) 3376.
[30] B.G. Dick, A.W. Overhauser, Phys. Rev. 112 (1958) 603.
[31] R. Grimes, C. Catlow, A. Stoneham, J. Phys. Condens. [36 ] A.I. Livshits, A.L. Shluger, Faraday Discuss. 106 (1997) 425.
Matter 1 (1989) 7367.
[32] R.H. French, R.M. Cannon, L.K. DeNoyer, Y.-M. [37] P. Susko, A. Foster, L. Kantorovich, A. Shluger, Appl. Surf. Sci. 144–145 (1999) 608.