Characterization of the Fatigue Threshold
for an Exercise Routine
Braulio Cruz Jiménez1, Ricardo Péon Escalante1, Luis Ricalde Castellanos1, Jannette Contreras Rivero1,
Aris Zapata Pasos2
Associate Professor, Universidad Autónoma de Yucatán, Facultad de Ingeniería, Mérida, Yucatán, México1
Academic Technician, Universidad Autónoma de Yucatán, Facultad de Ingeniería, Mérida, Yucatán, México2
ABSTRACT: Electromyography (EMG) is the study of electrical impulses produced during contraction and relaxation of muscles. An important variation of this technique is surface electromyography (SEMG), which studies muscle activity produced by dynamic actions allowing, for example, to define the muscular participation in a certain gesture or observe the activation of the muscles of a segment in response to movement of other segments. Muscle fatigue can be understood as the reduction of a muscle's ability to maintain a certain level of force during a contraction or the inability to reach the initial level of force, when someone is performing prolonged actions. This process generates a series of electrophysiological changes that result in observable modifications in electromyographic traces. In this article, the implementation of a system for the acquisition and processing of SEMG signals produced during an exercise routine is carried out in order to determine and analyze the fatigue threshold using the spectrogram technique.
KEYWORDS: Muscle fatigue, Fast Fourier Transform, Electromyography, Spectrogram, Electrical signals.
I.INTRODUCTION
Currently, disability is considered a public health problem worldwide. In Mexico, according to the estimates of the National Institute of Statistics and Geography (SEDESOL [1]), more than seven million individuals have some type of disability, which the motor being the most frequent with a percentage of 37.32%. One of the causes of motor disability is muscular dystrophy. This term means progressive muscle degeneration, with weakness and loss of muscle tissue volume. Myotonic muscular dystrophy (MMD) is a form of muscular dystrophy that affects the muscles and many other organs of the body.
In general, weakness of voluntary muscles is the most obvious symptom among people with MMD that appears in adulthood. Often, people with MMD notice that they cannot wield objects with force and that they have trouble using the muscles of the wrist or hand. At the same time, the muscles that cause the feet to rise when walking are weakened, so that the foot collapses, resulting in trips and falls. There is no cure for this disease, but the treatment is aimed at controlling symptoms through physiotherapy and drug treatment.
The role that exercise plays in dystrophy is not yet clear. It has been shown that exercise, in the early stages of the disease, may be beneficial, but it is not yet known how long that benefit lasts or if it truly leads to functional improvement. Similarly, there is no evidence that the muscle can be damaged by exercise, so it is advised that you exercise as much as possible without reaching fatigue. In contrast, inactivity has been shown to cause loss of muscle tone, even in patients without MMD. So, it is essential that someone with weak muscles, avoid staying in bed and if this is not possible, you are advised to try to exercise in bed.
in the monitoring in rehabilitation processes. Electromyography (EMG) is a technique that allows you to record electrical impulses due to voluntary muscle movements. Currently this technique has been used successfully in many applications that include since its recreational use, or as a support in clinical practice.
To cite a few examples, Burke RE [3] presents the development of a system for acquiring and processing surface myoelectric signals, using surface electrodes has a stage of amplification and filtering by hardware; This system is intended to be used for the control of robotic arms.
Correa-Figueroa. et al. [5] present an electromyographic signal measurement system with a wireless interface to record human skeletal muscle activities. The results are transmitted by Bluetooth to display in a portable application.
Merletti et al. [12] analyse the progression of muscle fatigue in the biceps brachii. SEMG signals from fifty healthy volunteers are recorded during dynamic contractions under a well-defined protocol. The acquired signals are pre-processed and segmented; features, such as activity, mobility, complexity, sample entropy and spectral entropy are extracted. The results show that the characteristics extracted have significant variations in differentiation in the presence of fatigue.Considering Merletti et al. [12] muscle fatigue can be understood as reducing the ability of a muscle to maintain a certain level of strength in a contraction or the inability to reach an initial level of strength.
According to Feldner et al. [7] SEMG systems are not routinely used by doctors in hospitalized or outpatient settings for the evaluation or treatment of muscular activity, since, although patients and doctors recognize their potential, it is necessary that The sensors and interfaces are accurate, intuitive, discrete and generate feedback that is meaningful and accessible to all stakeholders.
The contribution of this work is to determine if the use of the instantaneous frequency estimation to characterize the fatigue threshold in isometric exercises allows obtaining a meaningful and accessible feedback so that it can serve to facilitate the insertion of surface electromyography in the exercises of rehabilitation.
II.REALATEDWORK
Unlike some other forms of muscular dystrophy, MMD often does not become a problem until adulthood, and usually allows people to walk and be quite independent during their lives. MMD has many degrees of severity, even within the same family. Not all people have the same symptoms and not all people have them to the same degree. The parts of the limbs that are affected may include the forearms, hands, lower legs and feet. Over time, these muscles become smaller, so the lower legs and forearms may appear thinner than the thighs and upper arms. The cause of this condition is an inherited genetic mutation; The symptoms depend on the type of dystrophy that occurs, although they generally include:
Difficulty using one or more muscles. Trouble walking.
Frequent falls. Loss of muscle size. Eyelid drooping.
energy so that it can be distributed correctly when we exercise; In Type IIafibers, the main benefit of this type of fibers is that they can contract at a rapid speed and in turn have a resistance to fatigue. Type IIb fibers are used only when very fast and intense exertion is required, such as weightlifting, throws, or maximum jumps and usually their resistance is low.
The proportion of these fibers depends on the specific function of each muscle. Intracellular action potentials are generated in the innervation zone upon receiving a neuronal impulse and propagate to both ends of the fiber with a conduction velocity that ranges between 2 and 8 m/s (Burke RE [3]). The sum of action potentials corresponding to the muscle fibers activated by a single motor unit is called the action potential of the motor unit and constitutes the fundamental unit of the EMG signal. The duration of an action potential of the motor unit is inversely proportional to the conduction velocity of the muscle fiber potentials. To maintain muscle contraction, the motor units must be activated repeatedly, generating a sequence of action potentials of the motor unit over time. The SEMG signal is the result of the sum of all the sequences of action potentials corresponding to the active motor units, as they propagate by the different means (bones, dermis, etc.) from their point of generation in the muscle to the skin surface.
The activation of the muscles of the body is controlled by the central nervous system and by the peripheral nervous system through the recruitment of motor units (and their frequency of activation), which are junctions of the alpha motor neuron with the muscle fibers that are excited for the same. As already mentioned, there are motor units of type I (slow oxidative and highly resistant to fatigue) and type II (fast contraction, which in turn are subdivided into moderately resistant to fatigue and poorly resistant to fatigue). During a common contraction, type I fibers are activated first and as the movements become faster, the motor units correspond mostly to type II.
Muscle activation can be seen as a generation of impulses that manifest the control strategy of the peripheral nervous system and the central nervous system, which activate the different motor units, which transform each impulse into a potential of motor unit action. The sum of these potentials spreads until they reach the surface of the skin, where they can be registered with sensors such as electrodes.
The EMG or SEMG signals can show different aspects of fatigue both in the time domain and in the frequency domain, such as its peak-to-peak amplitude and its frequency spectrum. The amplitude of the signals depends on the number of active motor units, their depth and the number of fibers that compose them. The frequency spectrum of EMG signals is between 10 and 400 Hz, is affected by the waveform of the motor unit action potentials.
In the time domain, the most important values to evaluate the signal will be the frequency and amplitude from peak to peak, and the conduction velocity of muscle fibers. For its analysis, the first thing that must be done is to determine where the muscular activity in the wave begins, subsequently it is required to rectify the wave and with this we can know what the average signal was, the analysis of the average voltage through integration, analyse the maximum peaks of the signal and the maximum inflection points.
For the analysis in the frequency domain we can apply the mean and the median of its frequency spectrum, perform a fast Fourier transform, use the spectrogram or any other technique that allows us to obtain a graph of power vs. frequency. In this state the relevant parameters to evaluate are the frequency peak, the power peak and the accumulated power. This analysis is important because it allows us to observe that the low frequencies increase when the subject is subjected to fatigue. During fatigue initially the amplitude of the SEMG increases, because, as a fatigue compensation mechanism, the muscles try to maintain the same force by recruiting additional motor units; when this is not possible, the force begins to decrease, evidencing a reduction in the amplitude of the signal. During fatigue contractions, there is a reduction in the speed of the signal and therefore of the characteristic frequencies of the signal caused by the accumulation of lactic acid. (De las Heras [6]).
𝑺𝑻𝑭𝑻𝒉𝒙 𝒕, 𝒇 𝒙 𝒖 𝒉∗ 𝒖 𝒕 𝒆 𝒋𝟐𝝅𝒇𝒖𝒅𝒖 (1)
However, the STFT does not provide information on the evolution over time of the frequency that is generated. For this purpose it is convenient to use the spectrogram that represents the distribution of the energy of the signal in the time-frequency plane. The spectrogram is defined as:
𝑺𝑷𝒉𝒙 𝒕, 𝒇 |𝑺𝑻𝑭𝑻𝒉𝒙 𝒕, 𝒇 |𝟐 (2)
Although it has proven to be quite useful, the spectrogram has certain limitations, since long time windows provide a good resolution in frequency, but bad in time and, on the other hand, short time windows provide good resolution in frequency, but bad in time. A very important characteristic for signals whose spectral components vary over time is the instantaneous frequency. The instantaneous frequency of a non-stationary signal is a variable parameter in time that is related to the average of the frequencies present in the signal as it evolves, it also provides the location of the spectral peak of the signal as it changes over time. It could be defined as the first phase of the derivative of a signal and is given by:
𝒇𝒊𝒏𝒔𝒕 𝒕
𝑷 𝒕,𝒇 𝒅𝒇 𝟎
𝑷 𝒕,𝒇 𝒅𝒇
𝟎 (3)
III.METHODOLOGY
To determine how demanding an exercise routine is, the fatigue threshold analysis can be performed. This threshold will depend on the internal factors of each subject, for example: their age, level of physical activity, percentage of muscle mass, degree of progress of their disease, tolerance to pain, among others.
For the purposes of this work it was decided to use healthy people in the test this in order to determine what would be the desired time of performing the exercise and power developed before the fatigue that would be expected when the patients had already been rehabilitated, in other words , to which it would be normal to demand them, if they had no physical impediment. In later works it would be useful to compare this measure with the average of the target population group of our work.
The routine used was to perform a total of 35 flexes of the biceps brachii forearm muscle holding a 2kg weight, these were divided as 5 repetitions of 7 flexes each. These push-ups should be done slowly as isometric movements trying to generate repeatable movements. In addition, the exercise was allowed to stop if the person mentioned that he was already tired and the time in which the test subject reported fatigue was recorded.The recording of muscle activity was performed using a system for the acquisition of SEMG signals that has the general scheme of Fig. 1, it is appreciated that, for convenience, the system can be divided into three stages:
Fig. 1. Electromyographic signal acquisition system
For the analog stage (in which the signal is acquired), an electromyography sensor, the MyoWare Muscle Sensor AT-04-001, from the Advancer Technologies company was used as observed in Fig. 2. This consists of a phenolic plate to which three electrodes can be placed. This sensor was designed for use with microcontrollers, since it is powered by voltages ranging from +3.1 V to + 5V, with a current between 9 mA to 14 mA and measures around 5 cm long by 2 cm wide. In addition, it provides two types of output, one raw and one rectified and integrated, known as the envelope.
Fig. 2. MyoWare Muscle Sensor AT-04-001
As the objective of this work is to treat the signal for an analysis using the instantaneous frequency estimate and the frequency spectrum was chosen to use the raw signal. This signal is centered at half of the supply voltage, so this determines the range to be used in the analog-to-digital converter (ADC). As shown in Fig. 2, the sensor contains two electrode pins mounted on the phenolic plate, one for the middle of the muscle and one for the end of the muscle, the third electrode serves as a reference and is placed by means of a cable.
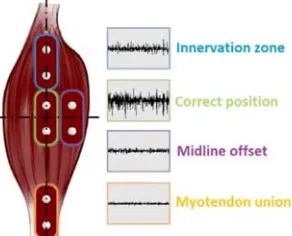
The position and orientation of the electrodes plays a decisive role in terms of the intensity and quality of the signals that are produced with the muscle sensor. The electrodes should be placed in the middle of the muscular body between an innervation zone and a myotendon junction. In addition, the electrodes must be aligned with the orientation of the muscle fibers. In Fig. 3, it is observed how the sensor signal is affected according to the placement of the sensor, the intensity and quality of the sensor signal can be reduced due to a reduction in the number of motor units and the interference of signals from other muscles.
For the ADC, the CY8C5888LTI-LP097 microcontroller integrated in the CY8CKIT-059 PSoC 5LP prototype development kit from the Cypress company was used. This kit has a 32-bit CPU microprocessor ARM Cortex-M3, a versatile addressing system for inputs and outputs. It also includes the programmer on the same card (which can be detached) and its design allows you to easily place it on a Protoboard. Its supply voltage ranges from 3.3 V to 5.5 V and thanks to its design and specifications it can be powered from the USB port of a computer. The microcontroller is about 11 cm long and 2.5 cm wide. In this ADC a successive approximation with 12 bits of resolution at a sampling frequency of 100,000 samples per second was programmed. In addition, the flexibility of the microcontroller was used to connect and configure a Bluetooth SPP HC-05 module through a UART. The HC-05 module is easily configurable and can function as a master and slave, it is powered from 1.8 V to 3.6 V and measures around 2.7 cm long by 1.1 cm wide. The Matlab software was used for the digital stage, which allows the signal to be plotted and processed both in the time domain and in the frequency domain.
IV.RESULTSANDDISCUSSIONS
The tests were performed on 10 different subjects, for the purposes of this work only two of them will be presented, belonging to two different subjects, to which the electrodes were placed as shown in Fig. 4.
Fig. 4. Sensor placed in the biceps brachii muscle
As can be seen in Fig.4, the MyoWare plate acts by measuring the filtered and rectified electrical activity of a muscle; the output varies depending on the amount of activity in the selected muscle; to place it on the skin it is necessary three electrodes of pads that are connected to the sensor by means of clasps which makes it easy to put on and take off. Two of the electrodes are placed directly to the sensor plate while the third is placed at the end of a cable extension that it brings. Once it has been placed, we will receive the signals as analog pulses that we can interpret with any microcontroller.
Fig. 5. Test subject performing the exercise routine
shape of the wave, the resulting action potential. In Fig. 5 the test subject performing an exercise routine in order to record the signal generated by muscle’s impulses. The pure electromyographic signal without dc components is shown in Fig. 6, the subtraction of the dc component was performed by subtracting the average of the signal in all data.
a) b) Fig 6. Electromyographic signal without dc components (a) subject 1 (b) subject 2
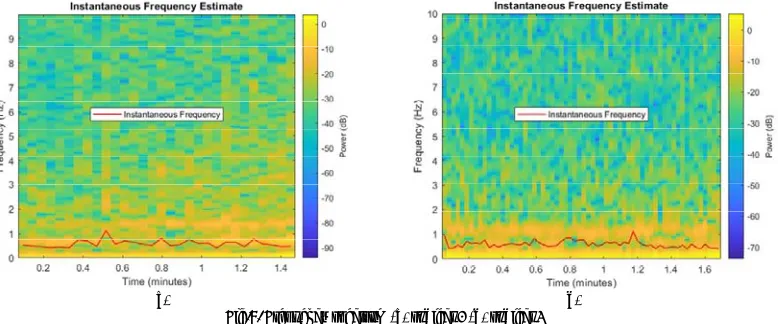
As we seen in Fig. 6a) y 6b), the amplitude range of EMG signal is 0-10 mV (+5 to -5) prior to amplification. EMG signals acquire noise while traveling through different tissue. It is important to understand the characteristics of the electrical noise. In the Fig. 7 show the spectrogram of the previously obtained signals, in addition to this signal the frequency estimation defined by (3) was applied, originating the red line shown on the graphs.
a) b) Fig.7. Frequency spectrum (a) subject 1 (b) subject 2
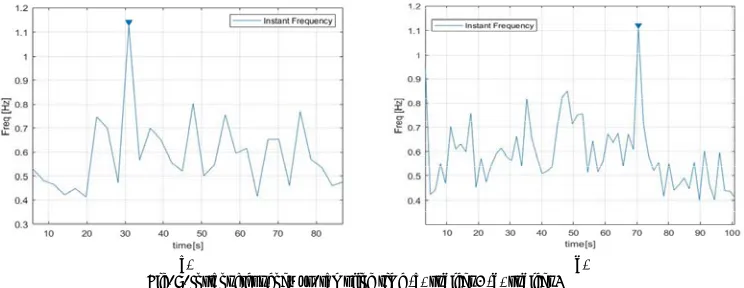
a) b) Fig. 8. Instant frequency vs. sampling time (a) subject 1 (b) subject 2
As already mentioned, when fatigue occurs, the muscles try to reach the same strength by recruiting other motor units, which increases the power generated in the muscle. When this is no longer possible, the frequency is reduced by reducing the speed of the signal. To better observe the analysis, the instantaneous frequency line was plotted separately in Fig. 8; from the Fig. 8a) y 8b), the muscle of a person can be characterized, since the time in which he begins to get fatigue is obtained, these results allow to study the muscular activity in the sports field and of daily life, being applicable to the biomechanical analysis of a gesture, in studies of muscular fatigue and in areas such as physiotherapy and rehabilitation medicine.
VI.CONCLUSION
In this paper, we presented a way to obtain and graph the electromyographic signals of the biceps brachii muscle by performing simple push-ups with a weight of 2 kg, using the MyoWare Muscle Sensor AT-04-001 device. Using the estimation of the instantaneous frequency, a way was found in which both the frequency and the moment at which fatigue occurs are clearly shown in Fig. 8.
Therefore, it is determined that the method chosen to evaluate fatigue (instantaneous frequency) allows identifying the occurrence of this in most of the samples obtained, however, since the time window to be measured is very large, resolution is lost in frequency domain. In addition, it was shown that the sensor is recommended for a first approach, thanks to its portability, ease of use and interoperability.
For the implementation in the real rehabilitation environment, it is advisable to develop a garment that incorporated the sensor in a way that is practical and comfortable for both the specialist and the patient. In addition, it is advisable to develop an interface that translates the information in the graph into a message that indicates when fatigue has been achieved by providing concise and timely feedback.
From the sensor used, it can be noted that the shape of the device allows it to be easily placed on the arm, however, the reference electrode is too close to the other electrodes, which increases the noise in the signal. To solve the interference, it is suggested to use a longer cable for connection with this electrode. On the other hand, the shape of the device makes it difficult to measure another muscle group.
REFERENCES
[1] Boashash, B. Estimating and interpreting the instantaneous frequency of a signal — Part I. Fundamentals. Proceedings of the IEEE, 80(4), pp. 520-538, 1992.
[2] Boashash, B. Estimating and interpreting the instantaneous frequency of a signal — Part 2: Algorithms and applications. Proceedings of the IEEE, 80(4), pp. 540-568, 1992.
[3] Burke RE.Motor units: anatomy, physiology, and functional organization. Handbook of Physiology: The Nervous System. USA: Brooks, V. B.
American Physiological Society, Bethesda, MD, 1981.
[5] Correa-Figueroa, J. L., Morales-Sánchez, E., Huerta-Ruelas, J. A., González-Barbosa, J. J., y Cárdenas-Pérez, C. R. SEMG signalacquisitionsystemformuscle fatigue detection. Revista Mexicana De Ingeniería Biomédica, 37(1), pp. 17-27, 2016.
[6] De las Heras Aparicio, J. C.Implementación de métodos para medir la fatiga muscular en cirujanos a través de electromiografía. Tesis de Ingeniería en Tecnologías Industriales, Escuela Técnica Superior de Ingenieros Industriales y de Telecomunicación. Universidad de Cantabria. Santander, España, 2016.
[7] Feldner, H. A., Howell, D., Kelly, V. E., McCoy, S. W., & Steele, K. M. “Look, Your Muscles Are Firing!”: A Qualitative Study of Clinician Perspectives on the Use of Surface Electromyography in Neurorehabilitation. Archives of physical medicine and rehabilitation, 100(4), pp. 663-675, 2019.
[8] Karthick, P.A., Makaram, N. and Ramakrishnan, S. Analysis of Progression of Fatigue Conditions in Biceps Brachii Muscles Using Surface
Electromyography Signals and Complexity Based Features, 2014.
[9] Kilby, J., & Hosseini, H. G. Wavelet analysis of surface electromyography signals. In The 26th Annual International Conference of the IEEE Engineering in Medicine and Biology Society, Vol. 1, pp. 384-387, 2004.
[10] Mañanas, M. A., Rojas, M., Mandrile, F. and Chaler, J. Evaluation of muscle activity and fatigue in extensor forearm muscles during isometric contractions. Proceedings of the 2005 IEEE Engineering in Medicine and Biology 27th Annual Conference, pp. 1-4, 2005.
[11] Massó N., Rey F., Romero D., Gual G., Costa L.y Germán A. Surface electromyography applications in the sport. Apunts Med Esport, 45(165), pp. 121-130, 2010.
[12] Merletti, R. and Parker, P. Electromyography: Physiology, Engineering and Non-Invasive Applications, IEEE Press and John Wiley Publishers, 2001.
[13] SEDESOL. Diagnóstico sobre la situación de las personas con discapacidad en México. Recuperado el 27 de junio de 2019 desde https://www.gob.mx/cms/uploads/attachment/file/126572/Diagn_stico_sobre_la_Situaci_n_de_las_Personas_Con_Discapacidad._Mayo_2016 .pdf