EFFECTS OF RAINFALL VARIABILITY AND INTEGRATED SOIL FERTILITY MANAGEMENT ON MAIZE PRODUCTIVITY IN EMBU
COUNTY, KENYA
Kisaka Masika Oscar (BSc.) N50/ 25640/2011
A Thesis Submitted in Partial Fulfillment of the Requirements for the
Award of the Degree of Master of Environmental Studies (Agroforestry
and Rural Development) in the School of Environmental Studies of
Kenyatta University.
DECLARATION
This research thesis is my original work and has not been presented for a degree award in any other university or for any other award
Signature……… Date………
Kisaka Masika Oscar (N50/25640/2011) Department of Environmental Science
Supervisors
We confirm that the work reported in this thesis was carried out by the candidate and has been approved for submission with our authority as university supervisors
Signature ……… Date………
Dr. Monicah Mucheru-Muna
Department of Environmental Science
Signature……… Date………
Dr. Felix K Ngetich
Department of Agricultural Resource Management
DEDICATION
To Mum Colletah, Dad Kisaka, siblings Sylvia, Sharon and Mitchell and my dear Charity; I am grateful for your unending support that has made this degree a reality.
COPYRIGHT
All rights reserved. No part of this thesis may be used or reproduced in any manner whatsoever or translated to any other language or otherwise, without prior written permission of the author and the university. Except in the case of brief quotations embodied in critical articles or reviews for academic purposes only.
© Copyright by Oscar Kisaka Masika. 2013.
ACKNOWLEDGEMENT
My special thanks are extended to the Regional Universities Forum for Capacity Building in Agriculture (RUFORUM), for funding my studies and research. I am very grateful to my supervisors Dr. Monica Mucheru-Muna and Dr. Felix K. Ngetich for their unfailing academic and professional guidance throughout my proposal development, implementation and the whole process of my thesis development and MSc. program. I am humbly indebted to the entire scientific team of; Prof. Daniel Mugendi, Dr. Jayne Mugwe, Dr. Felix Ngetich, Mr. Franklin Mairura and the Principal Investigator (PI) Dr. Monicah Mucheru-Muna from Kenyatta University who worked tirelessly to secure funds from RUFORUM to fund my study. It was a pleasure and a privilege working under your guidance and leadership. Have my gratitude and appreciation. I extend my special gratitude to Serah Muchai for her academic support and prayers. My special thanks to Esther Mugi, my project colleague, your academic support and guidance was worthwhile. To my colleagues, Irene Okeyo, Joseph Macharia, Jackson Sianje, Milka Kiboi, and David Njue, it was indeed a pleasure working together and I am highly grateful to your academic inputs and advice. I thank all the field technicians; especially Silas Kiragu who assisted me during my data collection period and for consistent response whenever I called upon him, God bless you. To my departmental lecturers and students, I am always grateful. I am greatly indebted to my parents, my sisters and my brothers, for their prayers, encouragement and financial support throughout my studies. May the Almighty God abundantly bless you.
TABLE OF CONTENT
DECLARATION... ii
DEDICATION... iii
COPYRIGHT ... iv
ACKNOWLEDGEMENT ...v
TABLE OF CONTENT ... vi
LIST OF TABLES ...x
LIST OF FIGURES ... xii
ABBREVIATIONS AND ACRONYMS ... xvi
ABSTRACT ... xix
CHAPTER ONE ...1
1.0 INTRODUCTION...1
1.1 Background information ... 1
1.2 Statement of the Study Problem ... 3
1.3 Research Questions ... 4
1.4 Research Objectives ... 5
1.5 Research Hypotheses... 5
1.6 Significance and Anticipated Output of the Study ... 6
1.7 Definition of Terms ... 7
1.8 The conceptual Framework ... 8
CHAPTER TWO ...10
2.0 LITERATURE REVIEW ...10
2.1 Assessment of Rainfall Variability ... 10
2.2 Rainfall Distribution and Agriculture ... 12
2.3 Soil Fertility Management, Soil Water and Crops production ... 13
2.4 Effects of Soil Fertility Management and Soil Water Conservation on WUE... 15
2.5.1 The APSIM Model ... 21
2.6 Summary of Literature and Study Gaps ... 21
3.0MATERIALS AND METHODS ...23
3.1 The study area ... 23
3.2 Experimental and Research Design... 24
3.2.1 Seasonal Rainfall Variability ... 24
3.2.2 Rainfall Variability Effects on Maize Productivity ... 25
3.2.3 Interactive Effects of Selected ISFM technologies on Maize Production; Modeling ... 26
3.3 Variables collected ... 29
3.4 Data Analyses ... 30
3.4.1Inter and Intra Seasonal Rainfall Variability ... 30
3.4.2 Effects of Rainfall Variability on Maize Productivity... 33
3.4.3 Soil Fertility and Water Management and effects on maize productivity ... 34
CHAPTER FOUR ...46
4.0 RESULTS AND DISCUSSION ...46
4.1 Inter/Intra Seasonal Rainfall Variability and Drought Probability ... 46
4.1.1 Homogeneity Testing and Frequency Analyses ... 46
4.1.2 Seasonal Rainfall Frequency Analyses, Probability of Exceedance and Return Periods ... 49
4.1.3 Trend analyses of rainfall events ... 51
4.1.4 Analyses of Seasonal Rainfall Variability and Anomalies ... 55
4.1.5 Variations in Seasonal Rainfall Amounts and Number of Rainy Days ... 58
4.1.6 Monthly Variations in Seasonal Rainfall Amounts and Number of Rainy Days . ... 60
4.1.7 Probability and frequency of a Dry spells and implications on crop productivity
... 63
4.2: Rainfall Variability and Maize Production ... 68
4.2.1 Maize Phenology: Rainfall and the Duration of the Maize Growing Season .. 68
4.2.2: Effects of Rainfall Variability on Maize’s Vegetative and Reproductive development... 73
4.2.3: Relationship between Rainfall Variability and Variations in Maize Phenological Development ... 77
4.2.4 Rainfall Influence on Maize Yield, under Tillage Options without Sub-Soiling . ... 80
4.2.5 Rainfall Influence on Maize Yield, under Tillage Options with Sub-Soiling .. 82
4.2.6 Maize Grain, Stover and Biomass Yield Response to Rainfall Variability ... 88
4.3: Soil Fertility and Water Management, Maize productivity Experiment and Modeling ... 92
4.3.1: Rainfall, Temperature and Solar Radiation ... 92
4.3.2 APSIM Model Maize Growth and Yield Evaluation ... 93
4.3.3 Sensitivity Analyses ... 109
4.3.4: Long term Fertility Management Options and its Effects on Maize production . ... 114
4.3.5: Organic Matter type, Speed of Decomposition and Movement of N within Organic Matter (OM) pools after Fertilization ... 127
4.3.6. Soil Water Conservation: Extractable Soil Water (esw), Layered Soil-Moisture to volume soil particles (mm3/mm3), and Surface Evaporation (es) ... 131
4.3.7 Grain Yield Prospects under Combined Mineral and Manure with Mulch .... 137
CHAPTER FIVE ...139
5.0 CONCLUSION AND RECOMMENDATIONS ...139
5.1 Conclusion ... 139
5.2: Recommendations ... 142
REFERENCES ...145
APENDICES ...162
Appendix One: The Experimental Layout ... 162
Experiment One ... 162
Experiment Two ... 163
Appendix two: APSIM maize-crop Modules ... 164
LIST OF TABLES
Table 3.1: Selected agro-climatic characteristics of the meteorological stations (Embu and Machang’a) used in the Study ... 25 Table 3.2: Fertility amendments and their N and P quantities incorporated into the soil in Experiment (II) for the period between SR2009 to LR2012 cropping seasons in Machang’a ... 27 Table 3.3: Average nutrient composition (%) of organic materials applied in the soil
during the experimental period in Machang’a, Kenya ... 28 Table 3.4: Mucuna pruriens incorporated during the experimental period in Machang’a (SR2009 to LR2012) ... 29 Table 3.5: Input Parameters and Variables, required for APSIM-Maize standard
simulation model ... 35 Table 3.6: Soil Water physical model input Parameters for Machang’a Research Site;
Embu County (Source: Experiment 1 and 2) ... 38 Table 3.7: Soil chemical model input parameters for Machang’a research station; Embu County (Source: Experiment 1 and 2) ... 38 Table 3.8: Soil Chemical model input Parameters for Machang’a Research Site; Embu
County (Source: Experiment 1 and 2) ... 39 Table 3.9: Summary of common standard crop simulation parameters for APSIM model and their description ... 43 Table 4.1: Mean, Standard Deviation and R2 values for Embu and Machang’a rainfall
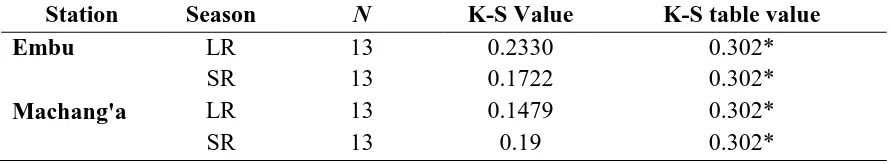
dailies for the period between 2001 and 2013……… ………...…….47 Table 4.2: Homogeneity test for Embu and Machang’a rainfall dailies for the period
between 2000 and 2013………...48
Table 4.3: Probability of rainfall exceedance and return-periods for the LRs and SRs
at Machang’a and Embu………...50
Table 4.4: Variability analyses: coefficient of variations in seasonal rainfall amounts and number of rainy days for Machang’a and Embu for the period between
2000 and 2013………58
Table 4.5: Variability in seasonal months: coefficient of variation in rainfall Amounts and rainy days for Machang’a and Embu for the period between 2000 and
2013…...61 Table 4.6: Summary of DAS to each maize phenological stage during the growing
seasons (SR2009 to LR2012) based on experiment (I) in Machang’a………..…………69 Table 4.7: Summary of cumulative rainfall (CR) received during the growing seasons
(SR2009 and LR2012) seasons in Machang’a
……….………..70 Table 4.8: Rainfall Variability and its effects on maize phenological stages between
SR2009 and LR2012 in Machang’a, Mbeere South Sub-county……….78 Table 4.9: Correlation Coefficient between rainfall amounts and different maize
phenological stages for the seasons between SR2009 and LR2012 in Machang’a Mbeere South Sub-county………..………..79 Table 4.10: Effects of rainfall (mm) on maize grain yield (Mg ha-1) under surface
management technologies without sub-soiling for the period between
SR2009 and LR2012 in Machang’a………..81
Table 4.11: Effects of rainfall (mm) on maize grain (Mg ha-1) under surface management technologies with sub-soiling for the period between SR2009 and LR2012 growing seasons in Machang’a ………83 Table 4.12: Effects of rainfall (mm) on maize grain, stover and biomass yield (Mg ha
-1
): coefficient of correlation (rho), coefficient variation (CV) and standard deviation (SD) values for the period between SR2009 and LR2012 in Machang’a……….90 Table 4.13: Root Mean Square Error (RMSE), linear correlation coefficient (R2) and
modeling efficiency (EF) values of total above-ground biomass and grain yield as affected by combined application of manure, crop residue incorporations, and mineral fertilizers during growing seasons from SR2009 to R2012………...….101
LIST OF FIGURES
Figure 1.1: Conceptual framework showing the interrelationship between the different variables studied………..8 Figure 3.1: Map showing the study area, the locations of the point-gauged rainfall
stations (Embu and Machang’a) studied and the experimental site (Machang’a) where the field trials were installed...23
Figure 4.1: Rescaled cumulative deviations for LR (MAM) and SR (OND) seasonal rainfall for the period between 2000 and 2013: a (Machang’a LRs), b (Machang’a SRs) c, (Embu LRs) and d, Embu SRs ... 47 Figure 4.2: Trend analyses based on cumulative departure index (CDI) for Machang’a
rainfall station. (Fluctuations around, above and below the CDI zero mark corresponds to the deviations from the average rainfall for the period between 2001 and 2013) ... 52 Figure 4.3: Trend analyses based on cumulative departure index (CDI) for Embu
rainfall station (Fluctuations around, above and below the CDI zero mark corresponds to the deviations from the average rainfall for the period between 2001 and 2013) ... 53 Figure 4.4: Decadal Rainfall Anomaly Index for both LR_MAM and SR_OND in
Machang’a; RAI=Rainfall Anomaly Index ... 55 Figure 4.5: Decadal rainfall anomaly index for both LRs and SRs in Embu site for the period between 2000 and 2013 ... 56 Figure 4.6: Probability of a dry-spell of length ≥n days, for n=3, 5, 7, 15, 21, in each seasonal-cropping month, calculated using the raw rainfall data from 2000 to 2013 for stations in Machang’a and Embu ... 64 Figure 4.7: Probability of dry-spells exceeding the n (3, 5, 7, 10, 15 and 21) days for
each seasonal month calculated using the raw rainfall data from 2000 to 2013 for stations in Machang’a and Embu ... 65 Figure 4.8: Anomalies in DAS in relation to rainfall variability during the maize
vegetative stage based on experiment (I) in Machang’a for the period between SR2009 and LR2012 ... 74
Figure 4.9: Anomalies in DAS in relation to rainfall variability during the maize productive phase stage in Machang’a for the period between SR2009 and LR2012 ... 75 Figure 4.10: Anomalies in maize grain yield in response to surface management
technologies and rainfall variability with (A) and without (B) sub-soiling (SB) in Machang’a ... 85 Figure 4.11: Anomalies in maize grain, stover and total-above-ground biomass yield in
response to anomalies of rainfall during the cropping seasons between SR2009 and LR2012 in Machang’a ... 89 Figure 4.12: Daily rainfall, solar radiation, minimum (mint) and maximum (maxt)
temperatures of Machang’a (Embu County) during Experiment (I) for the period between SR2009 to LR2012 ... 92 Figure 4.13: Simulated nitrogen deficit factor (nfact_photo) for selected treatments in
experiment (II) combining application of manure, crop residue incorporation and mineral fertilizer between SR2009 and LR2012 growing seasons at Machang’a, in Mbeere South sub-county ... 94 Figure 4.14: Cumulative rainfall and simulated soil water deficit factor for
photosynthesis (swdef_photo) for treatments in experiment II combining application of manure, crop residue incorporation and mineral fertilizer between SR2010 and LR2012 selected growing seasons in Machang’a ... 95 Figure 4.15: Simulated seasonal maize LAI under all treatments combining manure, crop residue incorporations and mineral fertilizers (in A), and under selected fertility management rates, in control with 0N (B left), and in Manure (Man60N) and Inorganic Fertilizer (Fert60N) (B right) during the experimental period (SR2009 to LR2012) ... 98 Figure 4.16: Comparison between observed and APSIM simulated maize grain yield in
response to combined application of manure, crop residue incorporations, and mineral fertilizers during growing seasons from SR2009 to LR2012: Error bars denote standard deviation of observed means, n=12. ... 104 Figure 4.17: Comparison between observed and APSIM simulated total above ground
biomass in response to combined application of manure, crop residue incorporations, and mineral fertilizers during growing seasons from SR2009 to LR2012: Error bars denote standard deviation of observed means, n=12... 106
Figure 4.18: Comparison of observed and APSIM simulated above-ground maize biomass in all 12 treatments combining application of manure, crop residue incorporations, and mineral fertilizers based on experiment (II) for the period between SR2009 and LR2012 in Machang’a ... 108 Figure 4.19: Development of APSIM simulated above-ground maize biomass and
temporal biomass evolution in selected 60 kg N ha-1 (60N) treatments during the growing seasons (SR2009 to LR2012) in Machang’a. ... 109 Figure 4.20: APSIM model sensitivity analyses of maize grain response to variations in
soil water balance parameters during the first (SR2009) and Last (LR2012) growing seasons under full-rate (60 kg ha-1 N) and half-rate (30 kg ha-1 N) fertility treatments of the experiment (I) in Machang’a. ... 110 Figure 4.21: APSIM model sensitivity analyses of maize grain response to variations in
soil fertility parameters during the first (SR2009) and Last (LR2012) growing seasons under full-rate (60 kg ha-1 N) and half-rate (30 kg ha-1 N) fertility treatments of experiment (I) in Machang’a ... 111 Figure 4.22: APSIM model sensitivity analysis of maize grain yield response to soil
chemical related parameters during the first (SR2009) and Last (LR2012) experimental growing seasons in all treatments of Experiment (I)in Machang’a; Kenya. ... 113 Figure 4.23: Long-term maize grain yield (maximum, average and minimum) response
to different N rates (0 to 80 kg N ha-1) and sources (sole mineral/inorganic and combined mineral and manure) for the period between 2001 and 2013 in Machang’a ... 116 Figure 4.24: Long-term maize grain yield (maximum, average and minimum) response
to different N rates (0 to 80 kg N ha-1) and sources (sole mineral/inorganic and combined mineral and manure + Tithonia diversifolia ; or + Lantana camara) for the period between 2001 and 2013 in Machang’a ... 118 Figure 4.25: Probability of exceedance of maize yield in response to N supplied through sole mineral fertilizer (at 40 and 60 kg ha-1 N) and when combined with manure at the same rates ... 120 Figure 4.26: Probability of exceedance of maize yield in response to N supplied through sole mineral fertilizer combined with Tithonia diversifolia as an organic soil incorporation (at 40 and 60 kg ha-1 N) and when combined with
Lantana camara at the same rates ... 121
Figure 4.27: Long-term maize grain yield (maximum, average and minimum) as a response to different N rates (0 to 80 kg N ha-1) supplied through Mucuna pruriens residue incorporation into the soil in a maize-Mucuna pruriens
rotation system ... 124 Figure 4.28: Probability of maize grain yield exceedance in response to N (at 40 and 60 kg ha-1 N) supplied through Mucuna pruriens residue incorporation into the soil in a mirror maize-Mucuna pruriens rotation system ... 125 Figure 4.29: Organic matter type (manure, Mucuna pruriens, Lantana camara and
Tithonia diversifolia) and its rate of decomposition days after incorporation into the soil at sowing; ... 128 Figure 4.30: Movement of nitrogen within organic matter (manure, Mucuna pruriens,
Lantana camara and Tithonia diversifolia) pools (biom_n and fom_n) and the amount of NO3 they transform days after their incorporation into the soil at sowing ... 129 Figure 4.31: Response of esw to different maize stover mulch rates (0 to 10Mg ha-1) at
different N rates (40 and 60 kg ha-1 N) and sources (Sole mineral N and when combined with manure) ... 132 Figure 4.32: The capacity of mulch rates to retain soil moisture in different profile layers under different rates (40 and 60 kg ha-1 N) and sources (sole mineral fertilizer or when combined with manure) of N ... 133 Figure 4.33: Effects of different rates (0 to 10 Mg ha-1) of mulch on soil-surface evaporation under different rates (40 and 60 kg ha-1 N) and sources (sole mineral fertilizer or when combined with manure) of N ... 135 Figure 4.34: Long-term maize grain yield response to different rates (40 and 60 kg ha-1
N) and sources (sole mineral fertilizer or when combined with manure) of N and different mulch rates (0 to 10 Mg ha-1) in Machang’a ... 137
ABBREVIATIONS AND ACRONYMS APSIM Agricultural Production Simulation Model
BR bare
CDI Cumulative Departure Index CEC Cation Exchange Capacity
CP cowpea as cover-crop
CT Conventional Tillage
CTBR Conventional Tillage under Bare Surface, CTCP Conventional Tillage with Cowpea
CTMH Conventional Tillage with Mulch,
CTSBBR Conventional Tillage under Bare Surface with sub-soiling CTSBCP Conventional Tillage with Cowpea with sub-soiling CTSBMH Conventional Tillage with Mulch with sub-soiling DAS Days after sowing
ENSO El-Niño/South Oscillation
FAO Food and Agricultural Organization
FMTL Fertilizer-Manure-Tithonia diversifolia -Lantana camara;
IL Inner Lowland
INM Integrated Nutrient Management
IPCC Intergovernmental Panel on Climate Change ISFM Integrated Soil Fertility Management
K Potassium
LAI Leaf Area Index
LM Lower Midland
LRs Long Rains
M a.s.l Meters Above the Sea Level
MAM March-April-May
Maxt/mint maximum/minimum temperature
Mg Mega gram
MH mulch
MT Minimum Tillage
MTBR Minimum Tillage under Bare Surface MTCP Minimum Tillage with Cowpea, MTMH Minimum Tillage with Mulch
MTSBBR Minimum Tillage under Bare Surface with sub-soiling MTSBCP Minimum Tillage with Cowpea with sub-soiling MTSBMH Minimum Tillage with Mulch with sub-soiling
N Nitrogen
NUE Nutrient Use Efficiency OND October-November-December
P Phosphorous
Radn radiation
RAI Rainfall Anomaly Index
SB sub-soiling
SEDAP South Eastern Dry Areas Project
SRs Short Rains
SSA Sub-Saharan Africa
TSBF-CIAT Tropical Soil Biology and Fertility Institute of the International Centre for Tropical Agriculture
TT Tied Tillage
UM Upper Midland
UNESCO United Nation Educational, Scientific and Cultural Organization WMO World Meteorological Organization
WUE Water Use Efficiency
ABSTRACT
Drier parts of Embu County endure high atmospheric heat, prolonged dry spells, declining soil fertility and erratic rainfall. Local soil and climatic variability contributes to large variations among replications of experimental treatments and inconsistence in research results leading to poor comparability of results within and without different agro-ecological zones (AEZs) hence need for site specific scenario analyses through modelling. Thus, this study sought to; i) evaluate seasonal rainfall variability, ii) rainfall effects on maize productivity and iii) its interactive effects with selected fertility management (FM) technologies on maize yield, soil water content, nutrient use efficiency (NUE) and water use efficiency (WUE) in Embu County. Long-term rainfall dailies were sourced from the Kenya Meteorological Department (KMD) while agro-phenological data were acquired from experimental trials (based on randomized complete block design) on FM and WUE at a research station in Machang’a in Mbeere Sub-County. Rainfall dailies’ homogeneity and frequency were analysed using RAINBOW-software. Rainfall trends and seasonal variability were based on Cumulative Departure Index (CDI) and Rainfall Anomaly Index (RAI) and variation (CV). Effects of rainfall variability on maize yield utilized correlation and regression analyses, and Coefficient of Correlation (rho). The Agricultural Production Systems-Simulator (APSIM model) was used to quantify the interactive effects of selected FM and mulch on maize yield and soil properties. APSIM calibration and validation was based on goodness-of-fit between observed and simulated parameters derived from residual-errors statistics; root mean square error (RMSE), square of the correlation coefficient (R2), and model efficiency (EF). Rainfall homogeneity was accepted at 99% probabilities. Analyses showed 90% chance of below cropping-threshold rainfall exceeding 213.5 mm (Machang’a) and 258.1mm (Embu) during SRs for one year return-period. Rainfall variability was found to be high in seasonal amounts (CV=0.56 and 0.38) and in number of rainy-days (CV=0.88 and 0.27) at Machang’a and Embu, respectively. Monthly rainfall variability was found to be equally high even during April and November (CV=0.42 & 0.48 and 0.76 & 0.43) with high probabilities (0.40 and 0.67) of droughts exceeding 15 days in Embu and Machang’a, respectively. Effects of seasonal rainfall variability (CV=53%) on maize productivity were high during the flowering (CV=0.49) and cob formation (CV=0.59) stages. Rainfall influenced more the productive phase (53%) than the vegetative phase (47%). Rainfall influence on maize yield variability (CV=0.91) was found to reduce and stabilize (to CV=0.71) under sub-soiling. APSIM simulations adequately predicted observed maize crop-growth (Leaf Area Index; LAI, Grain yield, and biomass). Grain prediction was good (R2=0.67 and EF>0.9) but biomass was slightly under-predicted (R2=67 and EF=0.87). The model adequately reproduced the average trend of maize grain yield response to N inputs from manure, Mucuna pruriens, Lantana camara and fertilizer. Long-term (13-year) simulations showed that moderate and low cost application of N (40kg N ha−1 from combined manure and mineral fertilizer) improved both long-term average and the minimum guaranteed grain yield (2.5 Mg ha-1) and thus recommended for smallholder farmers especially in dry areas principally during SRs. These findings should be considered in conditions where P is added proportionally to N (P/N in the range of 20 to 30%). Further studies on the interaction of P and N rates/sources, their effects on yield and soil properties under other WUE technologies are recommended.
CHAPTER ONE 1.0 INTRODUCTION 1.1 Background information
Rainfall and temperature indices are key parameters in understanding climate variability, drought dynamics and the eventual impacts on agricultural productivity (Nazrul, 2009). Drought and rainfall variability are some of the leading biophysical causes of food insecurity in Sub-Saharan Africa (SSA) (TSBF, 2009). Both impact significantly on fertilizer and water use efficiencies and also determine the efficacy of risk-aversion strategies by smallholder farmers (Morris et al., 2007). Besides fertility related constraints, drier zones of the Central Highlands of Kenya continue to record declines in per capita agricultural productivity, with yields at less than 1Mg ha-1 while the potential is estimated at 6-8 Mgha-1 (Mugwe et al., 2009; Macharia, 2012). This has been attributed to inherent low soil-water availability, erratic, and highly variable rainfall, prolonged dry spells and droughts as well as low and declining soil fertility (Micheni et al., 2004; Mugwe et al., 2009; Mucheru-Muna et al., 2009).
Soils in the study area (especially in Mbeere sub-county) are predominantly Plinthic Cambisols, characteristic of low water holding capacity, low Cation Exchange Capacity (CEC) and often with low organic matter (Jaetzold et al., 2007). While base saturation may be high, amount of nutrient base is quite low owing to low CEC contributing to Nitrogen, Phosphorous and Potassium deficiencies (Micheni et al., 2004). Poor rainfall distribution or lack of it affects crop growth and final yields (Akponikpè, 2008). Local farmers employ assorted in situ management strategies to increase overall yield
production including manuring, use of inorganic and organic fertilizers, mulching among others (Bationo et al., 1999). However, their attitudes to, and rationales behind adoption of such technologies and strategies are influenced by, among others, the availability of the technology and access to information on quantities and guidelines on how such technologies ought to be implemented under varying agro-climatic conditions (Bationo
et al., 1995; Mureithi et al, 1995; Akponikpè, 2008).
Low soil fertility and soil water content, farmers’ limited understanding of spatio-temporal rainfall distribution and plant-water-nutrient interactions as well as poor soil-water conservation techniques render smallholder farming in the region quite intricate (Mureithi et al., 1995; Bationo et al., 2003; Micheni et al., 2004; FAO, 2007). There is generally enough rain-water on total; however, it is poorly re-distributed over time (Kimani et al., 2003). Often, 25% of the annual rain falls within a couple of rainstorms that crops suffer from water stress, and eventually complete crop failure (Meehl et al.,
2007). It has also been shown that soil surface modification through tillage and residue management leads to changes in the soil water balance and hence water use efficiency (WUE) through impact on surface runoff (Laryea, 1992), evapo-transpiration and crop yield (Shisanya et al., 1996).
Owing to high agro-climatic variability and unpredictable rainfall patterns both spatially and temporally, information on seasonal rainfall variability, the interactive effects between various fertility management and soil water conservation technologies is still inadequate (Mureithi et al., 1995). Information on how such local technologies of
agricultural production can be simultaneously combined and applied optimally is equally inadequate owing to high cost of experimental replications in highly variable agro-climatic conditions (Mureithi et al., 1995; Bationo et al., 2003). Such inadequacies of vital information limit adoption and implementation of novel fertility management practices that optimizes on yield production especially in maize production systems of the region (Micheni et al., 2004; Schlecht et al., 2006; Giller et al., 2009).
1.2 Statement of the Study Problem
Drier parts of Embu County (Mbeere South) already endure high atmospheric heat, prolonged dry spells, declining soil fertility and highly unpredictable rainfall patterns (Micheni et al., 2004; Jaetzold et al., 2007). Coupled with a large and growing population segments (Micheni et al., 2004), there has been continued declines in agricultural productivity (Mugwe et al., 2009). Experimental studies in the area (Mugwe et al., 2009; Mucheru-Muna et al., 2009; Ngetich, 2012) on fertility management and soil-water conservation have been developed, and tested. However, the recommendations made are standardized application rates and procedures deemed to optimize overall yield productivity. Despite their significant impact, elevated variability in seasonal rainfall patterns and soil parameters both spatially and temporally render their feasibility, generalization and eventual adoption quite intricate. The high cost of replicating experiments limits scenario options for further evaluation.
Hitherto, the much-needed information on inter/intra seasonal variability of rainfall is still inadequate despite its critical implication on soil-water distribution, WUE, nutrient use
efficiency (NUE) and final crop yield. The heterogeneity and complexity of agricultural production systems in the region further undermine the implementation of blanket experimental recommendations. This situation calls for specific scenario consideration to provide the much needed site-specific information and optimal recommendations on how different fertility management and SWC technologies can be integrated and applied under highly variable agro-climatic and soil parameters. Scenario analyses through modeling can play a crucial role in replication, up-scaling and out-scaling of experimental recommendations into the complex and heterogeneous production system of the area while optimizing overall yield. Based on this background, this study sought to quantify and characterise inter/intra seasonal rainfall variability as the first step towards combating the effects of unpredictable rainfall patterns, and prolonged dry spells in the study area. Fertility and rain-water management options and their interactions, effects on maize yield; nutrient use soil-water and its use efficiency were evaluated.
1.3 Research Questions
The study sought to answer the following questions:
i. To what extent is the intra and inter seasonal temporal rainfall variability of Embu County?
ii. How does rainfall distribution affect maize productivity in Embu County? iii. How do selected ISFM and soil water conservation (SWC) strategies impact
on maize yields, available soil-water content, water use efficiency (WUE), NUE and maize yield in Embu County?
1.4 Research Objectives
The broad objective was to evaluate the effects of rainfall variability and selected ISFM options on maize productivity in the drier parts of the central highlands of Kenya.The specific objectives were:
i. To determine and document the inter/intra seasonal temporal rainfall variability for both short-rain (SR) and long-rain (LR) seasons in Embu County.
ii. To assess the effects of rainfall distribution on maize productivity in Embu County.
iii. To evaluate the interactive effects of selected fertility management and rain-water conservation technologies on maize yields, available soil water content, water use efficiency (WUE) NUE and maize yield in Embu County.
1.5 Research Hypotheses
The study was guided by the following hypotheses:
i. There is high inter and intra seasonal rainfall variability in Embu County ii. Rainfall distribution significantly affects maize yield in Embu County
iii. The interaction between selected fertility management and rain water conservation technologies has significant effects on maize yield, available soil water content, WUE and NUE in maize production in Embu County
1.6 Significance and Anticipated Output of the Study
Rainfall, though heterogeneous, fertility management and soil-water conservation are critical parameters that determine agricultural productivity of any region (Ati et al.,
2005). Applying knowledge of their statistical properties derived from long-term observations and experimentation and replication is crucial to optimal agricultural production. This serves in developing drought mitigation strategies especially in arid and semi-arid production systems. Quantification and characterization of inter/intra seasonal rainfall variability and its impacts on maize yield were anticipated. Quantities of selected fertility management and soil-water conservation scenarios and their effects on maize yield, soil nutrients and soil water were also objectively anticipated.
Understanding of seasonal rainfall variability would significantly help extension providers (together with forecasters) on guiding smallholder farmers on when and what to plant. It will also help in designing irrigation systems to supplement rain-fed agriculture within and without the study area. Calibration and validation of the APSIM model would significantly aid researchers and government extension providers in designing and analysing SWC and ISFM practices; through both ex-posed and ex-ante analyses that will optimize agricultural production. Modelling scenarios of these technologies under varying agro-hydro-ecological conditions will potentially expand reliability, replication and generalization of experimental results at lower costs. This could then be extrapolated to other regions within the country with similar agro-climatic and soil conditions to enhance productivity, upscale soil fertility management technologies essential in poverty alleviation and environmental protection.
1.7 Definition of Terms
Rainfall Anomaly Index (RAI): is an index calculated on a temporal (weekly, monthly or annual) time scale based on distribution of rainfall as an indicator of relative drought and variability in the long or short term rainfall distribution. Mathematically, actual rainfall [r] is compared to an arbitrary value of +3 and -3, which is assigned to the mean of ten extreme + and anomalies of the actual rainfall [r] to provide trends in annual and seasonal variability
Cumulative Departure Index (CDI): from normal rainfall is a concept utilized to evaluate the temporal correlation of rainfall distribution with surface water or ground water levels. It is derived from the arithmetic mean of seasonal and annual rainfall for the period of record.
Rainfall return period: is an estimate of the likelihood of an event, in this case rainfall to re-occur. It is a statistical measurement typically based on historic data denoting the average recurrence interval over an extended period of time, and is usually used for risk analysis
Threshold rainfall: the minimum rainfall amount required to initiate and sustain crop germination and growth during a cropping season
Cessation month: the month during which rainfall events and amount drastically reduces and eventually stops marking an end of a rainfall season
1.8 The conceptual Framework
The concept envisaged throughout this study was that there exists a complex linkage between agro-climatic indices and soil parameters that greatly impacts on agricultural (maize) productivity (Figure 1.1).
Low & Declining Agricultural Productivity (Maize) Declining Soil Fertility Poor Fertility Management Practices
Intensive /
continous Cropping
Low Soil Water Content & Poor SWC strategies
Study and Characterize inter/intra Seasonal Rainfall Variability
(Objective1)
Understand the Impact of Rainfall Distribution on Maize yield (Objective 2)
Best-bet information on Combining ISFM, SWC technologies; NUE, WUE + Optimal Rain-water Utilization High Climatic Variability &
Unpredictability
Inadeqaute info on inter/ intra seasoanal Rainfall Variability Prolonged Dry Spells/ droughts Identify/Evalaute Selected Fertility Management Options (Obj3)
Identify & Evaluate selected SWC options (Obj 3)
Understand the \interactive Effects between Selected FM and SWC Options
under Varying Climatic and soil Conditions through Scenario analyses:
Modeling (Obj 3)
INTERVENTION
Improved Agricultural producotivty & ; Adaptability to Cliamte Change
Figure 1.1: Conceptual framework showing the interrelationship between the different variables studied
Mbeere district endures high atmospheric heat, unpredictable and highly variable rainfall that directly impacts on available soil water and fertility. Small-holder farmers employ
assorted farm management practices (mulching, tillage, fertilizer use, manure application and residue management) most of which are championed by research study recommendations. However, elevated climatic variability, (undermines optimal rain-water utilization), declining and poor management of soil fertility as well as low use of soil water conservation strategies continue to undermine overall maize production.
This study integrated the two prime bio-physical components (rainfall variability and soil management) within three objectives by focusing on selected Fertility Management (FM) and SWC technologies. Quantifying and characterizing inter/intra seasonal rainfall variability would function as first step towards mitigation of droughts and prolonged dry spells to optimize rainfall utilization (Objective 1). These seasonal quantities provide an indicator of available soil water, fertilizer use efficiency as well as WUE which have direct impact on final crop yield (shown by relating rainfall distribution on maize productivity (objective 2). Due to inadequate information on combining certain FM and SWC technologies in tandem with prevailing climatic conditions, modeling aids in integrating the three components in objective 3 (rainfall patterns, selected FM technology and SWC strategy) to provide quantities (on Available soil water content, NUE and WUE in line with individual practices) that will unravel optimal combinations and timing in order to identify best-bet strategies for improving rain-fed production systems (objective 3).
CHAPTER TWO 2.0 LITERATURE REVIEW
This chapter succinctly reviews the key findings, theoretical and methodological contributions by past studies in the subject matter being studied. Underpinned thematic areas comprise of an overview on rainfall variability and its methodological analyses, and how rainfall variability impact on agricultural productivity. An evaluation of how fertility and soil water management technologies impact on agricultural productivity over time is also presented. A brief literature on crop growth modelling was also reviewed.
2.1 Assessment of Rainfall Variability
Atmospheric circulation is a major determinant of climate variation in SSA (Dore, 2005; Akponikpè, 2008; Zhang et al., 2008). Rainfall seasons are typical between March and July (Long Rains; LR) and October to December (Short Rains; SR) with the remainder of the year being very dry (Dai et al., 2004). Long term rainfall trend towards aridification has been reported in SSA with different rainfall datasets indicating that the isohyets have shifted 100-150 km southwards since the 1960s (Sivakumar et al., 1993). Dai et al.
(2004) and Hulme (2001) confirmed aridification trends to be real and continuing. Temporal variability of rainfall is also very high on the annual, monthly and daily time scales (Akponikpè et al., 2008). Sivakumar et al. (1993) asserts that understanding the average amount of rain per rainy day is essential in assessing inter/intra seasonal variability. Evaluating mean duration between successive rain events also aids in understanding seasonal variations (Akponikpè et al., 2008). Graef and Haigis, (2001) reported that annual rainfall differences may occur in any direction spatially and
temporally but a difference of 200 mm to 300 mm can be recorded within 100 km, or within 6-day radius, respectively.
Past studies often attribute rainfall variability to El Nino/Southern Oscillation Index (ENSO) and related sea surface temperatures (Goddard et al., 2001; Chambers, 2003; Yasunaka and Hanawa, 2005). According to Philips (2003) and Hansen (2005), linking ENSO to rainfall variations has contributed to the understanding of interaction between the atmosphere, land and sea. However, Recha et al. (2011) noted that most studies do not provide information on the much-needed character of within-season variability despite its implication on soil-water distribution and productivity. High variations in annual and seasonal rainfall totals and rainy days in Ethiopia and Sudano-Sahelian regions have been noted (Sivakumar, 1991; Seleshi and Zanke, 2004; Tilahun, 2006). Mugalavai et al. (2008) analyzed onset and cessation of rainfall in Kenya and linked their variation to atmospheric, oceanic and local geographic conditions but within-season temporal rainfall variability was not evaluated.
In the drier zones of the Central Highlands of Kenya, monthly rainfall variability is somewhat more distinct as rainfall may occur during the 4-7 rainy months (Jaetzold et al.,
2007) but with high seasonal variations, persistent dry spells, prolonged droughts and high annual potential evapo-transpiration of 2000 – 2300mmyear−1 (Micheni et al.,
2004). There is generally enough water on the total; however, it is poorly re-distributed over time (Kimani et al., 2003) with 25% of the annual rain often falling within a couple
of rainstorms, that crops suffer from water stress, often leading to complete crop failure (Meehl et al., 2007).
2.2 Rainfall Distribution and Agriculture
Rainfall availability and spatio-temporal distribution have been implicated directly to combating extreme poverty and hunger through agricultural enhancement (IPCC, 2007). This is particularly important in SSA where agricultural productivity is highly reliant on the effects of inter-annual rainfall distribution and variability (Jury, 2002). Ati et al.
(2002) observed that the amount of water available to crops depends on rainfall onset, length and cessation thus influencing the successfulness or failure of a growing season. According to Khuram and Rasul (2011), soil water (whose major input is rainfall) is the basic requirement for crop growth from sowing to maturity. Overall, crop water requirement mainly depends upon climatic factor such as temperature, solar radiation, relative humidity, wind speed and crop phenological stages (Ghazala and Mahmood, 2009) which are highly variable, erratic and extreme in semi-arid regions (Akponikpè, 2008).
Khuram and Rasul (2011) reported a correlation between rainfall and maize grain yield at the vegetative and reproductive stages as 61%, and 60%, respectively. These results were in line with total rainfall range of 135-530 mm within the growing season. They recorded the highest yields at 300 mm, 277 mm, and 168 mm of rainfall amount during the growing season, vegetative phase and the reproductive phase, respectively. These rainfall events with highest yields were regarded as optimal rainfall events in the Pakistan arid region. An earlier study by Heisey and Edmeades (1999) had established that drought
stress, being an index of extreme rainfall variability, impaired optimal grain yield especially when reported at the reproductive stage of the crop phenology (Heisey and Edmeades, 1999).
Poor rainfall distribution leading to water stress equally impair stem elongation, leaf and stem development in crops thus affect final crop yield (Muchow, 1989). Chi-Chung et al.
(2004) reported that rainfall distribution and temperature have opposite impacts on yield levels. To counter extreme events, it may be essential to utilize early maturing cultivars and practice early planting (Bancy, 2000). Notwithstanding, adoption of common high-yielding varieties, uniform planting practices and common timing of field operations could render crop yields highly affected by elevated variability in weather patterns (Anderson and Hazell, 1987).
Thus, understanding crop productivity under varying rainfall distribution, water deficiency and the interactive effects at different temporal distribution in the drier zones of Central Highlands of Kenya is quite critical. Keeping in mind that rainfall differences may occur in any direction spatially and temporally with a difference of up to 200 mm to 300 mm being recorded within 100 km, and within 6-day radius (Graef and Haigis, 2001), then local analyses of these impacts on crop productivity is quite essential to aid in decision making on what, how and when to plant (Dai et al., 2005).
2.3 Soil Fertility Management, Soil Water and Crops production
Integrated soil fertility management in dry-land farming entail maximizing water capture and eliminating runoff, minimize water/wind erosion, managing limited available organic
resources to compensate for poor soil physical properties and strategic application of mineral fertilizers (TSBF, 2009). These fundamentals indicate an interaction between soils, climate and human management in order to optimize overall yield productivity; yet all are highly variable parameters. Studies show that in drought-prone environments, crop response to fertilizer is highly dependent on seasonal distribution of rainfall due to its influence on soil water content (Shumba et al., 1992; Nyakatawa et al., 1996; Nyamudeza, 1998; SEDAP, 2001). Lee (1993) acknowledged that farmers’ poor fertilizer use is occasioned by inadequate knowledge on its interactive effects on soil water content and rainfall events.
Trends have been reported in semi-arid West Africa indicating a decline in fertility and soil water content (Bationo and Mokwunye, 1991; Nyamudeza, 1998). Despite the role of
in-situ rainwater harvesting systems and conservation strategies in improving available soil water for crop growth, their potential to mitigate dry spell planting and attendant problems such as yield reduction appears limited often due to inadequate information on how nutrient-water balance can be optimized under same strategies (Akponikpè et al.,
2008).
In an experimental study on soil nutrient content, soil moisture and yield of Katumani maize, Muniafu and Kinyamario (2007) observed that with lower rainfall amounts received in a season, lack of significant correlation between maize yield and percent clay content (r = 0.21) implied a larger influence of rainfall on yield in sandy soils (faster moisture loss) than in clay soils. They further observed that maize yields were high in
plots treated with maize stover as soil residue and in plots with clayey soil (attributed to high soil-water holding capacity) as compared to yields in control plots with no residue cover. Their conclusion was that main factors influencing yield are rainfall amounts received in a growing season (indicator of available soil water content) and soil clay content (texture) and treatment (ISFM) practice. According to Muniafu and Kinyamario (2007), low rainfall amounts, yields were high in plots with residue treatment notwithstanding clay content.
Nutrient-water balance analysis provides a basis for maintaining soil fertility (Archer, 1988) and is crucial for identifying un/sustainable land use systems (Bindraban et al.,
2000) which is indeed inadequate in the drier zones of Central Highlands of Kenya (Mureithi et al., 2005). In drought-prone areas like Mbeere District, smallholder farming systems lack the internal capacity to replenish nutrient and water losses due to crop biomass off-take (Powell et al., 1996). In the Sahel, Pilbeam et al. (2000) attributed this to difficulties in quantifying some of the components (e.g. leaching and gaseous losses for nitrogen). Hitherto, there is limited information the long-term interactive dynamics of the nutrient-water balance and its effects on maize yield within the study area.
2.4 Effects of Soil Fertility Management and Soil Water Conservation on WUE Combined use of organic and inorganic fertilizers increases crop yield and maintains soil resources (Bationo, 2005; Akponikpè et al., 2008). Unlike mineral fertilizers, organic nutrients in manures are slowly released, stored for long within soils thus ensuring long fertility residual effects (Belay et al., 2001). Organic mulching raises soil water retention
capacity through reduced run-off and evaporation alongside elevated infiltration (Rao et al., 1998; Schertz and Kemper, 1998). Organic matter also provides growth regulating substances such as soil nutrients like nitrogen, carbon (Sharma and Mittra, 1988), improves soil physical (EI- Shakweer et al., 1998), chemical (Schjonning et al., 2004) and microbial (Belay et al., 2001) properties.
Tran-Thuc-Son et al. (1995) reported that manure improves soil physical and chemical conditions and help conserve soil moisture. Palm et al. (2001) suggested an integrated nutrient management (INM) program in which both organic manure and inorganic fertilizer are used. Increased grain yield observed from combined application of farm yard manure (FYM) and inorganic fertilizers is in line with other results on sorghum (Hedge, 1996), rice (Sharma and Mittra, 1991; Metho et al., 1999; Yadav and Swain et al., 2000), soybean (Reddy et al., 1999), maize (Ma et al., 1999) and wheat (Yadav and Swain, 2000; Yadav and Scherr, 2001).
Combining mulches alongside fertilizer increases grain yield and WUEs (Shafiq et al.,
1994). Zaongo et al. (1997) reported improved WUE of sorghum in Niger in treatments combining irrigation, mulch and N fertilizer. They observed that WUE increased by 27% with mulch as a sole treatment. The observed that mulching significantly increased the harvest index and was associated with a slight increase in 100-grain weight. Maize stover mulch has been reported to increase moisture conservation and maize yield (Chaudhry et al., 2000) and the overall WUE in maize. According to Geerts et al. (2009), cereal-crop growth is positively correlated to the amount of water cereal crops transpire.
Thus, strategies that minimizes evaporation and optimize transpiration in cereals may raise the efficiency of water utilization by crops. Mulch reduces soil evaporation by 21% under minimum mulching and 40% under maximum mulching in maize (Chen et al.,
2007). Mulch increases water accumulation (Barrios et al., 2001) and enhance uptake of N and P by improving soil microclimate (Bhagat, 1990; Sharma and Acharya, 2000). Shafiq et al. (2006) reported that mulch enhances N uptake by 28.3% in grain and 45.1% in stover of maize. Howell et al. (1998) showed that in fine silt and fine loamy soils, mulch at a rate of 6.7 Mg ha-1 increases grain yield by 17% and WUE by 14% compared to bare soil. Combination of organic and inorganic fertilizer increases synchrony and reduces losses by converting inorganic nitrogen into organic form (Kramer et al., 2002). Combined use of manure and inorganic fertilizers, in addition to the additive effect on nutrient supply and improvement of soil physical conditions, checks N losses, conserve soil N, and ensures greater yields (Satyanarayana et al., 2002).
2.5 Crop Growth Modeling
Different research studies on optimizing agricultural production have been conducted drawing recommendations globally (Bationo et al., 1998; Lamers et al., 1998; Bationo and Buerkert, 2001; Sinaj et al., 2001). However, much of these recommendations fail to be adopted; partly due to weakness of extension services, incomplete exchange mechanisms between farmers-development-research and extension, as well as the complexity and heterogeneity of most agricultural production systems. This situation calls for decision support systems such as crop-growth simulation models to enhance adoption and decision making in heterogeneous production systems (Akponikpè et al.,
2008). Modeling provides complementary tools, useful in agricultural research by providing rapid testing platforms that combine socio-economic, soil and climatic factors to aid in both ex-ante and ex-post field trial implementation with most promising combinations (Boote et al., 1996).
Models are simplified mathematical representations of reality with capacity to compute outcomes without having to perform field trials or experiments (Mccown et al., 1996; Akponikpè et al., 2008). Crop growth models can be utilized to predict crop yield under assorted management strategies and site-specific properties or characteristics which are essential yield determinants (including moisture, nutrient supply and radiation balance among others). Operation of crop-growth models utilize growth-engines which produce biomass based on biophysical components (Steduto et al., 2000). Based on growth-engine drivers and their evolution, crop-growth models can be summarized into three categories.
The first one is empirical-statistical models; being the oldest crop models dating back in 1930s. These models predict yields based on statistical functions (as growth-engines) of the observed prime environmental characteristics (rainfall, solar-radiation, organic matter content, particle size etc.) and their distribution during the entire or part of the growing season (Dourado-Neto et al., 1998). Statistical functions used are developed through simple and multiple regression techniques such as linear/stepwise, Maximum Likelihood estimation (ML) and Ordinary Least Squares (OLS). Besides their significant impact, most empirical models can only (accurately) be applied in their original calibration zones (Mccown et al., 2006). Quite often, extrapolation to new conditions is not warranted
while utilizing Empirical-statistical model. Generally, these models could be utilized under particular circumstances; they are continually being replaced by more or less dynamic models with respect to at least the soil-water balance (Akponikpè et al., 2008).
Second are the water-balance/Stress Index-models which have been consistently developed partly as a response to persistent constraints to water-use-efficiency in crops. This is pronounced in arid and semi-arid areas regions extensively utilized to simulate infiltration, drainage, surface evaporation as well as run-off. For instance, evaluation of transpiration can be realized through simple canopy description through empirical functions. Additionally, a stress index for instance the ratio of actual (soil/root limited) to potential evapotranspiration can empirically be related to the reduction in crop-growth and yield. Generally, water balance stress-index models have been applied on wider range of scales compared to process models. Examples of models in this category include AquaCrop (Steduto et al., 2009) and CropSyst (Cropping System) (Stöckle et al., 2003). Third and last are the dynamic process models. Their development aims at simulating crop-growth alongside associated phenomena that influence crop growth such as water and soil solutes and their movement. They are rather powerful as they simulate over time often on daily or sub-daily time-steps; accounting for crop-growth (developmental, ecological and physiological) processes and their interaction with the environment (CLIMAG-WA, 2002; Akponikpè, 2008). They are (i) mechanistic (attempt to capture our understanding of the mechanisms of crop-growth processes, and (ii) Functional models that underpin simplification of data requirements, and offer robustness of predictions over broad range of applications (CLIMAG-WA, 2002; Akponikpè, 2008).
The most promising of dynamic process models include: STICS (Simulator multidisciplinary for Crop Standard; Brisson et al., 2003), DSSAT (Decision Support System for Agro-technology Transfer; Jones et al., 2003), and APSIM (Agricultural Production Systems Simulator; McCcown et al., 2006) among others. The main disadvantage of these models (over empirical models) is their complexity, high data demand and accessibility to stakeholders. Conversely, the complex water-nutrient-genotype interaction governing crop-growth and development limits the usefulness of empirical models (Akponikpè, 2008).
Due to the heterogeneity especially pertaining to agro-ecological differences, prediction accuracy of empirical models might be low making them rather unsuitable for long-term system analyses. Thus, the complexity and heterogeneity of the region render use of dynamic modeling tools a prerequisite. Limited data may lead to use of simple empirical models but this may undermine extrapolation of recommendations; the option is to start with few cases with enough data to be used in process dynamic models as decision support tools in research. Regarding the mechanistic and dynamic models, APSIM and DSSAT are more promising as they overcome some of these constraints and benefit from a long history of collaboration with the scientific community in SSA. The APSIM model has in-build modules (soil, maize, nitrogen and soil-water among many others) that any other soil-model would require to enhance accurate prediction thus, based on its strengths and versatility, it was chosen for use in this study.
2.5.1 The APSIM Model
The Agricultural Production Systems Simulator APSIM is a modular modeling framework developed by the Agricultural Production Systems Research Unit in Australia (Keating et al., 2003). APSIM implements a high degree of modularity of the various modules and processes (Mccown et al., 2006). APSIM includes all of the relevant crop modules including maize (Akponikpè, 2008). In Africa, APSIM has been used to measure maize responses to low rates of N fertilizer application from mineral fertilizer (Chivenge et al., 2004; Kinyangi et al., 2004) or/ and manure (Micheni et al., 2004); and to quantify the risks and returns of alternative technology investment options in allocating scarce resources (labor, capital and land) to achieve whole-farm production goals (Shamudzarira et al., 2000; Shamudzarira and Robertson, 2002). Robertson et al. (2005) reported the ability of the APSIM model to simulate maize response to previous green manure legume (Mucuna pruriens) and N fertilizer application in Malawi.
The APSIM model was also successfully tested to reproduce maize response to various P fertilizers in Western Kenya (Kinyangi et al., 2004). APSIM application in the central Highlands of Kenya remains limited yet its utilization may aid in enhancing agricultural productivity in the region (Micheni et al., 2005).
2.6 Summary of Literature and Study Gaps
Various studies on climatic patterns as well as integrated soil fertility management (ISFM) have been conducted within and without the study area (Mugwe et al., 2009; Recha et al., 2013; Ngetich et al., 2012, Mucheru-Muna et al., 2013). Most of the studies have focused on soil fertility replenishment through use of organic and inorganic inputs,
rain-water harvesting and selected technologies on soil water conservation and climatic patterns. Climatic patterns, in particular rainfall, have been addressed from an annual average perspective giving inadequate attention to inter/intra seasonal rainfall properties despite its significant contribution to the understanding the concepts of climate change and variability, agricultural intensification and expansion. Most of these studies have also inadequately addressed the link between rainfall trends and its variability to agricultural productivity despite its critical role in optimizing yields under selected WUE technologies. Despite the significant impact studies on ISFM have had on overall agricultural productivity among smallholder farmers in the study area, the heterogeneity and complexity of the agricultural production systems in the region has inadequately been addressed thus undermining the blanket implementation of experimental recommendations across the region. This situation calls for site-specific scenario consideration and information on soil characteristics and agro-climatic variables which scenario analyses through modelling offers. This study therefore sought to address some of these gaps with the main aim of evaluating inter/intra seasonal rainfall variability, its effects on maize productivity under selected ISFM and WUE technologies by underpinning the long-term influence of site-specific variables through modelling.
CHAPTER THREE
3.0MATERIALS AND METHODS
This chapter outlines a succinct description of the study area, experimental and research designs employed to address each objective during the study, data collected as well as the software and statistical tools of data analyses and methods used.
3.1 The study area
The study was conducted in Mbeere South Sub-county, (of Embu County) in the larger Central highlands of Kenya (Figure 3.1).
Figure 3.2: Map showing the study area, the locations of the point-gauged rainfall stations (Embu and Machang’a) studied and the experimental site (Machang’a) where the field trials were installed (Source: Author, 2013)
Mbeere South District lies in the lower midland 3,4 and 5 (LM 3, LM 4 and LM 5), Upper midland 1,2,3 and 4(UM 1, UM 2, UM 3 and UM 4), and Inner lowland 5(IL 5) (Jaetzold et al., 2007) at an altitude of approximately 500 m to 1200 m above sea level (a.s.l). It has an annual mean temperature ranging from 21.7 to 22.5o C; average annual rainfall of 700 to 900 mm. It has a population density of 82 persons per km2 with an average farm size less than 5.0 ha per household. The rainfall is bimodal with long rains (LR) from mid-March to June and short rains (SR) from late October to December hence two cropping seasons per year. The soils are predominantly Ferralsols and Acrisols (Jaetzold et al., 2007). Various agricultural-based studies have been carried out in the region hence the rationale behind its selection. According to (Mugwe et al., 2009), the region has experienced drastic declines in its productivity potential rendering its populace resource poor. There is a secure tenure system on land ownership but underscore in productivity due to inadequate information on the rainfall patterns. The prime cropping activity is maize intercropped with beans though livestock keeping is equally dominant.
3.2 Experimental and Research Design 3.2.1 Seasonal Rainfall Variability
Objective one aimed at characterizing rainfall variability and dry-spell probabilities of two contrasting agro-ecological zones (AEZs) within Embu County (i.e. Mbeere South (lower midland 3, 4 and 5, Upper midland 1, 2, 3 and 4, and Inner lowland 5 and Embu East (Upper Midland 2) ( Sub-Counties)(Jaetzold et al., 2007). Mbeere Sub-county represents a sub-humid climate region, with annual average rainfall of 781 mm while Embu is more humid with annual average rainfall above 1,210 mm (Table 3.1).
Table 3.1: Selected agro-climatic characteristics of the meteorological stations (Embu and Machang’a) used in the Study
Station Lat* Long* Alt* Record_P* Rainfall Climate Data
Embu 0o30'S 37027'E 1409 13 1210 humid R
Machang’a 0o46'S 37039’E 1106 13 781 s-humid R * Lat=Latitude, Long=Longitude, Alt=Altitude, Record_P=Period of Record
Daily rainfall, and maximum/minimum temperature and solar radiation data were sourced from both the Kenya Meteorology Department and research sites with primary recording (using rain-gauge installed at Machang’a) stations within Mbeere Sub-county. The choice of rainfall stations used relied on the agro-ecological zones, the percentage of missing data, (less than 10% for a given year as required by the world meteorological organization (WMO).
3.2.2 Rainfall Variability Effects on Maize Productivity
The second objective focused on Mbeere South Sub-County; generally drier and where trials on water use efficiency (WUE) (Section 3.2.2.1) had been established at a station called Machang’a. Rainfall data used in this objective was acquired as stated in (Section 3.2.1).An experiment on WUE summarized in (Section 3.2.2.1) was used to provide data on maize phenology, and yield (grain, stover and biomass).
3.2.2.1 Experiment One: (Water Use Efficiency)
The experiment was set-up in 2009 Long Rains (LR2009) in Machang’a Secondary School. The trials followed a 2 x 2 x 3 split-split plot design in a randomized complete block arrangement that was replicated thrice. Each plot measured 6m by 4.5 m in area.
Experimental factors were two tillage methods with and without sub-soiling (SB) alongside three soil surface management practices (bare as the control, mulch at 5 Mgha-1 of maize stover), and use of cowpea as a cover-crop. Sub-soiling involved deep ploughing (to a depth of at least 45 cm) along and between the planting rows using a mattock. The test crop was maize (Zea mays L, DH04 variety). Three maize seeds per hill were planted with a spacing of 0.9 by 0.6 m between rows and hills, respectively. Two weeks after germination, thinning was done to ensure the recommended population density of 2 seeds per hill. Goat manure was spread before ploughing at a rate of 6.25 Mg ha-1 so as to supply nitrogen (N) at 30 kg ha-1, and incorporated during land preparation. Inorganic fertilizers (NPK 23:23:0 and TSP) were spot applied during planting at a rate of 60 kg ha-1 N leading to the recommended rate of 90 kg ha-1 N. Phosphorous (P) was applied as Triple Super Phosphate (TSP) to supply total P of 90 kg ha-1. All other standard agronomic practices were followed for optimal productivity.
3.2.3 Interactive Effects of Selected ISFM technologies on Maize Production; Modeling
The third objective focused on fertility management in Mbeere South Sub-county also; where trials on Soil fertility had been established in a station called Machang’a. Experimental trials (Experiment Two; section 3.2.3.1) provided hydro-eco-phenological data that was utilized in APSIM Model calibration, validation and sensitivity analyses. Soil moisture measurements, conducted in all the plots with an on-site calibrated capacitor probe (Diviner 2000) at approximately 14-day intervals throughout the growing season from 10 cm to 100 cm depth at 10 cm intervals, were utilized.
3.2.3.1 Experiment Two: (Soil Fertility Management)
The experiment on fertility management has been running since 2004 to date at a trial site in Machang’a Secondary School. Each plot measured 6 m by 4.5 m in area and the test crop was maize (Zea mays L, Katumani (2004-2007) and DH04 (2008-2012) variety. Three maize seeds per hill were planted with a spacing of 0.9 m by 0.6 m between the plant and within the rows. Two weeks after germination, thinning was done to ensure the recommended population density per site. The experimental setup followed a randomized complete block design with the treatments shown in Table 3.2.
Table 3.2: Fertility amendments and their N and P quantities incorporated into the soil in Experiment (II) for the period between SR2009 to LR2012 cropping seasons in Machang’a
Treatment System Amount of N Applied (kg N ha-1)
Inorganic Organic Control
Mono-crop
0 0
M fertilizer 30 kg N ha-1 30 0
M fertilizer 60 kg N ha-1 60 0
M fertilizer 90 kg N ha-1 90 0
Lantana camara+30 kg N ha-1 30 30
Lantana camara 0 60
Manure+30 kg N ha-1 30 30
Manure 0 60
Tithonia diversifolia +30 kg N ha-1 30 30
Tithonia diversifolia 0 60
Mucuna pruriens+ 30 kg N ha-1
Mirror-rotation
30 **
Mucuna pruriens 0 **
Mucuna pruriens +30kg N ha-1(sole) 30 **
Mucuna pruriens(sole) 0 **
Kg N ha-1= Nitrogen applied in Kg per Hectare, M= mineral P=Phosphorus. ** In
Mucuna pruriens means that the quantities supplied depended on the biomass produced, calculated based on Table 3.3 and average quantities are summarized in Table 3.4.
Treatment with Mucuna pruriens adopted a mirror-rotation design whereby after each harvest, sole Mucuna pruriens biomass harvested was incorporated into the soil (then