I. f;~ODIFICL':HOns OF RADil:.L DISTRIB1J'I1 ION
OF
I!J'L'ERFjHETATIOH Of 15LECTRO:N Dili'FRAGTION OF
'
FU.RJ1.N, PYRROLE, AUD THIOPHEN.E
Thesis by
Verner Schomaker
In Partial Fulfillment of the Requirements for the Degree ot Doctor ot Philosophy
California Institute of Tecl:lnology Pasadena, Cal1fo rnia
I. i.:odifioaiiions of' the Radial Distribution 11Iethod
ot
Interpretation oi' ..i:leotron Di:t'f'raotio:c1 ?h.oto-gr'1-ph.a of Gas I:.;oleoules11... lntrod·..:tc t ion B.. General :Z·heory
l~ .De:t'ini iiion o:t' D(.L') and D' ~);
:Je:r:Lva-tion of a general radial distribu:Je:r:Lva-tion
Page
1
formula 2
2. Substitution of a summation over
dis-orete ·terms for integr1.:1tion over all
values of" the angle variable ? 3. The "art ifioial temperature 1'aotor";
its relation to an only finite upper
limiting 'Talue of' the angle variable 14
C. A:p:pl ioa t ions
l. The radial distribution method
ot
Pauling and Brockway. The transitionto a modified method 28
2. The modified radial distribution method 51
3. Some special points 33
a4 The etreot of omitting the .first
terms of the summation; The
faotor l/~~,SJ 34
6..R"
b. The faotor _L'.ze- 36
a. Attenipted quan·t1tat1ve estimation
ot errors
arisingfrom (e) and (b);
comparison ·with errors of'inte:r-atomio distances obtained by the
older radial distribution method 58
44 Discussion and suggested further
II. The Electron Diffraction Investigation of the
Jtruotilre of Benzene, Iyridene, Pyrszine,
DutaCliene 1 Cycilo:pentadiene .; .Uur:an, 3:yr:ro1e :1
Page
a.;_d 1.1hiophe:n.e 4 7
I l I. ::Jur.1.nrn:ry 59
I'l, ,h.clcnowledgment 60
V
Propositions 61OF
OF
DA. Introduot1on
The problem of the interpretation of data obtained
experim.ents on d ion ot eleotrons by
gas moleeules1, tor tlle :purpose of obtaining
tion about inter~tomia distanoea and in
a large nUtnber of compounds, must be at·taolced in a
that is both etticient and reasona.bly acourate. exist. The first 1 oalled the '"visual'•
method2 , consists of the qualitative and quantitative comparison
ot
the diffraction pattern, as determined by visual inspectionot
the photographic record~ with that calculated w1 th tne aid of a theo:r:etioal intensi t;r tunatlon tor an assumed molecular model. The second,tlle "radial distribution"
method~\
employs the samei data as the first, but by an inversion of the theor• •tioal formula leads directly to the de$1red informa-tion. [ts advantages or sim.pl1o1ty and economy ofeffort have, however, been
generally overbalanced bythe greater power and reliability ot the Visual method.
1.. For a. oomp:rehens ive :review on the investigation of structure of gas molecules by the eleotron dif•
traction method, see L.O. Brockway,
Rev.
Mod. Phys.t§.,
231, ( l\136).
2. R. W1erl, Ann. d. Physik,
§.,231, (1936).
L. Pauling and L.O. Brook.way, J. Ohem. Phys.,!'
86 7' ( l 934).
For relatively unimportant and little used
variants
ot
the method see Brockway, loo. oit.2.
In this section modifications, involving'
v
littleadditional labor, are presented, wnioh, to& \er with
the generally .more complete date avail~fble at ~esent,
greatly increase the e oaoy the :radial d
•1bu-tion :method, and render 1 t equal to the visual n... 'lod
in 1.m.portanoe as a tool for the treatment o:t' eleo\ n dittraotion data in the study
ot
molecular struoturWith these modifications, it can generally be de~endt
upon to give interatomic distances which suggest a model that needs only to be refined somewhat by the
application ot tne visu~l met.hod.
The greater part ot this section is devoted to
a discussion of the theory, developed Chiefly by
Dr. Degard, which is tound to underlie theee
modifica-tions, and 01' an effort to estimate the importanoe of
the approximations involved in the radial distribution
method as it now stands. The eommon errors of the older radial distribution method can be partially understood with the help of the conclusions based on
this discussion, and further modifications of the radial distrj.bution method are suggested.
3.
of this section, and to Dr. Simon Bauer for helpful
early d1soussione, and I owe thanks to Professor ?tn.J.ling, es:pec ially, for o onstant, and frequently nacessa1·y,
encouragement, :us well as
tor
valuable help '.11·~h theB. General Theory
to
l. Definition of D(,,t'); Deriv~tion of the general radial distribution formula.
the purposes of 'this section 1 t is desirable
ze the usual expression for the l
t cone eleotrons elastically soat·
tared at an angle ,,..9 with resp:iot to an homogeneous incident beam of electrons of wave length .A by
randomly oriented gas molecules. 1
rh1s is done by
introducing a formally continuous distribution tunotion
D ~r)
cL)'
whioh is proportional to the probability of'finding in the molecule and atom 1 and an atom j
e.
distance~
e.part. The result is:\ " " [ " " ' " l: I (Zi-fi/(Z:j-F7/ ~;;;-_, ( i
l
I
rs; = k' ~ .::i!iE'..-17 &l·.,.~.,/f'' z ... ;z..s-.,
.s-e;'no/ecq/q,. , . .o 'i:7
.t~f·
.
,
whereS7T<G~£::t)~
k' is the uninteresting constant
ZL {
=Ila
,
z,
1s the atom10 number of the 1-th atom and F, , its""" .,,. ,.a....;...9..4J ,tJ
X-ray form factor, and s
=
X
•
D<j (...<} 1• nol".U'.l.al1aed in the following manner.( 2)
L
~"
p,;t.i'
Ju -
[D.:;
U.).l'.e
%z.
Zj·
l. See,
tor
example, Brockway, Rev. Mod. Phys., ~'It is olear tnat {l) automatically provides for the treatnent ot rigid, as well as non-rigid, molecules.
Equation {l) may ·be l"f!lwritten as
(3)
I
~.1==A''f;.f1~~::~~
f
LJ..;.r~
Q & > d . .__--, _ ___.,.
o f /
this is not enough tor our purpose; it is necessary to write the integrand of I(s) as a produot of the form,
utJ/
sin{s.f'L
?l(s).
It1s
convenientto
1ntroduoethe
following definitions:Evidently the desired separation oannot in general be
aooomplished, even if the structure of the m¢lecule
under consideration is known; and obviously, of course, it is impossible 1t nothing is known about the structure
ot the molecule at all. However, it is seen on
examina-tion of the form tao tors, F ,· , that
z~~;-·
is nearly lthe same function
ot
s tor all atoms , so that for anyset ot atol!ls 1t is possible ~to choose a function /{s)
which will be a reasonably good representation of /( s , / ) .
Usually, indeed it will be round satisfactory to ig,nore the variability of
-¥7 (
s).. As the result of all this,(3) may now be written
{ 6
l
I
ts.J=-
kj
oa~
-d'
LJI{//
~
..s-/ /...f" ()is justitiablet as will be seen later, to
allow s to have all positive values instead of imposing
the functional limit which arises from its definition. This being true, (6) satisfies the requirements of a Fourier integral anct can be inverted in the usual
way.
1f1
9ru1=
J':-
f-/M~
a;t-~,,.
satisfies certain requirements, and u, as well as
"t,
may have all positive values, then,
The application of these formulae to ( 6) yields the desired result2,
2 , where K-= 7ri<' •
1. Ooure.nt and Hilbert, ":Methoden der Mathematisohen Phys1k," Vol. I, Julius Springer, Berlin, page 68.
a.
This is a slight extensionot
Degard's formula 3 (6.3)D(
'_Pl=Kj~"JrsJ ~..:s~ d.s ·1-t'atJt/l)/,f=J
/
0 £;z:-F,)z. .s--::R .I c
which is ap~licable to homoatomio molecules only, and is prob~bly. more generally usetul than the kind of treatment of (6.3) given by Degard in the oase of carbon tetrachloride.
7.
a.
Substitution of a summation over discrete term.a for the integration over all values of s.In the radial distribution method of Pauling $nd
Brockway1 equation (7) is replaced by a sum, of whioh
eaoh term represents the part of the integral ove1· a
funotion. Although this prooedure was found to be
satisfactory, its use in calculating radial distribution
functions with visually estimated intensities did not
make clear the significance of the approximation
involved. This, the later wo1·lc of Degard has done .. Pegard carefully determined the relative molecular intensities as a function of s, and evaluated the
2
integral of the radial distribution funotion numerically • He tben showed that quite precisely the same result is given by the following sum, the terms of which are the same as those of the older formula except tor the
exponential faotor.
-ts)
DPJ=t;e~
i. J.1 ...
c.s.,
.§1., 2684, (1935).I
Here the k-th term olosely approximates the part of the integral between the sub-11m1te s~ and s;
'
the zeros of' the molecular intensity function ad jaoent
to the
Vlidth
ot
the teature 1n question.In
order to disoues the theoretical s1gn1f1ca.noeot
this result, to dis-cover its generalization for more complioated moleoules, Degard derived the mathematical expression for theintensity function
wnioh
exactly corresponds to the ~adi.al distribution function ( 8).. In the next para-graph Dr. Degard's treatment is reproduoed··w1th somesimplification of the mathematical d1soussion, and otb.er slight changes.
The theoretical intensity tunotion which is related to (8) is found by substituting for D'(~) in (?) its expression by equation (8):
,,;-/r;,-s/j~
. / /~
s,.e'..fr
e.'4
e-...e<./~
s.c_d' ?=.'Z
IK'ts.J( g)
I
f.s:,1 = _,..:r l J"' :a-,..P -5 - lo(0
where
"'°-~.fit,
9.
By the well known integral,
(
""
0o _rzif'"
m-
- J A4l
e~_B'xd2¢
= ;e*
e j fa.>o1
1 (SJ,
..., this becomes
is negligible tor the values of '" and s whioh are
ot
interest. Therefore,On multiplying (13) by
that the distribution of' intensity corresponding to (8)
is the same as the theoretical intensity function I(s) insofar as the reduced theoretical intensity function
(15 )
I
o=~
fcs.1=[d./L'oU/..~.s'_f
C .:S,) k I' 'I'S.) 0
oan be represented as a sum of Gaussian distributions:
(16)
It will be shown that this oan be done quite well by letting the
sK
be the a values of the maxima and min1.In.a at the reduced theoretical curve, and choosingthe b" and G ~ to correspond to their widths and
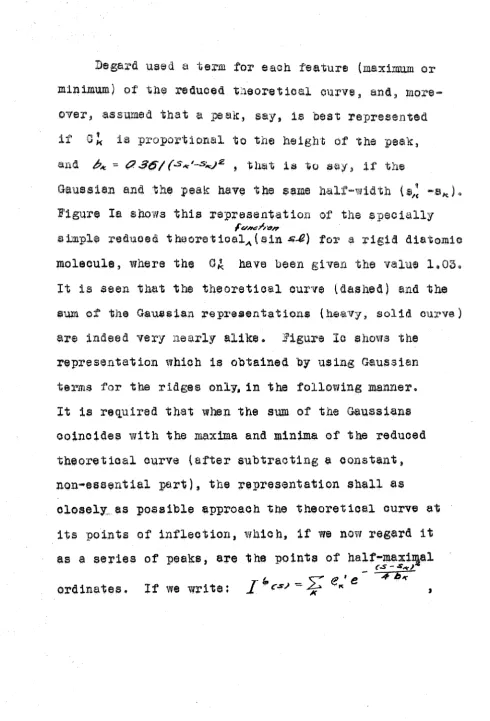
Degard used a term for each feature (maximum or
minimum) of the reduced theoretioal curve, and,
more-over, assumed that a :peak, eay, is 'pest represented
,,,
'
'"'K ional to the beigll't of the peak,
a11d bk.
=
CJ. 36/ (S"''-S,.,.)~ , that is to Se!.:;{, if theGaussian and the peak have the same halt-width {s,! ... sK) ..
Figure Ia shows this representation of the specially FvH.::1',.~h
simple reduced theoretioalA(sin s..B) for a rigid diatomic
molecule, where the o~ have been given the value
l.os.
It is seen that the theoretical ourve (dashed) and the sum ot the Gaussian representations {heavy, solid curve)
are indeed very nearly alike. Figure Ic shows the
representation whioh is obtained by using Gaussian
terms for the ridges only, in the following manner.
It is required that when the sum of the Gaussians ooinoides vvith the maxim.a and minima of the reduoed theoretieal ourve (after subtracting a constant,
non-essential part), tbe representation shall as
closely as possible approach the theoret1oal curve at
its points of inflection, which, if we now regard it
as a series of peaks, are the points of halt-maxi~al
c.s-&"")
ordinates. If we write:
I"
cs.J =~
e,.,.' e
-4and their best solution gives
fl1e' = 0 ;
'Xhe representation fails in that 1 t has a too sraall
ordinate at points corresponding to the inflections
ot the theoretical ourve. Gl:\.o1oes of bt< from 0Asr.s-,/-s1eJJ!.
to o.fiocs:-s,.,f· ere very nearly (within 2%} as good
as this optimum. For representations with both maxima
and i t seems 1·eason.able to demand that when the
sum of the Gaussian terms fits the reduced theoretical
curve at its maxim&, minima, and nodes, it should in
addition fit as closely as possible at the half-maximal
points of the ridges and valleys. The problem of find-ing the best value of bK turns out to be exactly the
same as before, and the result is formally the sarne;
one rn.ust only place the required i11te:r11Tetatio:r1 on the term "half-width." The representation obtained with
this clloioe o:t' bl!( is illustrated in Figure Ib, where :Lt should be noticed that a slight ohange ot scale
would aex;ve to show that this ohoioe of b" does give
l. In formulating these conditions it haa been assumed
that the Gaussian has a negligible value when its argument is equal to tour times its halt-width.
Al-thousn this assumption :is not preoisely t:rue, 1 t has
no appreciable effect on the determination of b~. The assumption nas not been made in plotting the
a better representation than that at Degard, although
the difference is probably not s fioant.
The p:raotioal problem represen~ing the reduced
d:l to Clisouss. r·t to remark
·that th.e ve1·~r good representation obtainatlle for the
simple sine function indicates that the SUl'.ll of Gaussian
ter:rna is probably suitable for representing the more
oo:mp11os:ted Fourier series also. Probably it is best
always to represent both :maxima and minima of the
Fourier series in the hope of obtaining :f'rom tne sum
of two fairly suitable representations one that is
somewhat better than either alone. Moreover, it seems
that relatively small values
ot
b*< should be taken,when the representation of both maxima and minima
used, in order to reduce the overlapping of adjacent
Gaussian terms, and consequently also the dependence
on their nioe oanoellation. For in the more oomplicated
oases it oannot be expected that this oancellat1on will
be as satisfactory as 1. t is in the example discussed
above. Asymmetric peaks, or peaks with "shelves" are
apeeittlly difficult. Generally ~ term with a emall
peak, and to the shelf can be taken to represent a
composite feature of the intensity function,.
In this section it has beeri proved ·that the
radial distribution function can be replaced
a S't..llll
(8) b is
equivalent
to it insofar as the reducedintensity
tunotion oan be represented by a su.m of Gaussian ternis
(16)
According
toequation
(16}
theooefficient
o~ of a ter.rn of the radial distribution function snould beproportional to the height ot the corresponding term
of the representation o:t the
x.·edueed
intensity :function,to ak and to the square root ot b~ • It may be inferred from the detailed treatment of the example
ot a rigid diatomic molecule that the best value of
bH 1s g1ven by t>K ~0.5'4 cs~-s"'lwhere <s.:--s .. > is the
halt-width of the k-th feature of the reduced int;ensi ty
curve.
Finally, 1 t can be seen from the form of the
reduoed intensity funotion (15) that tor a rigid
molecule {the distribution
net')
is discrete) 1 tand equations (8) and (16) follows the impor"tant
corollary that on the average the terms of' the radial distribution function (8) for a rigid molecule are
te:rnpe ; its
to t uee an only of ter:n:s
in the radial distribution sUDJIUation.
A:pplioation
ot
the results so tar obtained to observed diffraction data does not yield thoroughly satisfaotory radial distribution functions. Forexample, Degard found that even when oarefully
deter.mined intensities are used, the radial
distribu-tion function calculated for carbon tetrachloride in this way shows many relatively -weak, false maxima in
addi t1on to those oorrespond1ng to the a-Cl and Cl-Cl
distanoes in the molecule. Dr. Degard found that these
a~urious features oan be eliminated by using in the
radial distribution function instead of the t:rue
a. s"
in which a intensities I(s), quantities I{s) e
_..:z s
-is chosen so that
e
=
l/lO where s ... 1s the upper limit of the integration or su:m:mation~ The form of the-a..s•
expression e suggests the nrun.e "artificial
15
by j;J.st such a factor.. 'I1he artificial temperature
factor rapidly and progressively dec1~eases the b1portance
ot
the of the distribution function correspondings of s ; its action is that of
t a smooth compromise be the tl:leoretioal
demand parts
or
the radial distribution arisingfrom all values of s should on the be equa.lly
in1portant, and the practical necessity of giving s a. f1n1 te upper limit corresponding to the greatest observed.
angle of scattering~
'.Phe ett'eot ot the e.rtifioial temperature factor on tl1e significant peaks of the rad.'ie.l distribution function
oa.n be 1cipated from the ciroumst:ance mentioned in the
last paragraph--that this factor is of the same form as
the factor which occurs in the theoretical intensity
function tor a vibrating molecule. A distribution function involving the artificial temperature factor corresponds
to a model in ~vh1ch every 1nteratom1o distance is sub jeot
to the actual mean square variation in the molecule, plus that corresponding to the artificial temperature
_ ,
fac·tor,~
Le.,
f,,e;/=
.J4·+za
2• Consequently, if it is desiredl. When this is done, the terms col'responding to large s values beoome unimportant, and the extension of the
upper limit of variability of s to infinity, made in the derivation of the radial distribution formula, is
justified.
16
to determine the a.mpli tude of the moleouler vibrations
from the width
or
a peak of the radial distr1but1ont it is necessary to t a term
correspond-ific
1 ial tor
valid. if the arti:t'ic ial temperature :f'ac
chosen large enough so ttiat the real
d by
i O!J
has been
i1'1ojal
temperature f'aotors together render unimportant the
parts of the radial distribution function corresponding
to s > s,,,., which have been negleo d, it the
representing the distance in question is well separated
from its neighbors.
Degard has gi van a different, more detailed.
t1•eat-ment1 of this question based on an approximate evaluation
ot
the 1noomplete radial distribution function-(17)
I(s) has been given
thefo:mn,
(18)
ap:pl1oableto a non•rigid diatomic molecule, and suitable when an
artificial temperature factor is used. Degard1s 1ntegra~
tion is valid only tor (.-e'-:::.£'1 )-:::t...O, so that it can only
l. ~hesis, Chapter 8. Note that in this paragraph b
17.
give information about the near-maximal region of the
rn.a1n pe or D' (~}. Degard has calculated the half
th of this peak at thl'ee-gµp.rt§lr.-h!igh,t as a
tu.notion of and
of this :peak, as a funot ion of 11. &nd s..,,~ 'o 1s
large and very nearly independent of a for small values of ilm ; for larger values of' s,,., , b decreases rapidly,
and asymtotioally approaches the value a.. .And the
the value of a, the smeller is the value
ot
s,.,.,for
b~a. UnfortunatelyDegard's curves seem
to be aub ject to err·or, for certain theore·tical re lat ions among them are not precisely satisfied.
For the case when s,.,._-.;i..oc::» the value
or
the integralis exactly known and the resulting function1 is at importance
here, and is
or
great interest 1n connection with thetheory of the temperature effect inasmuch as it gives :i;irecisely t.he error incurred in omitting the highex- order
terms ot that theor1, and suggests a oorreotion which is
almost exact. However, this correction will not be dis-cussed in this thesis,
The substitution of (lB) in (19) gives
18 ..
whioh, s rn ~ - - ' is found to
(20)
( is the
distribution of scattering matter oorresponding to
(18), with essentially the norm ( £PCP/d7f
=' }
andthe half-width
{tu;-:::::.
a, in formulating (18)'the faeto:r
__.ea
being unimportant in these respects .. This tor is effective, however, in that it shiftsthe peak ot the radial distribution function so that
the art1r1c ial temperatu1·e facto1· gives
rise to error, which, however, may be eliminated by
taking, as the interatomio distances given by the radial
distributio:n method, the peaks
ot_t?flKe/=LJCP,/Lf'
rather than those
ot
D(---f) • The :re&l temperature :factorcorresponding to the actual intensities, differs from _aslt
It seemed desirable for the present thesis to
supplement Degard's discussion of the effect of a
tini te s,.,, , and of the temperature faotor, with the
furtller oonside ions. It is impossible,
been ioa , ·to a simple
expres-sion of' the 111neomplete11 radial distri'bution ion
for the oase wllen I ( s) ino ludes a temperature :f'aotor.
IIO\"leve:r:, for our :purposes, /-1'-z ~ c.s oan be made to
-CL.Sa,
be a sufficiently good approximation
ot
e , as isillustrated by Figure II. We shall investigate the
nature of the radial distribution function for a.
diatomic molecule when o is given various values.
For the comparison of tbe results of this investigation
with the corresponding radial distribution functions
involving the
oorreet form of the temperature factor,
_a..s"" it is necessary to find what value of a makes e./+~cs
and ;e most nearly the same for O ~ s :!, s,.... •
In
Figurfa IIwhere
a =-0.28 o2, {b -=-0.0l; o =-0.169),the two for.ms of the temperature faotor have been made
to have the value
t
tor the same value of s. Thisrelation
of o to a is seen to give a goodrepresents-tion of the true temperature factor over the range
- ... s ..
I>,. e
..
For the range / >.- e ? c!J. tbetter average representation is obtained if
' a
2
20 •
.i:\.nd it 1 t is desired to obtain a representation over a still larger range of the temperature factor, a must
be given a larger value st 1
theoretical radial distribution funct for a dititomio having the temperature factor discussed in the las·t paragraph can be set u:p and
evaluated straightforwardly. We have
, and hence,
(23)
In
order that this function shall correspond to integration over a definite num.ber of maxima and minim.a of the reduced intensity function, we $et(24) • Then,
21~
On making the t'ollo·vving subst 1 tut ions
simplifying,
as
:ror a d1atom1o molecule and the a p:proxi:ma te temper el ture factor I+ CO$C'$'
2 This result represents n features
(maxima and minima being counted separately} of the
reduoed intensity curve. In the absence of a temperature
factor (o=O), (27) beootiies muoh simpler:
>t
( 28) /)(€/ ::; :.l(-J) ~ •
..f''L
:O(..t)
=
..l2D'{.€) has been evaluated for n=5, 10,
and
:ao
and C = O,l/n,
and, for n=
10~ 0.8/n. Theresults are plotted to an arbitrary saale in Figure III
~
where the convenient notation D'/ (-€} has been adopted
to represent D( L ) for n
=
x and O=
y. It should be noted that C=
O corresponds to a unit temperature faotor;O
=
o.a/n:t
to a factor equal to O.l when s - s_ ; and0 - l/n, to an approximate faotor equal to
zero
when'"" em • The last ease is the extreme li:m.1 t
ot
the-a.s•
usefulness of the a:p:proximation of e by 1 +coses
2
22.
which has only a very small value ( 0 .. 03) \Vhen
J .. part of the peak of Dt( .L
L
andot
.ID'( ,f ), tor each choioe n and Cl is also shown in Figure IIL Bi.nee the height of the main peek1
D { .f ) is pro port 1ona 1
by dividing by
n,
1 t ton, and this has been done~
These theoretioal curves are of interest in
oon-neotion w:tth radial distribution functions in general, because for any moleoule the distribution function may be regarded as a superposition of several curves of this· type. radial distribution funotion will be
satis-factory if each of the component parts has the form of a peak with level plains at either side, and if the various peaks are not too closely s:paoed to be well
resolved. luid tllis will be true also in the oaee where
the radial distribution function is calculated as the sum
ot
several 1',ourier tern~s, with suitable eoeftia 1ents,if the conditions necessary tor this approximation, as
discussed in section ~2, have been satisfied.
'rhe features of the curves, of Figure III, which
appear to be specially important will now be discussed. 'l'hose obtained w1 thout a temperature factor are seen to
l. This is easily seen, from (28) for instance, by
evc1l~ating the indeterminant expression D' (t== l)
have a oentral important peak and ne igh'boring lesser
peaks which are progressively smaller, the further they
are the main peak. :L1he nodes are equally spaoed except at tlle main peak, which, its nodes,
is twice a.s Vii de
es
the other features.ions D9,, (.t) i1 have main as
as those for which C 0, while ·the
ot
the curvethe L very closely, the corresponding minor features of' the f'irst curves having almost entirely
disappeared. The function ( -t ) has a somewhat
""'""''""' ... ,,..""""' value, while ·the spu1·ious features ni:rve
become negligible for it also1• This is the desired
effect, for the superfluous features ot the radial
distribution function 1n the praotical case, when no
temperature factor is employed, are very confusing and
render its interpretation very difficult. It may be
well to remark that probably any other function which
suitably reduces to very small importance parts of the
radial distribution SUlll or integral corresponding to the
outer rings of the d iff'raotion photograph, would serve
the same purpose e.s the artit'ioial temperature factor.
It may also be worthw11e to mention ag81n tnat the
artificial and real temperature taotors act iu exactly
l. Perhaps a less drastic factor still would serve.
How-ever, th.is one, chosen to have the value 1/10 for s =Sm,
according to the suggestion of Degard, is seen to be sat1sfaotory, and is perhaps &s setisfaotory as any
the same way, so that as t real temperature factor
beoomes more important, the artificial te11perature
become less so,,
width of the peak of' the redial distribution
function is of i:nte , tor 1't de the resolution Whicll :l.t is :possible to obtain when several of the
silnple curves (for different
1'
~s} are added together 1n the praot1oa1 case. 'l'he half-widths at the :pee.ksot
the curves ot Figure I I I ere found to be 0.6/ntor
C ; O; 1.0/n ·_f' for C -=l/n; and, presumably,.o.e/n
·.£.'for
o
o.a/n.
l 'l'hat these reaults for thecases C
=
l/n and C = O. 8/n are in agreement with thegeneral statements concerning the width of a radial
distribution peak given earlier in this section ( B16),
oan be seen :trom the following table which gives the
balf-wid th of the peak of the radial distribution ourve, the
value of a (a=
o.
30 o2 } corresponding to C, and thehalf-width
ot
the distributionor
scattering matteroor--a~2 G.'A~
respondinig to the temperat1lre factor e ( .cij = 2a;
for a, Gaussian distribution
X~
=
1.1?6ff. ) ·
l.. Tl:l.e generalization tor C ""0.6/n is justified by the
apparent circumstanoe that the various curves tor a given value of C (e.g. l/n) are the same with regard to general appearance and width of the peak exoept tor the scale of (L-l). That is, they are similar
Observed Half-width
oal-Ourve half-width a culated. from a
$'
D9:s ·O 0 018 0.193
'"
D~ .. 0 .. 10 0.,003 0 .. 091
n""
'124 "o ..
0 .. 046D'" 9-11/" 0 06
o.
0~0For general radial distribution functions the value
ot
n to be used in estimating the expeoted half•widthot
a particular peak is tlle nu.mber ot maxima and minima of the corresponding component of the r~duoed intensity :f'unction virnioh lie between the origin and a"' • It is convenient to state the above results in another formtor :praotioal use. This is easily done by noting that
(29)
,
Swr..fln,·
=7( and making use of the definition
ot
a,
(26). The results are given in the following table.Theoretical Half•widths of Peaks of the Inoom:plete Radial Distribution Function with a Temperature Factor
c 1'em:perature Factor Half-width
{corresponding}
0 l l 1.9/sm
8.51/am
O.l O.l 2.5/smTwo peaks of equal height may be expected to be well resolved 1f their separation be greater than three times the ave:rage half-'ivid·th; or, resolved, but shif·ted
eaoh other it' their separation be twice
their width. 1c·t o:r "'Gb1s table
are in general agreement with experience tor radial
distribution curves oaloulated by the modified method described in seotion
o.
This is true with regard tothe magnitudes of halt-widths as well as their equality
tor all the well resolved peaks, having like real
temperature factors, of any on.e redial distribution
function.
Finally we direct our attention to the positions of the maxima of the curves of Figure III. It is seen that in general the maxima of D(..l) ooour tor L slightly greater than the theoretical value of unity, while the m~xima of D'(..i) occur when L is slightly less than one,
and those of _,f
nt
(1 ) are at t=
l. That this should be true is evident from the fo:rm of ( 2?) toro:::
O, andby (21), tor any ohoice of the usual temperature factor, also if em be large enough. From (2?) it is evident
27.
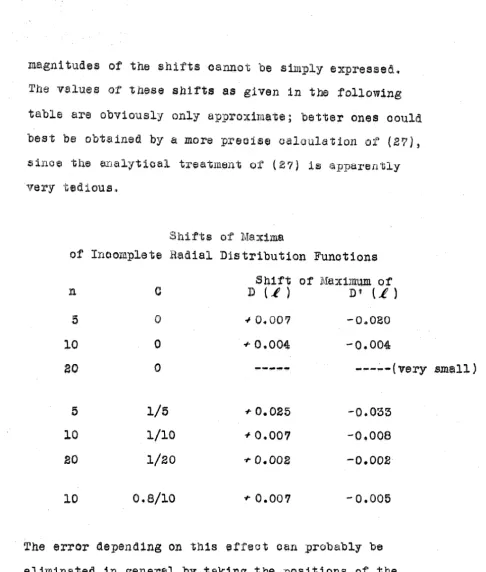
megni tudes of the shifts cannot be s1luply expressed. The values of these slli:tts as given in the following
table are obviously only approximate; better ones could
best be obtained by a more precise oaloulation { 27),
:iinoe the analytical t;reatmer1.t of ( 27} 1s eLJ;pa:r·ently
very tedious.
Shifts of Ma x:tm.e.
of Inoo:mplete Radial Distribution Functions
Bb.1:f't ot IVrax1mum ot
n
c
D (.f ) D' (.f )5 0 -I
o ..
007-o.oao
lO 0 + 0.004 -0.004
20 0
___
...
---~-(very small)5 1/5
.,. o.
025 -0.033lO l/10 + 0.007 -0.006
ao
l/20 ..,. 0.002 -0.00210
o.a/10
.,. 0. 00 7 -0.006The error depending on lh1s etfect can probably be
eliminated in general by taking the positions of the
maxima of ..ID' (..i' } instead of those of either D ( .t }
or D t {..I } .. In general, it mJ'.J.y be e::cpeoted that these
l!lhifts may vary from about a per cent tor n
=
6, to about a tenth of e. per cent for n = 20, and to have the signB. Applications
method of Pauling Brockway; the i tion ·to a modified metb.od.
The redial distribution fo1'T:1ula as derived by
was simplified by them to the
ct io al use as er! aj.d in the
determina'tion of molecular structures of gas moleoules
by electron diffraction.
(
D /. , -
\ I
9i1tSt-€f1J -
L
·J.s
..1-/( .,.. 'k. '
Here Ik is the visually estimated 1ntensi t~r of the h
ring the electron d1fi'raot1on pho1'ograph, and. the
other symbols are already familiar. This function has
been applied in the study or many moleaulee and has enjoyed success, especially
ror
molecules with veryfew, and well separated, intaratomic distances. #hen
these conditions are met, the function yieids curves
whose maxima oocur at values of
1
in good agreement with those obtained by the visual method of interpreta ....tion. There are slight disarepenoies among the inter ...
atom::Lo distances found by (30), however, and it will be attempted to discuss tbese later. But great
dif-f j cul ty is met wl1e1n the molecule under consideration
involves a considerable number of significant interatomio
distances, 1'or the peaks ob·tained from {.30) are
excessively broad, and consequently the 11reso1v1ng
is poor.
of this
a suggestion ial
die-tri'bution me·t could be
treatlllent of the ooetf'ioients of the s1n sk..I terms
of the sum of equation (30)
distr"ibution functions calculated trom the observed
posi·tions and visually estimated intensities of the
of electron diffraction photographs of thiophene
by an expression similar to (3D) in which the aoef•
fiaients ot (~O) have been replaced by lks -1s
~ ~ +
Ik , Iks , lks , !ks , Ika , in A, B, 0) D,
E~and F,
respectively. Inasmuch as the data are reported in
part two ot th1s thesis 1t will be unneoessery to give
them here also. The interatomio distances in thiophene,
as finally determined jointly by the visual and radial
distribution :methods, are indicated by arrows the lengths
ot
whioh are proportional to the number and atom1o-numberproduot of the corresponding interatomio distances. It
is seen that e.s inorea.sing weight is given to the outer
rings, by inoreasing the exponent of sk in the
30
There appear several significant pealts which are
either poorly resolved, or not resolved at all, in
the first tnree curves, and these ooi-respond well
with corr·espo:nd ing inte:rerto:mio dis oes. It is
e ly s ·that "Che posi·tion~ the
greater peed:(S are ted only slightly by
ve.rying the treati:nent of' the ooettioients. This is
important in that it shows how the neoessarily large
uncert~int1es of the trend or scale of visually
estimated intensities oannot give rise to great
errors in the determination of interatomio distance
by the redial distribution method, and how both the older method and the modified m.ethod presented here can give good :results. It is also to be notioed that
in E and F there ere many more maxima than in , B, and
o,
and that someor
these new peaks appear to haveno physical signifioanoe.
A similar set of radial distribution functions
was calculated from the data tor benzene with exaotly
similar results. The peak oorresponding to tbe distance
between carbon atoms at opposite aides of the benzene
ring e,ppea.rs at the oorreo t plaoe al though 1 t was
2. :t'he ified Visual Radial Distribution
Method~
on visual estimates ot intensities,
for various molecules, made by workers in this
labor-t correct simplified t t al eu1·ves
these :rm.;;ileoule~, indicates t t the visual inten::ii
is approximately proportional to (l/s) times the
simplified" theoretioal intensity, or (s ) times the
theoret:Loal intensity. It was therefore suggested that
the
visual
radi&l distribution function should begiven
t form
L
~ N. fl(31)
Dt.t)=
L~~e-a,,s,.:;,,.,,;s,)
where I(s}'*"'
Jin { 7) has been replaoed by Ik<wl>·J ( s )/s;:;, the factor 12<sJ
has been left out, the integral has been replaced by a
summation as in the older method, Degard's artificial
temperature factor, in whioh it is customary to choose
-as2
a suoh that e ,..,
=
1/10, has been :1.nserted, and thesUllllllat1on extends over all the peaks of the observed
1ntens1 ty ou1·ve e:x:oept that ~'b e .-:. 0, the terms cor-responding to the first two features of the reduced
theoretioal ourve being thus omitted.
Curves calculated by equation (31) are found to
"
and in the similar oaloula. t ions for benzene. Moreover
the prominence of tl:1e spurious maxima charaoteristio
E and F 1s in general greatly reduced as a result
of the action the artifio ,temperature tor~
of' s t.besis aeve ere given 1
I1hrough the efforts of fri
s o:f' ( 31)
111 t s
, for whose special assistance in this regard
the imthor is most grateful, 1 the new func"!lion has been
tested for many othe1~ molecules of di verse types, and
has been found to be :powe:t•ful and generally reliable.
It has become especially evid.ent that even rnhen the
function is not completely satisfactory, in that the
interatomio distar:.ces obtained are not entirely
compatible with a reasonable molecular model, it is
nevertheless true that this s't of interatomic distances,
together with suitable we1 gh·t faotors, does often lead
to a simplif'ied theoretical curve in complete agreement
w1 th the appearance of tlle original data, so that the radial distribution method leads to a solution of the
problem which, if not the correct solution, is at least
indl.st1.ngu1shable from 1 t on the grounds of' the electron
ditfraotion data alone. There persists some difficulty
about spurious maxima. These often can be recognized
al though perhaps :rela ·t 1 vely prominent to the eye,
have a maximum value of D' (
.P )
flpproximatelyzero. tive values of' D'{j?) probably arise from the omission of the f'irst terms of' the
function (and are hence ). while spurious
al"e to
imperfeotions of t function. discus,sion
the modified method 1s given section 05d.
3 The modified radial distribution method
discussed in the last section is related to tl1e general
theoretioal radial distribution function by a series
of app:i::·oximations, some of which have been justified in the theory given in part B, While others must now be disoussed s:peoial1y. To the first elass belong the substitution of summation for integration, and the use
of an only finite number of terms. To the second class
.J
belong the omission of the factor .fat:» , the omission
ot the part of the integral or summ.ation corresponding
to the first terms o:f' the reduced 1ntensi ty function,
-b1e.t ...
the omission of the factors e demanded by the theory for the substitution ot a surritllation for
integra-tion, the interpretation of D' (.I ), rather than D ( R ) ,
as giving the importance and values of the 1nteratom1c
distances,
artificial
the effect of these things and of the
ternperature factor on the positions of the
discussed
of intemsi
t omitt
the su:mrnation; the
f noted
ta,
the first terms J.
first features of the reduced theoretical curve is ne
1.
equivalent to the omission of f'!lfs) For, as is illustrated by figure Tf, this taotor is nearly constant except small values of s, for which it becomes
very large, approaching infinity as s approaches zero ..
Consequently the first terms of the radial distribution
function, which, ·..vi th the factor, are severally of
a:p-:pro:xim.ately the same importance as each of the other ter:rus, ·become wi.thout it entirely negligible. 1.I1he se
parts ot tl1e radial distr1but1on function are essentially
:positive for the range of values of ..R. which are of
interest, so that a function from which they have been
omitted will be depreaaed in this region and will show
negative values of D • ( f ) . Professor Pauling nas pointed
out that such a radial distribution function, in which
the a.tom form factors have not been considered, is a
representation of the actual distribution of scattering
matter the molecule, the electrons having a negative
35.
l
of Degard are in agr.eement with these general
statements. found that radial distribution functions
for oarbon teti'aohlor1de and bromine calculated from
accurately measured intensities according to the methods
ocutlin.ed abOil6 a.re eYerywhere essentially posltiVe if the tor is 1naluded1 but have a ctable minima
ad jecent ~to the peaks i:f 1 t is disregarded Perhe:pe
t l:le of' the moa1f1ed rallial Cl1str1but1on functions
are partly due to this situation.
J
Since the function /'llfSJ is not :really constant
beyond a 'l:lfi' 5, nor is the part of radial distribution
function from small va1ues ot s independent of
,f ,
it is desirable to consider these points in greaterdetail, even if it is not possible to demonstrate
oon-olusively that radial distribution functions constructed
from visually observed data have anything to do with
them. While a suggestion regarding the treatment of
J
the lesser variability of
.F,
(S){
s>
5) is made in thela.st section of this discussion, we cannot expect that
'the estimates of intensity, as they are now made, can
be
as
oonsistent with regard to scale, over a large rangeof $, as would be necessary to make a consideration of
J.
fa<SJ ,
in this region significant. An attempt to estimate the etfeot on positions of peaks of omitting the firstterme of tb.e radial distribution function is given in 030.
b ..
2 -6..f2
The f'a:o tor , /
e
..
The modified radial distribution :runction
described in section 2 :m.ust ao
'
to ·the theory,be d ed by the
be e cted to
a:reas correspond to the probability{ multiplied by
the product of the atomic numbers) of finding in the
molecule two atoms a distance
1
a:part. In theap-plications to molecules, using visually estimated intensities, 'both these :rectors have always been
neglected, and indeed 1 t has always been assumed that
D' { .f} is the function of :physical interest. We shall
see, however, that these co+reotions are sign.if:toant.
It turns out thet the physically insignificant peaks of the distribution functions which ooour tor both
relatively small and relatively large values ot
_I
axeellln.inated by these corrections, and do not arise from inherent errors of the radial distribution method. (These
pe~ks are already oonsiderably weakened in the transition
trom the old to tbe modified method).
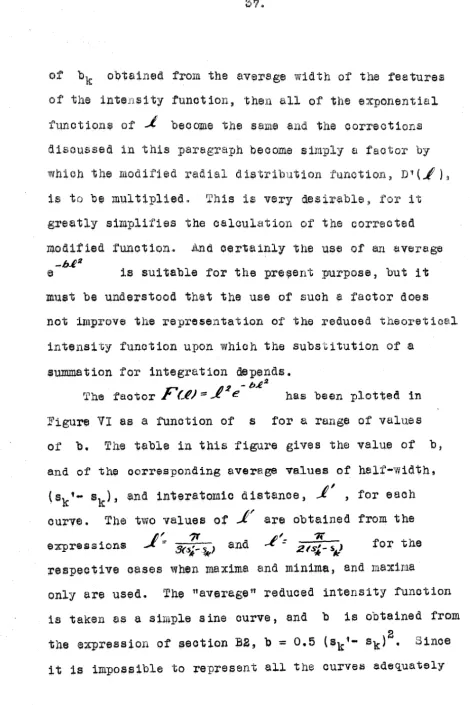
If it is assumed that even when the features of the intensity tunction are not all ot the same half-width,
of obtained from the average width of the features
of the inte.nsi ty function, then all of the exponential
functions at
1
become the same and the correctionsdiscussed in this paragraph beoome s.~,••J•.1 a fao by
whioh the distribution ' D1(..f)
is to be multiplied~ This is very desirable it
greatly simplifies the ealaulation the corrected
modified function~ And certainly the use of an average
ia suitable for the pre~ent :purpose, but it
must be understood th~t the use of such a factor does
not i1uprove the representation of ·the reduoed theox·etioa:L intens1·ty function upon which the substitution of a
sUll'.IID.8tion for integration depends.
/)2 - b.itl.
The faotor Ff.P) ""..x e has been plotted in Figu:re VI as a function of s f'or a range of values
01· 'b. The table in this :figu.re gives the value ot b,
and of the oorresponding average values
ot
half-width,(sk'~
sk), and 1nteratom1o distance,-1
1
, for eaoh
curve. The two values of
.1'
are obtained from the..J
i:. 71'1'-
7(express ions - S<<S,f-.&,> and - 2
ts;,-
sJ
for the respective oases when maxima and minima, and maximaonly are used. The "average" reduced intensity function
is taken as a sim.ple sine curve, and b is obtained from
2
the expression of section B2, b
=
0.5 (sk'- sk) • Since:38.
on the same scale it is well to note that they are
inter-related simply:
..
,
It is easily ~ t t ch
ie :t'elate t::-1 the ters b,
(a~'- ) and
..t'
by the following expression:(33)
_fm
= -J=
t.4
={ 0.9.f'
(maxima only)~
(S' - :,• )1.35..t'
(maxima and minima).k A:
With the help of Figure VI, and the eoove auxiliary
expressions, it is now easy either to correct the modified radial distribution funatio:n before plotting
it, or to estimate the relative importance of its peaks if it is plotted without oorreotion. Obviously
the uncertainty in the semi ... quantitative for that reason.
o. Shifts of peaks
or
the radial distributionfunction.
It is evident that the corrections disoussed
under the last two headings imply that the peaks o:f'
D'(L} will not in general give the oorrect 1nteratom1o
distances, but will be shifted somewhat instead. In this section an attempt ia made to estimate the shift
quantitatively, and it is found that the shifts are
39
the widths the peaks of the radial dis tri.but ion ourve. Generally, the effect is eomewhat, to spread
apart the of' D (
l ) .
1I1lle predicted shi s are
too to be oonfirmed, exoe rh tatively,
1 dis ions oaloule d tne rnod if'ied
method from :reasonably complete date.$ func·tions
oaloula ted by the older method shov1 greater e:r1•ore,
an effort is :made to test the 1predictions 011 them. r11he
application of the theory to the results of the older
method is reasonable, because the older method corresponds,
at least roughly, to the use of a vary drastic tem},iera ture
factor. A peak of the theoretical R.D. function for
an interatomio distance having a Gaussian distribution.
about a mean f,· , with half-width Wl is gi van by (~ -..£.·)2
) D ')
-
L.41-W2( 34 lf-1!. =
e
and peaks of n1ncomplete" radial distribution functions
are of this form also, if the temperature factor be suf-ficiently im:po1·tant. We assume, therefore, that in
general it is suitable to represent the peaks of a
radial distribution function, D(..t), by (34), and if
a peak hes not the ideal form an attempt is made to
choose W1 so that the top of the :peak is well represented.
If W; is reasonably. small, the peaks of the modified
form and width as ·n1ose ot' D; (.,/, ) , and W may be
determined directly rrom them. now write
(.€--1,·Ja
Le -
1..44-wfl~pt: -h-€JL
to the detini tion of
' ( .i )
and ·theforegoing discussions, p must equal
2
in order that the various :peaks of DJn ( ~ ) as defined by ( 35} s)lallhave the same relative importa.noe as 1n D'm(.l) as
actually oalculated by (31). On the other hand, according
to section B3, p : l ; , i t 1 't is des1:red that the m (
L }
oaloulated from {35) and
(3l)
give the same interatomic distances.Now i f the peu1cs of D(.l ) are well resolved, the
position of the 1nax1mum of any one can be obtained while
the others are ignored. Accordingly, we consider
(L --1.;J'
e
.1.#w"'...fp e-11.t2
< 36)
D'
me .<£J = for whichb.la- U--liJa.
~n' IL') J.Hw..,, { -<,o-1J ,,,,,_ "' .. ·• -p -Ip"'']
( r:t 7) Cl!' Vwt/ =
e
2b JI , '7 r.c..c.""
A , IJ"" d..JZ ..x. - ;/(. 1.'41/ wa A , -
p
..£( 3?
l
has zeros at _/-::; o , _.,l;:,: L.t" ,t
:= ao • The41.
p+L
when multiplied by ....f. and expressed as t1o ( .£-.£« ). Sinoe the roots of this
quadrat ion are widely separated in absolute
approximate solution,
-
-is auf:C1c:!.ently accurate. {For cases of :Ln terest, the
last express ion of ( ..i--L1 ) may be in error by 10~~. max
In the following table are given the celoulatea errors tor the radial distribution functions for a number of
l
molecules calculated by Pauling and Brockway a.ocording to their method, together with the observed errors {based
on the structures) determined by the visual method. b has
been estimated from Figure VI ("maxima only") and a
weighted average distance
...f' ,
whilew
is estimated from the radial distribution curves. That it has beennecessary to choose p 2 (instead of l) to obtain the
following remar~able agreement is difficult to explain,
except as evidence for the very rough character of this
discussion. r~olecules having only one interatomic distance
have been omitted.
M. -
x
- .A vmax.
Molecule ,£' b .&V
J;
Mcalc., Mebs. tP
fo
~4...alc., Al'abs.CF 1 .. 9 .35 .. 28 L.3.35 - .. 031 -.015 ., [email protected] +.010
4 ~4'
CiF 2.0 .. JO .26 1.5.27 -.019 -.017 ?'"' .-. + +.0.30
.., 4 ""'"'' "'•
cc1
4
2 .. 5 .. 20 .25 1.74 -.020 -.020 .20r,
.+,Oll -.,010
,~,.,
SnC11 2.7 .. 16 I 1.963 -.OM. -.!'l53 -.016
•"+
....
Gec1
4
2.5 .. 20 .3 2 .. 070 - .. 009 -~033 •.J -:i J.3135 -.055 Snc14 2*7 .. 16 .27 2 .. 2:;15 -.007 +.006
.
.,) 'J 3.76 +.030 +.015PF~ l .. S .. ~.O .. 22 1 .. 47 -.006 -~050 .22 ;::. " +. +.040
_,
PC~ 2.4 .. 22 .22 l .. 9B - .. 005 -.,040 • .3 3.08 +,,044 - .. 010
ff:>.
AsC1
3 2.4 • .22 .31 2 .. 13 0 -.050 .37 3 +" +.070
N
(H2)
cc1,,,
2.3 .24 .24 (L 73) -.013 - .. 040.
21;:: _, .c. .. ,..., + • +.015...
(H)
cc1
3 2.5 .20 .16 (l..77) -,,000 - .. 010 .31 .2$9Jl + +.001
ClriO 2 .. 1 .27 .27 l.65 -.016 -.006 '") + +.004
• .;:.,,,
43.
part of the radial distribution function
on the first features or
:maximura and 111int?m.uu) of the reduced intensity function is t form - - - - or· - - - - - the
t·No cases men l;ion<;;id, i ~s maxi.111U111 be igJ:rt vary1ug fI'Oill
2/n - 4./n times ·~he height main peal:u:1 o1' tlle
distribution function, according to the importance of
te1nperature :factor. Omission of this term will
lead ta a spreading apart of the peaks of muah the same
nature as that discussed in the last pa.ragraphs. 2.'he
shifts due to this eause will deareas~ with increasing
sm for t·flo reasons-... the narrowing the peaks and the deoreasing relative importance of the omitted terms.
It does
not
seem worthwhile to give a quantitati've dis-cussion of this effeot: the last example illustrates the approximate magnitude of this one also, and suggestshow either oan be discussed.
4. Disoussion and Suggested further :£',Iodifioations.
The study of the radial distribution function for use with visually observed data is not complete. In
order to gain a thoroughly satisfactory understanding
accuraoy of the representation the reduced intensity
f'unction, h is neoessary, o:r obtainable, for the
various si ions arise. eff'ioaoy of
-tl.e-<'.e
choosing the appropriate values of e :t'or
dif'-terrns the ion should be investigated,
as 1s speoi:f'ioally dem.anded by the theory given
this id done the explicit form the
coett101ents, given in B2, should be tollowed, and it
would perhaps be well to include in the radial
distribu-tion funcdistribu-tion, terms tor the first maximum and minimum
of the reduced internsi ty function Of ooui·.s, good
measu1·em.ents of these features cannot -i:ie had but they
have to be known only so approximately that this n.eed not oause trouble.
Two suggestions which certainly are of pr~otical
importance
oen
be made. First, it has been found useful in the few examples which have been tried, some of whiohare included in Part II, to 1nolude terms for both maxima and minima according to the suggestion of
Dr. Simon Bauer. Although it is somewhat difficult to estimate the negative ooeffioients for these terms,
and i.t is possibly true that visual measurements o:f t1minim:an are not as reliable as visual measurements of maxima, these terms do make a reliable and sometimes
function,
spurious pe
snould therefore be usea. Often the
of the function f'rom the m.inima tend
to oancel those of the maxima. great difficulty
in the visual estimation of intensities is in
estab-trend. s can be
avoided by arbitrarily fixing tihe scale of the n1nte:as
estimates in suoh a. way that on the average they are oonstant--they are to represent the a.mpl1 tude of the
reduoed theoretioal intensity function for a rigid
moleoule. By thus estimating the aoeffioients of ·the
reduced intensity function the J factor is
nioely provided for, while the average real temperature
faotor for the moleeule is reduced to unity, so that
differences among the real temperature tactore
oor-respond ing to the several interatomio distances will
be left unchanged. ·1v1th these intensity estimates the ooetfioiente beoome
(40) where
is the usual artifioial temperature factor.
It may be expected that the re.dial distribution
method which has been described is as reliable as the
visual :method (and much :more reliable and powerful than
oases in ~ radial distribution fur1otion from
visually observed data must always be inferior.. Suoh
are tne examples wr1are many of' the i:rnpor·ta.nt features of the intensity !'unction are for some reason unsuited
to quent ive ·treatment. i.f'hese t'ee:tures can be
avoided, as such, in the visual method of in~erpretation,
but in t
equally
radial distribution method. they must be used
the rest of the de.ta. Perhaps the re.sul ts
of the visual radial distribution method r:.aust still be
regarded with awe and :f'aith, even though the theoretical
expressions t11e halt-width (der1ved 1n ) indioe,.te
the expected resolution; the curves of Figure VI help
to tell whether a peak at a. relatively small or relatively
large value of
-i.
is significant, and the work of Degerdhas provided a clear just1f1oation for the in·trepid
,] ~J
t '
vaJ:uet:J
:t\:mction :forrmilated orif;inally :for single bond-double bond resommce of the carbon-carbon bond (l ). '.!!here a:r;a giilen in this section the results of the determination
conclusions regardine thfili:r electronic str'llct'\U'es :reached 1:Jy application o:i' the bond t;ype - intera.to.mic distance f'llJlCtion. In addition, beca:r.ise o:f the 1.mprov~er.tt 1n electron d1i'!ract1on technique since tr ... e st~ of benzene in ·these Laboratories four years a.go (2) and because of its similarity ·~o pyridine and pyrazine, this substance mw re-investigated.
~!·~a~Ps!·- T'he diffraction photographs were prepared with the apparatus and technique described by :Brockwa\V (3). Ten or roox-e photogrEJqJhB
were made :for each substance. the electron wave length used be~.ng about
m~whri.ng ootipariao:n m:ioh Y.i.1rup1ifi.ed the or et ioal intensity tlW''Vtlll
fer the models 1.tlider iiscusuion.
'bt::n2ene and. :t'ejec'ting the :first and la.st portions. A similar trea:tment was gi.ven to pyridine (Xahlba~), p;r:rrole (East1aar.1.),. and thiophene (Ea.strran).
Tlith gra.n.·ulated zinc and :rediatilling the prodi.i.ct several ·times. Oyclo-ptm.taaie:ne was :prepared by d.istillL~ dicyolopentadiene; in order that
di:ff:raotion photographs wez·e made i:rrmediately after the distillatii.in (within one hc1"Ul'). F-1..xra:n was :prepared by the deca:rboJS\)"lat ion of' :t'woic acid a:od purified by :fractional distillation. A saiqple of py:razinfl kindly given us
'by Pro:f'as~wr F.
w.
:Bergstrom was used without :fu:rthe:r 9~r •.ficatio:~.}.!..ep~~~1...llr .. idlp.f!.t.-~
ll.fM..!11...!·-
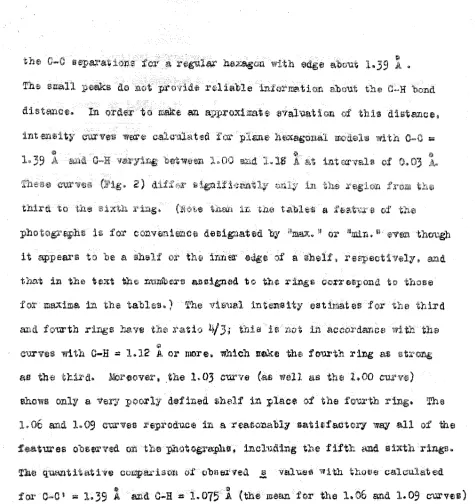
New photographs of banzen.e were obtained showing four more mea.au.:rable ::ri:ngs than those used in the ea:dier investi-gatio.n in the1.ui La.baratori~m. The radial diotribution C'\l.l'Ve oalc'Ula.ted'ffith. the o and s
-
-
values of Table I (Fig. 1) shows three principal peeks,0 0 0 Q Q
the
o:f the
designated by
it to be a or in:ner and
ma:tima Vil'Ual
and f ow th ri:Dgs have 4/3;
0
C-H = 1.12 A or more. which :u:eke the :fourth riDg as as the .the 1*03 cwve (as well as the
shows only a :poorly de:f ined shelf in place The
the
0
0-H
=
075
A (the mean 1.06 and 09 Ci.U'ves) Table I, leads to1lll
• 39} 0.02 A
0
0-li = l. OS .:!: O. 04 A •
Wierl (4) a.nd Pai.tl:i.ng and :B:rockwa¥ (2)
0
C-0 = l .. 39 A in (5)
c-c •
4o
.±
0.01value is in error.
pyridine {Fig. 1)
311Cl C-l:I
=
08 P.<fl
dis·ta;nca L3.g5 0.01 A. The cc1u;pa;rison mt'.h t!rn ..! val·uea a
,,
l"eg'.:ilax· hexagonal :model leads to the aam:;,i "la1'1e 1.365 A :f ru· the a"'n.,:cage ring ·bond distance-. It seams Utl.l:Ucely that. the C-C di-eita:nce diffa.t•.a
Ill
£':.~ma 1.39 A, and the :re:c:u.l:t!I acco:t·d.:Uigly t:ruggesc ·that the C·-~a :Ohtan;:;~:;i !I
about 1. 37
..±
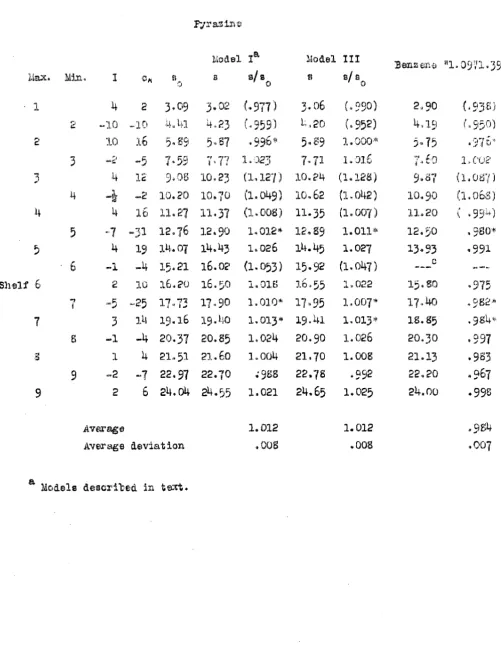
O" 1)2 A.The principal peaks on ·the radial di~1trib'11tio.n C'\ll'Ve fo1· py:t'azi.l'Hl (Fig. 1) li~ at :1..36, 2.37 (
""'1}.
i.37), and 2.76 ( .. 2 • i.3e) ~.~ <ll
Intensity C1ll'Yas :fc:.· mod.el !, wj:th 0-0 = 1 .. 39 A , C-N
=
1.33 A , C-H =•
1:.09 A , and all ring angles 120"',, and fox· 1oodel II, with the same bt1nd
malcing the meta distances eql:lal • are shown in JJ'igure 3. These C'Ul'"Tes,
as well a.a the benzene c:iirve (nipresenting a regular r1e:xagona1 model),
agree qiialitat:l:veljr with the photographs. The qu.a.ut.itative corapa1·ison :for
'Cl
all th:ree lead.a ·to ·the value lv366
.±
0.01 A for the a:verage ri:ng bond~ ~
dista.nca. With C-0
=
1.39
A , this corresponds to C-N=
1.35
...! 0.03 A •:s~atadiene and Cl_clopenta.dl_ep,e.- The photog:ra.p'hti of butadiene wh1.ch we1•0
f,l
Thi:rteen :rings could be seen, 1nth ·t:rio and
1
val ile s gi "fen) ( >Ii• 4 0
l" :~ci A i's indi