R E S E A R C H
Open Access
No-reference image quality metric based on
image classification
Hyunsoo Choi and Chulhee Lee
*Abstract
In this article, we present a new no-reference (NR) objective image quality metric based on image classification. We also propose a new blocking metric and a new blur metric. Both metrics are NR metrics since they need no information from the original image. The blocking metric was computed by considering that the visibility of horizontal and vertical blocking artifacts can change depending on background luminance levels. When computing the blur metric, we took into account the fact that blurring in edge regions is generally more sensitive to the human visual system. Since different compression standards usually produce different compression artifacts, we classified images into two classes using the proposed blocking metric: one class that contained blocking artifacts and another class that did not contain blocking artifacts. Then, we used different quality metrics based on the classification results. Experimental results show that each metric correlated well with subjective ratings, and the proposed NR image quality metric consistently provided good performance with various types of content and distortions.
Keywords:no-reference, image quality metric, blocking, blur, human visual sensitivity
I. Introduction
Recently, there has been considerable interest in devel-oping image quality metrics that predict perceptual image quality. These metrics have been useful in various applications, such as image compression, restoration, and enhancement. The most reliable way of evaluating the perceptual quality of pictures is by using subjective scores given by evaluators. In order to obtain a subjec-tive quality metric, a number of evaluators and con-trolled test conditions are required. However, these subjective tests are expensive and time-consuming. Con-sequently, subjective metrics may not always apply. As a result, many efforts have been made to develop objective quality metrics that can be used for real-world applications.
The most commonly used objective image quality metric is the peak signal to noise ratio (PSNR). How-ever, PSNR does not correlate well with human percep-tion in some cases. Recently, a number of other objective quality metrics have been developed, which consider the human visual system (HVS). In [1] the
Sarnoff model computed errors when distortions exceeded a visibility threshold. The structural similarity index (SSIM) compares local patterns of pixel intensities normalized for luminance and contrast [2]. One draw-back of these metrics is that they require the original image as a reference.
Since human observers do not require original images to assess the quality of degraded images, efforts have been made to develop no-reference (NR) metrics that also do not require original images. Several NR methods have been proposed [3-15]. These NR methods mainly measure blocking and blurring artifacts. Blocking arti-facts have been observed in block-based DCT com-pressed images (e.g., JPEG- and MPEG- coded images). Wu et al. proposed a blocking metric (generalized block impairment metric (GBIM)), which employed a texture and luminance masking method to weight a blocking feature [3]. In [7,8], blocking metrics were developed to measure the blockiness between adjacent block edge boundaries. However, these methods do not consider that the visibility can be changed depending on back-ground luminance levels. In [4], the blocking artifacts were detected and evaluated using blocky signal power and activities in the DCT domain. In [6], the blocking * Correspondence: [email protected]
Department of Electrical and Electronic Engineering, Yonsei University, 134 Sinchon-Dong, Seodaemun-Gu, Seoul, South Korea
metric was modeled by three features: average differ-ences around the block boundary, signal activities, and zero-crossing rates. In general, this metric requires a training process to integrate the three features.
The blur metric is useful for blurred images. For example, JPEG2000 based on a wavelet transform may produce blurring artifacts. Several NR blur metrics have been proposed to measure smoothing or smearing effects on sharp edges [9-13]. Also, a blur radius esti-mated using a Gaussian blur kernel has been proposed to measure blurring artifacts [14,15].
However, most NR image quality metrics were designed to measure specific distortion. As a result, they may produce unsatisfactory performance in certain cases. In other words, NR blocking metrics cannot guar-antee satisfactory performance for JPEG2000 com-pressed images and Gaussian-blurred images, while NR blur metrics cannot guarantee good performance for JPEG-compressed images. Since the HVS can assess image quality regardless of image distortion types, ideal NR quality metrics should be also able to measure such image distortions. However, this is a difficult task since NR quality metrics have no access to original images, and we have a limited understanding of the HVS.
Recently, researchers have tried to combine blur and blocking metrics to compute NR image quality metrics [16,17]. In [16], Horita et al. introduced an integrated NR image quality metric that they used for JPEG- and JPEG2000-compressed images. The researchers used an automatic discrimination method of compressed images, which produced good results for JPEG and JPEG2000 compressed images. However, the HVS characteristics were not considered in the decision process. In [17], Jeong et al. proposed a NR image quality metric that first computed the blur and blocking metrics and then combined them for global optimization.
In this article, we propose a new NR blocking metric and a new NR blur metric based on human visual sensi-tivity, and we also propose a NR metric based on image classification. The proposed blocking metric was obtained by computing the pixel differences across the block boundaries. These differences were computed according to the visibility threshold, which was based on the background luminance levels. The proposed blur metric was computed by estimating the blur radius on the edge regions. Images were classified based on the proposed blocking metric. Then, the blocking metric or the blur metric was used for each class. In the experi-ments, the proposed NR blocking metric, NR blur metric, and NR image quality metric based on image classification were evaluated using three image sets (i.e. JPEG-, JPEG2000-compressed, and Gaussian-blurred images). In Sect. II, the proposed blocking and blur metrics are explained, and then the image quality metric
based on image classification is presented. Experimental results are presented in Sect. III. Conclusions are given in Sect. IV.
II. The proposed no-reference image quality metric
A. NR blocking metric calculation
In [18], Safranek showed that the visibility threshold needs to be changed based on the background lumi-nance. In other words, the visibility threshold may dif-fer depending on the background luminance level. For example, if the background luminance level is low, the visibility threshold generally has a relatively large value. For medium luminance levels, the visibility threshold is generally small. This property was used when computing the proposed blocking metric. The proposed blocking metric was computed using the fol-lowing two steps:
Step 1. We computed a horizontal blocking feature (BLKH) and a vertical blocking feature (BLKV) using
a visibility threshold of block boundaries. Step 2. We combinedBLKHand BLKV.
In order to measure the horizontal blockiness (vertical edge artifacts), we defined the absolute horizontal differ-ence as follows (Figure 1):
dh(x,y) =AvgL−AvgR (1)
where AvgL= 1 2
0
i=−1
f(x+i,y), AvgR= 1 2
2
i=1
f(x+i,y)
On the other hand, Chou et al. [19] defined the visibi-lity threshold value,Ф(⋅), as follows:
(s) =
⎧ ⎪ ⎨ ⎪ ⎩
T0
1− sL
+ 3 ifs≤L
γ(s−L) + 3 ifs>L
(2)
wheres represents the background luminance
inten-sity,T0 = 17,g= 3/128, andL= 2bit-1- 1.
In this article, min(AvgL, AvgR) was used as the
back-ground luminance value around the block boundary, and the horizontal blockiness was only measured when the absolute horizontal difference exceeded the visibility threshold as follows:
NDh(x) =
⎛ ⎝
1≤y≤H
f(x,y)−f(x+ 1,y)×udh(x,y)−(min(AvgL,AvgR)
⎞⎠2
(3)
whereNDh(x) represents the sum of noticeable
BNDh= ⎛ ⎜ ⎜ ⎜ ⎜ ⎜ ⎝
1≤x≤W x≡0(mod8)
NDh(x)
⎞ ⎟ ⎟ ⎟ ⎟ ⎟ ⎠
1/2
(4)
Although we assumed that the distance between the adjacent blocking boundaries was a multiple of 8, one can use other values if the basic block for transforms size is different. Also, if the video is spatially shifted, one can determine the blocking boundaries by searching
the locations that provide the local maximum NDh(x)
values.
One problem with the frame horizontal blockiness value (BNDh) is that it may be large even though there
is no blocking artifact if the video has many vertical pat-terns. To address this problem, we also computed the column differences (EBDh) of pixels between the
block-ing boundaries and used them to normalize the BNDh
value. We computed the average column difference valueEBDhas follows:
EBDh= 1 7 7 k=1 ⎛ ⎜ ⎜ ⎜ ⎜ ⎜ ⎝
1≤x≤W x≡k(mod8)
⎛
⎝
1≤y≤H
f(x,y)−f(x+ 1,y) ⎞ ⎠ 2 ⎞ ⎟ ⎟ ⎟ ⎟ ⎟ ⎠ 1/2 (5)
The horizontal blocking feature,BLKH, was computed
as follows:
BLKH= ln
BNDh/EBDh
(6)
The vertical blocking featureBLKVwas similarly
com-puted. The final blocking metric FBLKwas computed as a linear summation of the horizontal blocking feature
and the vertical blocking feature:
FBLK =α×BLKH+β×BLKV (7)
In [20], it was reported that the visual sensitivities to horizontal and vertical blocking artifacts were similar. Therefore,aand bwere set to 0.5 in this article.
B. NR blur metric calculation
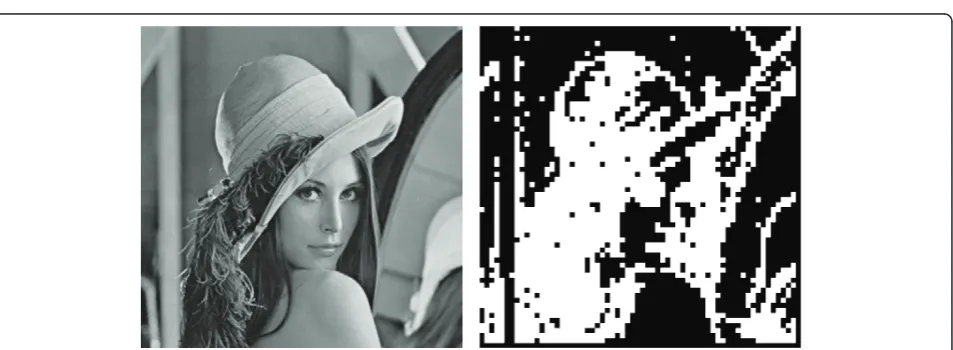
The proposed NR blur metric was motivated by the Gaussian blur radius estimator in [15], which was used for estimating an unknown Gaussian blur radius using two re-blurred images of the entire image. However, blurring artifacts are not always visible in flat (homoge-neous) regions. They are mostly recognizable in edge areas. Based on this observation, we divided the images into a number of blocks, and classified each block as a flat or edge block. Then, we computed the blur radius only for the edge blocks. In this article, we used a block size of 8 × 8. The variance was computed at each pixel position (x,y) as follows:
v(x,y) = 1 MN
N/2
j=−N/2
M/2
i=−M/2
f(x+i,y+j)−E2 (8)
wherev(x, y) represents the variance value at (x, y),M
represents the width of the window, Nrepresents the
height of the window, andE represents the mean of the window. In this article, MandNwere set to 3. In other words, the size of window was 3 × 3. Then, we classified each pixel using the following equations:
Pixel type =
Flat, Edge,
v(x,y)≤th1 th1<v(x,y)
(9) x
y
R L
h x y Avg Avg
d ( , )
) ,
(x y
f f(x1,y)
L
Avg AvgR
x y
R L
h x y Avg Avg
d ( , )
) ,
(x y
f f(x1,y)
L
Avg AvgR
In this article, theth1value was empirically set to 400.
Then, we classified the 8× 8 blocks based on the pixel classification results. If there was at least one edge pixel in a block, the block was classified as an edge block. Otherwise, the block was classified as a flat block. Figure 2 shows the classification results of the Lena image. In Figure 2, the black blocks represent flat blocks and the white blocks represent edge blocks.
The proposed blur metric was obtained by estimating the blur radii for the edge blocks (Be). The blur radius
was estimated using the procedure described in [15], where an edgee(x) was modeled as a step function:
e(x) =
A+B,x≥0
B, x<0 (10)
where Aand B are the constant values, and they do
not influence the blur radius estimation.
When the edge was blurred with an unknown Gaus-sian blur radiuss, the blurred edge was modeled as fol-lows:
b(x) =
⎧ ⎪ ⎪ ⎨ ⎪ ⎪ ⎩
A 2(1 +
x n=−x
g(n,σ)) +B, x≥0
A 2(1−
−x−1
n=x+1
g(n,σ)) +B,x<0
(11)
whereg(n,s) represents a normalized Gaussian kernel
(g(n,σ) = √1
2πσe − n
2
2σ2 ,n∈Z).
To estimate the unknown blur radius s, two
re-blurred edges (ba(x),bb(x)) were obtained with the blur radii (saandsb(sa<sb)). Then, the differencer(x) was calculated as follows:
r(x) = b(x)−ba(x) ba(x)−bb(x)
(12)
As proposed in [15], the blur radius swas estimated
by σ ≈ (σ σa·σb
b−σa)·r(x)max+σb. In this article, sa was empirically set to 1, andsbwas set to 4. The blur radius swas calculated only for the edge blocks. Finally, the proposed blur metricFBLRwas obtained as follows:
FBLR=
1 NB
i
σi
1
2 (13)
where si represents the blur radius of the ith block andNBrepresents the total number of edge blocks.
When there were no edge blocks, NBwas zero. This
means that the entire image was highly blurred. There-fore, in this case,FBLRwas set to 1.
C. NR quality metric based on image classification
Jeong et al. proposed the NR image quality metric that can be used for images with both blocking and blurring artifacts [17]. Jeong et al. optimized weights for blocking and blur metrics to compute the NR image quality metric as follows:
QNR=v1×BlockingM+v2×BlurM (14)
whereQNRrepresents the NR image quality metric,v1
andv2 represent the weights,BlockingM represents the
blocking metric, andBlurMrepresents the blur metric. On the other hand, JPEG and JPEG2000 images show different compression characteristics [21]. JPEG images may produce both blocking and blurring artifacts while JPEG2000 images mainly produce blurring artifacts. Since compressed images show different artifacts depending on the employed compression standard, glo-bal optimization may not produce the best performance. To address this problem, we first classified the images into two classes: one with blocking artifacts (JPEG
GG
G
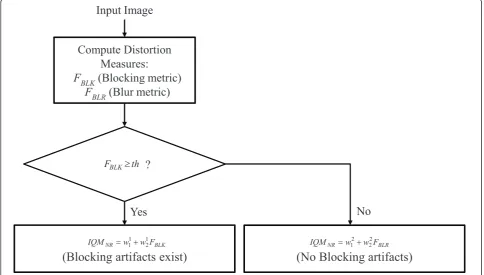
images) and the other without blocking artifacts (e.g., high quality JPEG images and JPEG2000 images). Then, to compute the proposed NR quality metric, the block-ing metric was used for images containblock-ing blockblock-ing arti-facts, and the blur metric was used for those containing no blocking artifacts, respectively. The proposed block-ing metric was used as a decision criterion, and the pro-posed NR image quality metric was computed as follows:
IQMNR=
w11+w12×FBLK, w21+w22×FBLR,
FBLK≥th(Blocking exists) FBLK<th(No Blocking)
(15)
The weights (w1
1,w12,w21, andw22) were determined by
minimizing the squared errors between the subjective scores and NR metrics. To compute the weights (w11,w12,w21, andw22) in Equation 15, images were first classified into two groups by the blocking score. The weights (w1
1andw12) were computed from the sample
images that contained the blocking artifacts, and the other weights (w1
1andw12) were computed from the
sam-ple images that have no blocking artifacts. After the weights were determined, the image quality metric was computed for each case. A block diagram of the proposed NR image quality metric is illustrated in Figure 3. Although one may use the blocking metric along with the blur metric for images classified as having no
blocking artifacts, we found that using the blocking metric along with the blur metric did not improve the performance. Similarly, although one may use the blur metric along with the blocking metric for images classi-fied as having blocking artifacts, it did not improve performance.
III. Experimental results
A. Image Quality Databases and Performance evaluation criteria
Several image quality databases (LIVE [22], IVC [23], and TID2008 [24]) are publicly available. In the LIVE database, 29 source images were used for creating 779 impaired images using JPEG images, JPEG2000 images, Gaussian blur, white noise, and fast-fading [22]. The LIVE database provides subjective quality scores in terms of the difference mean opinion score (DMOS). The IVC database contains JPEG- and JPEG2000-com-pressed images and also provides images with artifacts because of blurring and locally adaptive resolution (LAR) coding [23]. The subjective quality scores are given in terms of the mean opinion score (MOS). The TID2008 database has 25 source images and 1700 impaired images (25 source images × 17 types of distor-tions × 4 levels of distordistor-tions) [24]. The TID2008 data-base also gives the subjective scores in terms of MOS.
In general, the evaluation of a NR quality metric is performed by comparing the subjective MOS and
G
(No Blocking artifacts)
Input Image
Compute Distortion
Measures:
F
BLK(Blocking metric)
F
BLR(Blur metric)
?
th FBLKt(Blocking artifacts exist)
Yes
No
BLK NR w wF
IQM 1
2 1
1 IQMNR w12w22FBLR
objective values. Since the IVC database contained a small number of JPEG2000 images, we used the TID2008 database as a test database. To evaluate the proposed NR image quality metric, three image sets: JPEG-, JPEG2000-compressed images, and Gaussian-blurred images were selected from the TID2008 database.
Pearson correlation coefficients were used for perfor-mance evaluation [25]. These correlation coefficients were computed after the 3rd order polynomial functions were applied to take into account the nonlinear relation-ships between the objective quality metrics and the MOS scores.
MOSp=β1+β2×Metric +β3×Metric2+β4×Metric3(16)
where b1,b2,b3, and b4 represent the mapping
para-meters, Metric represents the objective quality metric, andMOSprepresents the predicted MOS.
B. Performance of the proposed NR blocking metric
To evaluate the proposed NR blocking metric, we used the JPEG images of the TID2008 database and compared them with some existing blocking metrics in the literature [3,6,17]. Table 1 shows the Pearson correlation coefficients
Table 1 Pearson correlation coefficients between the subjective scores and objective scores for the JPEG compressed images (TID2008 database)
Objective metric Pearson
Proposed blocking metric 0.951
Jeong’s blocking metric [15] 0.851
Wang et al. [6] 0.954
Wu and Yuen [3] 0.924
G
(a) (b)
(c) (d)
0 1 2 3 4 5 6 7
0 1 2 3 4 5 6 7
MOSp ( GBIM )
MO
S
Pearson Correlation Coefficient = 0.924
0 1 2 3 4 5 6 7
0 1 2 3 4 5 6 7
MOSp ( Wang )
MO
S
Pearson Correlatioin Coefficient = 0.954
0 1 2 3 4 5 6 7
0 1 2 3 4 5 6 7
MOSp ( Jeong_BLK )
MO
S
Pearson Correlation Coefficient = 0.851
0 1 2 3 4 5 6 7
0 1 2 3 4 5 6 7
MOSp ( FBLK )
MO
S
Pearson Correlation Coefficient = 0.951
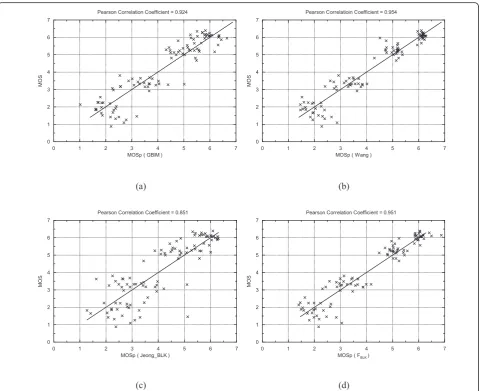
Figure 4Scatter plots of the MOS versus theMOSpof the blocking metrics for the JPEG images.(a)Scatter plot of GBIM(b)scatter plot
between the subjective scores (MOS) and the objective scores. All the metrics showed good performance except for Jeong’s method, and the proposed metric showed statis-tically equivalent performance as Wang’s blocking metric, and it was found to better than GBIM. As seen in Figure 4, the predicted MOSs (MOSp) of the proposed NR blocking metrics correlated well with the subjective scores (MOS).
C. Performance of the proposed NR blur metric
The proposed NR blur metric was compared with some existing NR blur metrics [12,13,17] using the JPEG2000 images and the Gaussian-blurred images of the TID2008 database. The performance of each metric is shown in Tables 2 and 3. It has been reported that Ferzli’s method produced good prediction performance with both image sets (JPEG2000 and Gaussian-blurred images of LIVE database) [13]. However, Ferzli’s method did not show satisfactory performance for the Gaussian-blurred images of the TID2008 database. This result may have been
Table 2 Pearson correlation coefficients between the subjective scores and objective scores for the JPEG2000 compressed images (TID2008 database)
Objective metric Pearson
Proposed blur metric 0.920
Jeong’s blur metric [15] 0.894
Ferzli and Karam [11] 0.831
Marziliano et al. [10] 0.856
Table 3 Pearson correlation coefficients between the subjective scores and objective scores for the Gaussian-blurred images (TID2008 database)
Objective metric Pearson
Proposed blur metric 0.800
Jeong’s blur metric [15] 0.795
Ferzli and Karam [11] 0.670
Marziliano et al. [10] 0.820
G G
(a) (b)
G G
(c) (d)
0 2 4 6
0 2 4 6
MOSp ( Marziliano )
MO
S
Pearson Correlatioin Coefficient = 0.856
0 2 4 6
0 2 4 6
MOSp ( JNBM )
MO
S
Pearson Correlatioin Coefficient = 0.831
0 2 4 6
0 2 4 6
MOSp ( Jeong_BLR )
MO
S
Pearson Correlatioin Coefficient = 0.894
0 2 4 6
0 2 4 6
MOSp ( FBLR )
MO
S
Pearson Correlatioin Coefficient = 0.920
Figure 5Scatter plots of the MOS versus theMOSpof the blocking metrics for the JPEG2000 images.(a)Scatter plot of Marziliano’s blur
caused by the fact that the test design of the TID2008 database is different from that of the LIVE database. The proposed blur metric showed the best performance for the JPEG2000 images and slightly lower performance than Marziliano’s algorithm for the Gaussian-blurred images. This result shows that the proposed NR blur metric accu-rately estimated the blurring artifacts for both the JPEG2000 images and the Gaussian-blurred images. Fig-ures 5 and 6 show the scatter plots for the JPEG2000 and Gaussian-blurred images. The proposed blur metric corre-lated well with the subjective scores for both image sets (JPEG2000 and Gaussian-blurred images).
D. Performance of the proposed NR image quality metric based on image classification
To evaluate the performance of the proposed NR image quality metric based on image classification, three image
sets (JPEG, JPEG2000, and Gaussian-blurred images of the TID2008 database) were combined into one set. We first combined a blocking metric and a blur metric by global optimization as shown in Equation 14. The block-ing metric was either one of the existblock-ing blockblock-ing metrics or the proposed blocking metric. The blur metric was either one of the existing blur metrics or the proposed blur metric. Table 4 shows the NR image quality metrics obtained as a linear combination of some blocking and blur metrics (global optimization). Clearly, the linear combination of the proposed blocking and blur metrics showed the best performance.
Next, we computed the NR image quality metric based on image classification. There was one parameter which was the threshold value (th) in Equation 15. Table 5 represents the Pearson correlation coefficient of the NR image quality metrics based on image classification as a
G G
(a) (b)
G G
(c) (d)
0 1 2 3 4 5 6
0 1 2 3 4 5 6 7
MOSp ( Marziliano )
MO
S
Pearson Correlation Coefficient = 0.820
0 1 2 3 4 5 6
0 1 2 3 4 5 6 7
MOSp ( JNBM )
MO
S
Pearson Correlation Coefficient = 0.670
0 1 2 3 4 5 6
0 1 2 3 4 5 6 7
MOSp ( Jeong_BLR )
MO
S
Pearson Correlation Coefficient = 0.795
0 1 2 3 4 5 6
0 1 2 3 4 5 6 7
MOSp ( FBLR )
MO
S
Pearson Correlation Coefficient = 0.800
Figure 6Scatter plots of the MOS versus theMOSpof the blocking metrics for the Gaussian-blurred images.(a)Scatter plot of
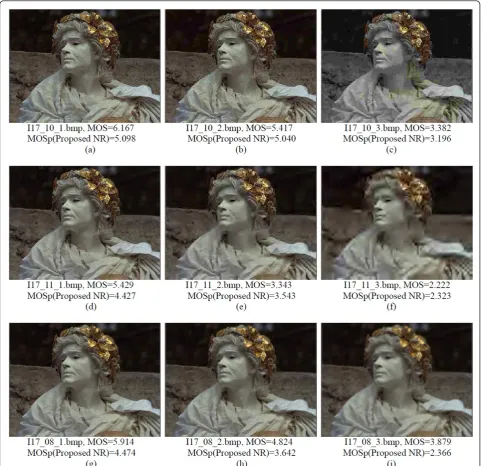
function of the threshold value (th). As seen in Table 5, when a blocking and a blur metrics were combined, noticeably improved performance was achieved. On the other hand, different threshold values were used for obtaining optimal performance for different combina-tions. Although these combinations of the blocking and blur metrics show good results, the NR image quality metric using the proposed NR blur and blocking metrics showed the best performance. Furthermore, as seen in Tables 4 and 6, employing image classification signifi-cantly improved performance. Figure 7 shows some sample images that were degraded by the JPEG images,
the JPEG2000 images, and the Gaussian blur kernel. The predicted MOSs by the proposed NR image quality metric correlate well with the subjective scores.
Table 7 shows how the three image sets (JPEG, JPEG2000, and Gaussian-blurred images of the TID2008 database) were classified. For the JPEG database, 14% of the images were classified as images without blocking artifacts, 4% of the JPEG200 database were classified as images with blocking artifacts, and 2% of the Gaussian-blurred database were classified as images with blocking artifacts. Table 8 shows the performance of the pro-posed NR metric based on image classification for each
Table 4 Pearson correlation coefficient of the NR image quality metric Obtained by global optimization (TID2008 database)
Combined Images (JPEG/JPEG2000/Gaussian Blurred)
NR metric using the proposed blocking and blur metrics 0.819
NR metric using Jeong’s blocking and blur metrics [15] 0.735
NR metric using [6,10] 0.689
NR metric using [6,11] 0.714
NR metric using [3,10] 0.740
NR metric using [3,11] 0.738
Table 5 Pearson correlation coefficient of the NR image quality metric based on image classification as a function of the threshold value (TID2008 database)
Threshold -0.8 -0.7 -0.6 -0.5 -0.4 -0.3 -0.2 -0.1 0 0.1 0.2 0.3 0.4 0.5 0.6 0.7 0.8
NR metric using the proposed blocking and blur
metrics
0.301 0.341 0.421 0.498 0.673 0.742 0.793 0.840 0.855 0.852 0.853 0.851 0.854 0.855 0.846 0.838 0.826
NR metric using Jeong’s blocking and blur metrics
[15]
0.301 0.336 0.406 0.470 0.624 0.681 0.723 0.769 0.801 0.801 0.818 0.834 0.843 0.846 0.839 0.833 0.824
NR metric using [6] and [10]
0.364 0.410 0.485 0.549 0.668 0.708 0.740 0.767 0.763 0.744 0.744 0.742 0.744 0.745 0.739 0.735 0.730
NR metric using [6] and [11]
0.351 0.412 0.487 0.554 0.708 0.752 0.790 0.827 0.829 0.824 0.802 0.776 0.778 0.779 0.772 0.767 0.757
NR metric using [3] and [10]
0.517 0.548 0.600 0.646 0.737 0.760 0.766 0.758 0.758 0.741 0.738 0.739 0.742 0.743 0.737 0.735 0.729
NR metric using [3] and [11]
0.508 0.550 0.602 0.651 0.774 0.801 0.815 0.818 0.825 0.821 0.797 0.773 0.776 0.778 0.771 0.767 0.756
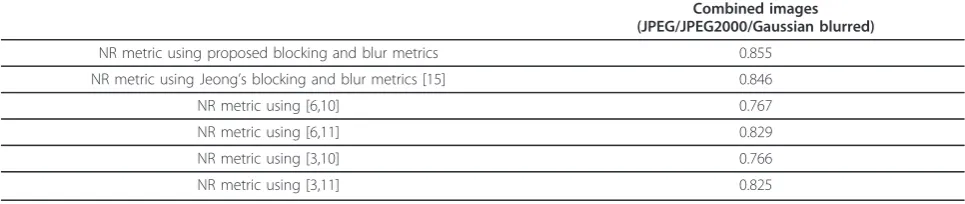
Table 6 Pearson correlation coefficient of the NR image quality metric based on image classification by the proposed blocking metric (TID2008 database)
Combined images (JPEG/JPEG2000/Gaussian blurred)
NR metric using proposed blocking and blur metrics 0.855
NR metric using Jeong’s blocking and blur metrics [15] 0.846
NR metric using [6,10] 0.767
NR metric using [6,11] 0.829
NR metric using [3,10] 0.766
of the three image sets. The proposed NR metric based on image classification showed consistently good perfor-mance for different impairment types. For the JPEG and JPEG2000 databases, the performance of the proposed NR metric based on image classification was identical to
that of the proposed NR blocking metric or the pro-posed NR blur metric. For the Gaussian-blurred data-base, the proposed NR metric based on image classification performed better than the other NR blur metrics.
Figure 7Some sample images that were degraded by the JPEG and JPEG2000 images and the Gaussian-blurred kernel, MOSs and the
objective quality predictions (MOSp) obtained by the proposed NR metric.
Table 7 Classification results of the three image sets (JPEG, JPEG2000, and Gaussian-blurred images of TID2008 database)
JPEG JPEG2000 and Gaussian-blurred images
Classified as images without blocking artifacts 14% 96% 98%
IV. Conclusions
In this article, we proposed a new NR image quality metric based on image classification. The NR blocking metric was obtained by computing noticeable horizontal and vertical distortions across block boundaries. The NR blur metric was computed by estimating the blur radii in the edge regions. To develop the new NR image quality metric, images were first classified into two classes: one that contained blocking artifacts, and the other that contained no blocking artifacts. Then, the dif-ferent quality metrics were used to measure the image quality. The experimental results show that the pro-posed NR blocking and blur metrics correlated highly with the subjective scores and the proposed NR metric based on image classification showed consistently good performance.
Abbreviations
BLKH: horizontal blocking feature;BLKV: vertical blocking feature; DMOS:
difference mean opinion score; GBIM: generalized block impairment metric; HVS: human visual system; LAR: locally adaptive resolution; MOS: mean opinion score; NR: no-reference; PSNR: peak signal to noise ratio; SSIM: structural similarity index
Acknowledgements
This study was supported by the IT R & D program of MKE/KCC/KEIT [10035158].
Competing interests
This article was supported by the Korea IT R&D program of MKE/KCC/KEIT [10035158].
Received: 12 August 2011 Accepted: 18 September 2011 Published: 18 September 2011
References
1. J Lubin, D Fibush,Sarnoff JND Vision Model(T1A1.5 Working Group Document No. 97-612, ANSI T1 Standards Committee, 1997) 2. Z Wang, AC Bovik, HR Sheikh, EP Simoncelli, Image quality assessment:
from error visibility to structural similarity. IEEE Trans Image Process.13(4), 600–612 (2004). doi:10.1109/TIP.2003.819861
3. HR Wu, M Yuen, A generalized block-edge impairment metric for video coding. IEEE Signal Process Lett.4(11), 317–320 (1997). doi:10.1109/ 97.641398
4. S Liu, AC Bovik, Efficient DCT-domain blind measurement and reduction of blocking artifacts. IEEE Trans Circuits Syst Video Technol.12(12), 1139–1149 (2002). doi:10.1109/TCSVT.2002.806819
5. Z Wang, AC Bovik, BL Evans, Blind Measurement of Blocking Artifacts in Images, inProc IEEE Int Conf Image Processing.3, 981–984 (2000) 6. Z Wang, HR Sheikh, AC Bovik, No-Reference Perceptual Quality Assessment
of JPEG Compressed Images, inProc IEEE Int Conf Image Processing, 477–480 (2002)
7. R Venkatesh Babu, AS Bopardikar, A Perkis, OI Hillestad, No-reference Metrics for Video Streaming Applications, inProc of International Packet Video Workshop(December2004)
8. S Suthaharan, No-reference visually significant blocking artifact metric for natural scene images. Signal Process.89(8), 1647–1652 (2009). doi:10.1016/j. sigpro.2009.02.007
9. X Li, Blind image quality assessment, inProc IEEE Int Conf Image Processing
(2002)
10. P Marziliano, F Dufaux, S Winkler, T Ebrahimi, A No-Reference Perceptual Blur Metric, inProc IEEE Int Conf Image Processing.3, 57–60 (2002) 11. E Ong, W Lin, Z Lu, X Yang, S Yao, F Pan, L Jiang, F Moschetti, A
No-Reference Quality Metric for Measuring Image Blur, inProc IEEE Int Conf Image Processing, 469–472 (2003)
12. P Marziliano, F Dufaux, S Winkler, T Ebrahimi, Perceptual blur and ringing metrics: application to JPEG2000. Signal Process. Image Commun.19(2), 163–172 (2004)
13. R Ferzli, LJ Karam, A no-reference objective image sharpness metric based on the notion of just noticeable blur (JNB). IEEE Trans Image Process.18(4), 717–718 (2009)
14. JH Elder, SW Zucker, Local scale control for edge detection and blur estimation. IEEE Trans Pattern Anal Mach Intell.20(7), 699–716 (1998). doi:10.1109/34.689301
15. H Hu, G Haan de, Low Cost Robust Blur Estimator, inProc IEEE Int Conf Image Processing, 617–620 (2006)
16. Y Horita, S Arata, T Murai, No-reference image quality assessment for JPEG/ JPEG2000 coding, inProc EUSIPCO, 1301–1304 (2004)
17. T Jeong, Y Kim, C Lee, No-reference image quality metric based on blur radius and visual blockiness. Opt Eng.49(4), 045001 (2010). doi:10.1117/ 1.3366671
18. RJ Safranek, JD Johnston, A perceptually tuned subband image coder with image dependent quantization and post-quantization data compression, in
Proc IEEE Int Conf, Acoust., Speech, Signal Processing.3, 1945–1948 (1989) 19. CH Chou, YC Li, A perceptually tuned subband image coder based on the
measure of just-noticeable-distortion profile. IEEE Trans Circuits Syst Video Technol.5(6), 467–476 (1995). doi:10.1109/76.475889
20. SA Karunasekera, NG Kingsbury, A distortion measure for blocking artifacts in images based on human visual sensitivity. IEEE Trans Image Process.4(6), 713–724 (1995). doi:10.1109/83.388074
21. F Ebrahimi, M Chamik, S Winkler, JPEG vs. JPEG2000: an objective comparison of image encoding quality. App Dig Image Proc XXVII.5558, 300–308 (2004)
22. HR Sheikn, Z Wang, L Cormack, AC Bovik, LIVE image quality assessment database. http://live.ece.utexas.edu/research/quality (2003)
23. P Le Callet, F Autrusseau, Subjective quality assessment irccyn/ivc database, http://www.irccyn.ec-nantes.fr/ivcdb/ (2005)
24. N Ponomarenko, M Carli, V Lukin, K Egiazarian, J Astola, F Battisti, Color Image Database for Evaluation of Image Quality Metrics, inProc Int Workshop on Multi-media Signal Processing, 403–408 (2008)
25. VQEG,Final Report from the Video Quality Experts Group on the Validation of Objective Models of Video Quality Assessment(March 2003)
doi:10.1186/1687-6180-2011-65
Cite this article as:Choi and Lee:No-reference image quality metric based on image classification.EURASIP Journal on Advances in Signal Processing20112011:65.
Submit your manuscript to a
journal and benefi t from:
7Convenient online submission
7 Rigorous peer review
7Immediate publication on acceptance
7 Open access: articles freely available online
7High visibility within the fi eld
7 Retaining the copyright to your article
Submit your next manuscript at 7 springeropen.com
Table 8 Performance of the proposed NR metric for each of the three image sets
JPEG JPEG2000 Gaussian-blurred images