Scholarship@Western
Scholarship@Western
Electronic Thesis and Dissertation Repository
10-16-2013 12:00 AM
Study on the surface chemistry behavior of pyrochlore during
Study on the surface chemistry behavior of pyrochlore during
froth flotation
froth flotation
Saeed Chehreh Chelgani The University of Western OntarioSupervisor Brian Hart
The University of Western Ontario Graduate Program in Geology
A thesis submitted in partial fulfillment of the requirements for the degree in Doctor of Philosophy
© Saeed Chehreh Chelgani 2013
Follow this and additional works at: https://ir.lib.uwo.ca/etd
Part of the Geology Commons, and the Mining Engineering Commons
Recommended Citation Recommended Citation
Chehreh Chelgani, Saeed, "Study on the surface chemistry behavior of pyrochlore during froth flotation" (2013). Electronic Thesis and Dissertation Repository. 1675.
https://ir.lib.uwo.ca/etd/1675
This Dissertation/Thesis is brought to you for free and open access by Scholarship@Western. It has been accepted for inclusion in Electronic Thesis and Dissertation Repository by an authorized administrator of
froth flotation
(Thesis format: Integrated Article)
by
Saeed Chehreh Chelgani
Graduate Program in Geology
A thesis submitted in partial fulfillment
of the requirements for the degree of
Doctor of Philosophy
The School of Graduate and Postdoctoral Studies
The University of Western Ontario
London, Ontario, Canada
ii
Abstract
Separation of pyrochlore from its associated minerals is typically accomplished by froth flotation.
The surface chemistry of pyrochlore is similar to many of its associated non-value minerals.
Therefore, understanding the surface chemical properties of the pyrochlore for selective pyrochlore
flotation will potentially aid in the design of flotation strategies for optimized recovery. In this study,
pyrochlore samples were collected from various points in the flotation scheme at the Niobec plant,
Quebec, Canada. The SEM-EDX analysis revealed that pyrochlore from the Niobec deposit occurs
as high and low iron varieties, and that recovery favours varieties with a lower Fe content. To
understand a potential relationship between pyrochlore matrix composition and the related effect on
collector adsorption, the surface of grains from the concentrate and tails were examined by
TOF-SIMS. The surface analyses of different pyrochlore grains showed that species indicative of the
cationic collector (Tallow diamine acetate) favour Fe poor pyrochlore relative to the Fe rich variety.
XPS was used to analyse the surface of high Fe and low Fe pyrochlore in order to identify a potential
relationship between pyrochlore matrix composition and surface chemistry. The XPS results verified
a relationship between pryochlore surface oxidation and Fe content in the mineral matrix; high Fe
pyrochlore particles showed a greater proportion of surface oxidation species suggesting preferential
oxidation in comparison with low Fe pyrochlore particles. SEM-EDX analyses revealed that many
of the pyrochlore grains were compositionally zoned into regions of high and low Fe contents.
TOF-SIMS and XPS analyses were used to analyze the surface of the compositionally zoned Fe
pyrochlore grains, in order to link collector adsorption to Fe contents and identify potential
mechanisms for the partitioning. Surface analyses of conditioned pyrochlore grains showing zones
of high and low Fe content revealed that species indicative of the collector favour the regions with
low iron. XPS analyses of similarly treated compositionally zoned pyrochlore grains showed that a
greater proportion of surface oxidation species corresponded to the zones with high matrix Fe
content. These results are in accord with the results identified for non-zoned pyrochlore grains of
variable matrix Fe content and verifies the link between pyrochlore Fe composition, surface
oxidation and, area selective collector loading.
iii
Co-Authorship Statement
The material presented in all chapters of this thesis has been published in journal of Minerals
Engineering:
S. Chehreh Chelgani, B. Hart, J. Marois, M. Ourriban, 2012, Study of pyrochlore matrix composition effects on froth flotation by SEM-EDX, Minerals Engineering, 30: 62-66.Copyright
Clearance license number: 3222640408425
S. Chehreh Chelgani, B. Hart, J. Marois, M. Ourriban, 2012, Study of pyrochlore surface chemistry effects on collector adsorption by TOF-SIMS, Minerals Engineering, 39: 71-76.
Copyright Clearance license number: 3222640204863
S. Chehreh Chelgani, B. Hart, J. Marois, M. Ourriban, 2013, Study the relationship between the compositional zoning of high iron content pyrochlore and adsorption of cationic collector,
Minerals Engineering, 46-47: 34-37. Copyright Clearance license number: 3213410570936
S. Chehreh Chelgani, B. Hart, M. Biesinger, J. Marois, M. Ourriban, 2013, Pyrochlore surface oxidation in relation to matrix Fe composition: a study by X-ray photoelectron spectroscopy,
Minerals Engineering, was accepted.
iv
Acknowledgments
First and foremost, I would like to express the deepest appreciation to my supervisor,
Professor Brian Hart, who has the attitude and the substance of a genius: he continually and
convincingly conveyed a spirit of adventure in regard to research and sponsorship, and an
excitement in regard to teaching. Without his guidance and persistent help this dissertation
would not have been possible.
I respect and thank Professor Stamen Dimov for giving me the opportunity to be involved in
many projects, and for providing me with invaluable guidance. I am extremely grateful to
him for being a constant source of support despite his busy schedule.
Much of this work would not have been possible without the help and technical expertise of
Mr. Jean-Sebastian Marois (Chemist at Niobec plant), and Mohamed Ourriban (Director
Metallurgy Manager in IAMGOLD Corporation). I would like to thank them for spending
their valuable time on providing samples and information. I greatly appreciate their
continuous support and insightful suggestions.
I would like to thank Dr. Mark Biesinger in regard to teaching XPS analysis.
My special and sincere thanks also go to:
My family, for being a constant source of encouragement and inspiration to me throughout
my life. I would like to thank you for the myriad of ways in which, throughout my life, you
have actively supported me in my determination to find and realize my potential, and to make
this contribution to our world.
Miss Sara Makaremi, for proof reading and being a constant source of support throughout
this work. I do not know how to thank you enough.
My roommates: Masoud Norouzi, Arman Didandeh, and Afrooz Ravanfar, thank you all for
v
Table of Contents
Abstract ... ii
Co-Authorship Statement... iii
Acknowledgments... iv
Table of Contents ... v
List of Tables ... viii
List of Figures ... ix
Chapter 1... 1
1 Introduction ... 1
1.1. References ... 4
Chapter 2... 5
2 Study of pyrochlore matrix composition effects on froth flotation by SEM–EDX ... 7
2.1. Introduction ... 7
2.2. Experimental methodology ... 10
2.3. Result and discussion ... 11
2.3.1. Pyrchlore structure ... 11
2.4. Conclusions ... 16
2.5. References ... 17
Chapter 3... 20
3 TOF-SIMS Studies of Surface Chemistry of Minerals Subjected to Flotation Separation - A review... 20
3.1. Introduction ... 20
3.2. TOF-SIMS analyses in the mineral flotation context ... 23
3.3. Principle component analysis (PCA) ... 24
vi
3.5. Contact angle ... 33
3.6. Hydrophobicity ... 34
3.7. Detection of reactions on mineral surface during flotation... 36
3.7.1. Platinum group metals (PGM) ... 36
3.7.2. Sulfides... 39
3.7.3. Other minerals ... 42
3.8. Summary ... 44
3.9. References ... 47
Chapter 4... 56
4 Study of pyrochlore surface chemistry effects on collector adsorption by TOF-SIMS56 4.1. Introduction ... 56
4.2. Experimental methodology ... 57
4.2.1. Data treatment ... 58
4.3. Results ... 59
4.4. Discussion ... 64
4.5. Conclusion ... 65
4.6. References ... 65
Chapter 5... 70
5 Pyrochlore surface oxidation in relation to matrix Fe composition: a study by X-ray photoelectron spectroscopy... 70
5.1. Introduction ... 70
5.2. Experimental ... 71
5.3. Result and discussion ... 72
5.3.1. EDX ... 72
5.3.2. TOF-SIMS ... 73
vii
5.5. References ... 76
Chapter 6... 79
6 Study oxidation states on the surface of pyrochlore minerals by XPS ... 79
6.1. Introduction ... 79
6.2. Experimental ... 81
6.3. Results ... 83
6.3.1. XPS survey spectra and high resolution Nb3d5/2 ... 83
6.3.2. XPS survey spectra and high resolution Fe 2p3/2 ... 86
6.3.3. Oxygen ... 90
6.4. Discussion ... 90
6.5. Conclusions ... 92
6.6. References ... 93
Chapter 7... 98
7 Conclusions and future works... 98
7.1. Conclusions ... 98
7.2. Future work ... 100
7.3. References ... 101
Appendix I ... 102
Appendix II ... 102
Appendix III... 103
viii
List of Tables
Table 1-1. Reagents are used in Niobec flotation plant. ... 4
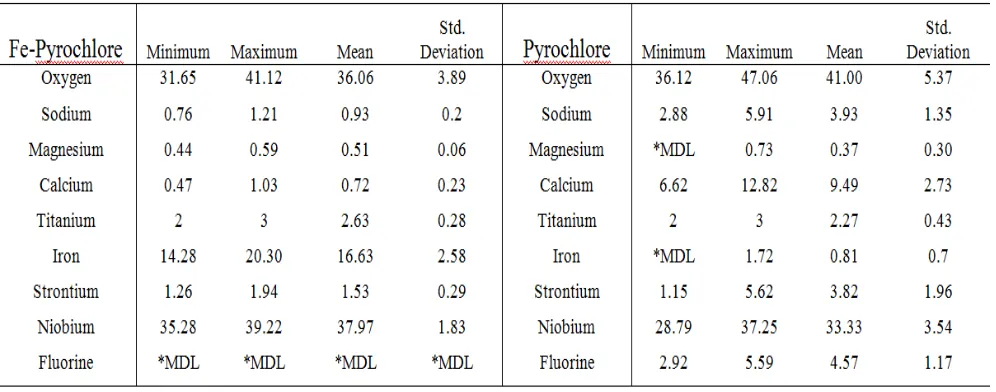
Table 2-1. EDX analysis of high iron content (Fe-pyrochlore) and low iron content
(pyrochlore) pyrochlore grains. The concentration data is expressed I weight %... 12
Table 2-2. Pearson correlation (r) between the average normalized mass intensities for
selected species measured on the surface of both high and low iron content pyrochlore gains.
... 13
Table 4-1. Results of EDX analysis of pyrochlore grains in pyrochlore rougher feed and
pyrochlore rougher concentrate at.%. ... 59
Table 4-2. Inter correlation between A site pyrochlore (A2B5O7) elements... 61
Table 5-1. EDX analysis of different zones in Fe-pyrochlore grains from Niobec. The
concentration data is expressed by weight %. ... 83
Table 5-2. High resolution XPS data for Nb as measured on the surface of conditioned high
ix
List of Figures
Fig. 1-1. Niobec mine, regional geology (Belzile, 2009)... 3
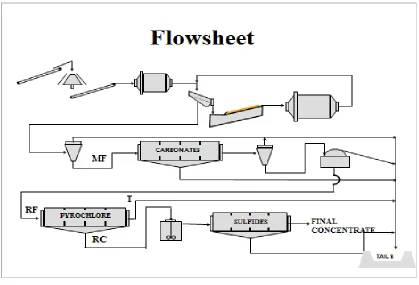
Fig. 2-1. Simplified flowsheet of the Niobec process. The feed (mill feed: MF), after size
reduction, is subjected to carbonate flotation; the tails from carbonate flotation, refered to as
the rougher feed (RF), is pumped to a pyrochlore flotation bank; the rougher concentrate
(RC) is then sent through five countercurrent stages of cleaning; the cleaner concentrate (CC)
is subjected to sulfide flotation. The rejects from the pyrochlore rougher banks and the
cleaner circuit are sent to tailings (T) (Dufresne and Goyette, 2004)... 10
Fig. 2-2. Comparison of Fe, Ca, and Na-Concentration (%) mass signals of pyrochlore grains.
... 13
Fig. 2-3. Distribution of difference between actual and estimated Fe concentration from Eq.
(2-2)... 14
Fig. 2-4. Element’s distribution in a pyrochlore grain... 15
Fig. 2-5. EDX maps of a pyrochlore containing Fe as inclusions. ... 16
Fig.3-1. TOF-SIMS total ion image of particles in pyrite, sphalerite and chalcopyrite mixture
(a), reconstructed image (b) and Mass loadings (c) and for PC2 selected area (a)(Hart et al., 2005)... 27
Fig.3-2. TOF-SIMS normalized intensities of oxygen and iron on chylcopyrite particles: (a)
mild steel medium with oxygen purging (b) chromium medium with nitrogen purging (Peng & Grano, 2010). ... 30
Fig.3-3. TOF-SIMS normalized intensities of oxygen and iron on galena particles: (a) mild
x
Fig.3-4. Positive-ion images of the surface of a mixture of chalcopyrite and galena (weight
ratio 1:1) after chitosan adsorption; (a) Image of chalcopyrite (Cu+); (b) Image of galena
(Pb+); (c) Image of chitosan signed molecule (C6H11O4N+) (Huang et al., 2012)... 42
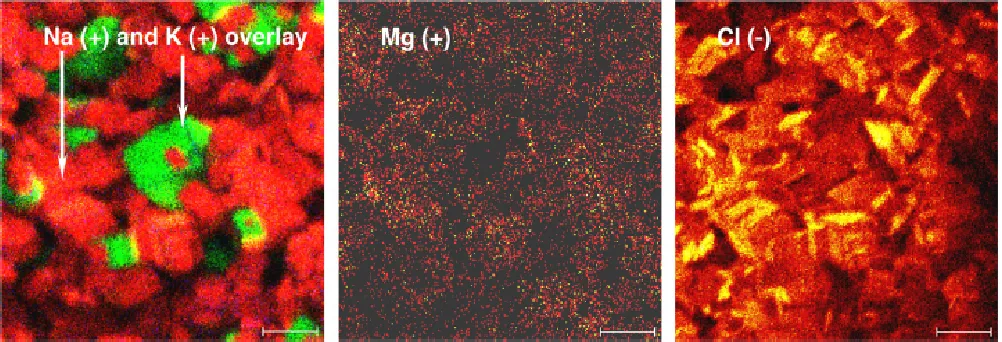
Fig.3-5. TOF-SIMS images of mixed salt precipitates (produced from the addition of 5 wt.%
Mg 2+ to saturated brine) (Wooden et al., 2007)... 44
Fig.4-1. Positive ion ToF-SIMS spectrum for tallow diamine (collector), high and low iron
content pyrochlore (pyrochlore, and Fe-pyrochlore) with and without treatment. (a: Collector,
b: Fe-Pyrochlore without conditioning, c: Pyrochlore without conditioning, d: Fe-pyrochlore
after conditioning, e: Pyrochlore after conditioning)... 60
Fig.4-2. Box and wisker plots illustrating the relative intensity of cationic collector mass
species on the surface of the conditioned Fe-pyrochlore (high iron) and pyrochlore (low iron)
grains... 62
Fig.4-3. Box and whisker plots illustrating the relative intensity ofoxygen and hydroxide on
the surface of conditioned pyrochlore particles. ... 63
Fig.4-4. Negative mass spectra on the surface of untreated particles. ... 63
Fig.5-1. Optical microscopic (right) and BSE images (left), and EDX analysis of a Fe
pyrochlore grain at wt%... 73
Fig.5-2. Elemental maps for zoned crystal of the Fe- pyrochlore for St-Horone deposit... 74
Fig. 5-3. Box and wisker plots illustrating the relative intensity of oxygen, hydroxide and
cationic collector mass species on the surface of the conditioned high and low iron
compositional zones of Fe pyrochlores. The horizontal bar in the boxes represents the median
(mean of the data). ... 75
Fig.6-1. Optical microscopic image, BSE image, and elemental maps for zoned crystal of a
Fe-pyrochlore for St-Horone deposit. ... 82
xi
Fig.6-3.Relative proportion of Niobium species measured on the surface of the sputtered (S),
and conditioned (C) grains... 85
Fig.6-4. Concentration of Nb(V) on the surface of high and low iron zones. ... 85
Fig.6-5.Iron states on the surface of a sputtered pyrochlore and immediately conditioning...
... 87
Fig.6-6. Comparison of the high resolution XPS spectra between grains with different Fe
content after conditioning. Included for each grain examined is the weight % Fe, as
determined by EDX, along with the relative proportion surface Fe (At %) from the XPS
broad scan data and the proportion of Fe metal (At %) as determined in the high resolution
XPS scans. Fe(XPS ZV) refers to the Fe metal in the spectra ... 88
Fig.6-7. Box and wisker plots illustrating the relative intensity of oxygen on the surface of
the sputtered and conditioned high and low iron compositional zones of Fe pyrochlores ... 89
Chapter 1
1
Introduction
Mineral separation by froth flotation is a physical and chemical process which depends
on complex phenomena occurring at the surfaces of mineral particles and air bubbles in
the flotation pulp. The basis of froth flotation is related to the difference in surface
wet-abilities of the different minerals; those that are easily wettable by water are hydrophilic,
those that are water-repellent are hydrophobic. Mineral flotation is a process that involves
the collision between particles and their interaction with air bubbles in the pulp. When air
is bubbled through a mixture of hydrophobic and hydrophilic particles suspended in
water, the hydrophobic particles will tend to attach to the air bubbles and float to the
surface. The froth layer on the surface of the flotation cell either overflows the lip of the
cell or is removed by froth scraper. The hydrophilic particles which are less inclined to
attach to air bubbles, remain in suspension and are ultimately removed from flotation cell
the tails (Rao & Leja, 2004; Bulatovic, 2007; Wills, 2010).
Particles can either be naturally hydrophobic, or the hydrophobicity can be induced by
chemical treatments. In order to induce hydrophobicity to selected minerals, reagents
(e.g. chemical treatment; collectors, depressants, activators) are added to the pulp.
Surface chemical modifiers designed to render a mineral surface hydrophobic (collectors)
are reagents which are designed to selectively coat a specific particle (mineral) surface
with a monolayer of a polar molecule. Chemicals are needed to control both the relative
hydrophobicities of the particles, and to maintain the proper froth characteristics.
Selective flotation is strongly dependent on the degree of collector adsorption on the
mineral’s surface. Whether the collector adsorption is due to electrostatic attraction or
chemisorption, is a function of the surface charge of the mineral and the type of collector.
If electrostatic attraction is the major driving force, the adsorption process is
characterised as physical; if however, the collector forms strong covalent or coordinate
Froth flotation is a highly versatile method for separating sulfide minerals. Various oxide
minerals on the other hand are usually not as responsive to the froth flotation process.
Hydrophobicity of oxides is believed to be influenced, to a large extent, by the
electrochemical nature of the oxide–solution interface. The hydrogen and hydroxyl ions,
when adsorbed on the oxide surface, together constitute a polarizable hydration layer
with a hydrogen-bonded structure. The flotation behaviour of oxides and silicates is
highly pH dependent, and because of their surface chemical similarities (Smith, 1987; Rao & Leja, 2004; Bulatovic, 2007; Wills, 2010) their flotation behaviour can be very similar. In most cases, the presence of metal ions in the pulp can be highly detrimental to
the flotation of most oxide minerals. The adsorption of metallic cations on silicates and
oxides impairs selectivity and separation of oxides and silicates or individual silicates
themselves. It is believed that chemisorption of high molecular-weight collectors on
oxide and silicate minerals is hindered where metal ions, present in aqueous solution,
have hydrolyzed and precipitated as hydroxide complexes on the mineral surfaces.
Surface chemistry is the principal determinant for selective separation of the various
mineral phases. With a rise in the complexity of the ores processed by flotation,
understanding the reactivity of mineral surfaces in this context is becoming increasingly
more important. Instrumental techniques such as X-ray photoelectron spectroscopy
(XPS), and Time of flight secondary ion mass spectrometry (TOF-SIMS) are unique in
that they have the capacity to analyze surfaces, and therefore, are powerful tools to help
understand mineral surface properties, and their reactions during the flotation process.
This investigation evaluates factors affecting the recovery of pyrochlore, the primary Nb
host, from the Niobec pyrochlore flotation plant. The Niobec underground mine is
located twenty-five kilometres north of Ville de Saguenay (Chicoutimi), in the limits of
the municipality of Saint-Honoré (Fig 1-1).The host rock is divided in three distinct litho-structural units. The first unit constitutes a gneiss complex. The second unit is
represented by anorthosite and charnockite-mangerite batholiths (showing well preserved
igneous structures and textures). The third unit is characterized by calc-alkaline intrusions
that cross-cut the host rocks. The intrusive mass (i.e St-Honoré alkaline complex) is
of crescentic lenses of carbonatite with compositions that change progressively inwards
from calcitite through dolomitite to ferrocarbonatite. Niobium minerals of bi-pyramidal form are disseminated throughout the carbonatite. The economic mineralization is found
in ferrian and sodic pyrochlore, generally in association with geological units rich in
magnetite and biotite. Open stoping has been the only mining method used since mine
start-up. Stopes are planned and designed based on geological information obtained from
diamond drilling.
Fig 1-1.Niobec mine, regional geology (Belzile, 2009).
Since 1974 Niobec has been extracting niobium from the Staint-Honoré carbonatite
deposit. Niobec is the only North American pyrochlore source and one of the three major
world producers of ferroniobium. In the St-Honoré carbonatite ore, pyrochlore represents
calcite), silicates (biotite, chlorite and Na, K-feldspars) and to a lesser extent apatite.
Other constituent minerals include magnetite, hematite, pyrite and zircon.
In almost all pyrochlore processing operations, after mining and comminution, the ore is
subjected to desliming to remove particles finer than 10 µm. The deslimed mineral pulp is subjected to three stages of flotation. The first stage involves flotation of carbonates,
which removes a significant proportion of feed without much loss of pyrochlore
(niobium). The tail of carbonate flotation is then subjected to pyrochlore flotation. The
froth at this stage not only contains pyrochlore but also some sulphides, such as pyrite
and pyrrhotite, which are removed by reverse flotation in the next processing stage.
In order to increase selective separation, various reagents are used in Niobec plant (Table 1-1). A major difficulty in selective pyrochlore flotation results from the similar surface chemical characteristics of pyrochlore and its associated gangue (non-value) minerals
(other oxides and silicates). Selectivity of the pyrochlore cannot be achieved solely by
choosing a single collector. The base of this difficulty is related to the similarity in
isoelectric points (IEP) of pyrochlore with main the gangue minerals. This similarity in
surface charge partially limits pyrochlore flotation selectivity. Therefore, understanding
the primary mechanisms of collector attachment along with the surface chemistry of
pyrochlore is essential in order to modify the current reagent scheme or potentially
develop new collectors towards increasing pyrochlore selectivity. Furthermore, details
from the investigation can potentially provide information towards the reduction in
reagent use and the development of a simpler circuit.
The main purpose of this study is to evaluate the factors affecting pyrochlore stream
partitioning within the pyrochlore flotation circuit at Niobec. This thesis is organized in
several chapters which follow the course of the study. In the first chapter, variability in
the matrix composition of pyrochlore grains in relation to the froth flotation stream
products is investigated. The second chapter of this study is intended to provide a
comprehensive review of the TOF-SIMS applications in the mineral flotation context and
how this technique has been applied to the various mineral processing applications. The
from the flotation products. The chapter explores the possible factors affecting the
collector (tallow diamine acetate) absorption on the high and low iron pyrochlore grains.
Chapter four describes the chemical zoning of the Fe pyrochlore minerals. The main aim
of this chapter is to link pyrochlore matrix composition to surface chemistry and its affect
on collector attachment. The results are used to better understand the variability in
collector loading along with gaining some information on the collector adsorption
mechanism. In chapter five, XPS analyses are used to examine the variability in surface
oxidation of compositionally zoned pyrochlore grains. The aim of the study is to link
pyrochlore matrix composition to variability in surface oxidation in order to evaluate this
relationship with the observed mineral recovery.
The final results of this investigation may provide some understanding regarding the loss
of selected pyrochlore grains. The results will also be used towards the selection of
potential alternative commercial reagents for optimizing selectivity and recovery, or to
help design reagents particularly suited for pyrochlore in this flotation context.
Table 1-1. Reagents are used in Niobec flotation plant.
Reagents Concentration Tallow diamine acetate 220 g/t
Sulphonate 30 g/t
Phosohate 25 g/t
Propioinic acid 25 g/t Dowfroth 250C 20 g/t
H2SiF6 140 g/t
1.1.References
Bulatovic, S., 2007. Handbook of Flotation Reagents: Chemistry, Theory and Practice:
Flotation of Sulphide Ores. Elsevier, S&T Books.
Rao, S.R., Leja, J., 2004. Surface Chemistry of Froth Flotation, Kulwer Acedemic Press.
New York.
Wills, B.A., 2010. Mineral Processing Technology, 7th Edition, Elsevier online
Smith, R.W., 1987. Cationic and Amphoteric CollectorsIn: P. Somasundran and B.M.
Mondgil (eds), Reagents in Mineral Technology, Marcel Dekker Inc., New York.
Chapter 2
2
Study of pyrochlore matrix composition effects on froth flotation
by SEM–EDX
2.1. Introduction
Niobium is used as an alloying agent predominantly in the steel production industry.
Niobium-containing super alloys are used in the construction of jet and rocket engines
because of their temperature stability properties. Superconducting alloys containing Nb
along with titanium and tin are widely used in MRI scanners. Other applications include
welding, electronics, optics, numismatics and jewelry. The predominant niobium bearing
minerals are pyrochlore and columbite (Tanabe, 2003; Belzile, 2009).
Pyrochlore deposits contain substantial amounts of carbonates, sulphides, and other
gangue minerals such as biotite, apatite, and feldspar. In almost all pyrochlore processing
operations, after mining and comminution, the ore body is subjected to desliming to
remove particles finer than 10 µm. The deslimed mineral pulp is subjected to three stages of flotation. The first stage involves flotation of carbonates, which removes a significant
proportion of the feed without much loss of pyrochlore. The tail of carbonate flotation is
then subjected to pyrochlore flotation. The froth at this stage not only contains pyrochlore
but also some sulphides, such as pyrite and pyrrhotite, which are removed by reverse
flotation in the next processing stage (Burks, 1958; Shapolov and Polkin, 1958; Zakharov
et al., 1967; Razvozzhaev and Nikiforov, 1972; Bogdanov et al., 1973; Abeidu, 1974;
Raby and Desrochers, 1975; Wilson, 1979; Biss and Nadeau, 1982; Biss, 1985).
The largest pyrochlore deposit is the CBMM mine located south of Araxá, Minas Gerais,
followed by the Catalão mine east of Catalão, Goiás, in Brazil. The third largest deposit
of niobium ore is the Saint-Honoré mine west of Saint-Honoré near Chicoutimi, Quebec
(Kouptsidis et al., 2008). Since 1974, Niobec has been extracting niobium from the
Saint-Honoré carbonatite deposit. Niobec is the only operating Nb extraction facility in North
American and one of the three major world producers of ferroniobium (Dufresne and
In the St-Honoré carbonatite ore, pyrochlore represents only about 1% of the total
mineral mass. The dominant minerals are carbonates (mainly dolomite and calcite),
silicates (biotite, chlorite and Na/K-feldspars) and to a lesser extent apatite. Other
constituent minerals include magnetite, hematite, pyrite and zircon (Dufresne and
Goyette, 2004).
With the aim of optimizing the flotation process for the Niobec ore, experiments were
performed on the influence of collector, activator and type of water on Nb2O5 recovery
and grade in the rougher and cleaner concentrates (Gomez et al., 1987; Rao et al., 1988).
During process development it became evident that mild cationic collectors were
preferable to anionic collectors because of their ability to collect less calcite and
dolomite. Electro-kinetic measurements showed pyrochlore surfaces to be negatively
charged in the desired pH flotation range. In light of this, tallow diamine acetate was
selected for pyrochlore flotation; addition rates were 220 g/t (Dufresne and Goyette,
2004; Belzile, 2009).
Along with the pyrochlore, tallow diamine floats all of the silicates, iron oxides, apatite,
sulfides and part of the dolomite, but by gradually reducing the pH, and by introducing
silicate depressant all of these except pyrite are depressed (Dufresne and Goyette, 2004).
A series of tests were performed at various lower flotation pHs to assess selectivity and
recovery. However, no significant improvement in selectivity was observed when the pH
was reduced and therefore the pH was maintained between 6.8 and 7.5 (Rao et al., 1988;
Dufresne and Goyette, 2004; Belzile, 2009). A major difficulty of pyrochlore flotation
results from the similar flotation characteristics (the same surface chemistry) of
pyrochlore and its associated minerals (other oxides and silicates) (Gomez et al., 1987);
selectivity cannot be achieved solely by choosing a single collector (Dufresne and
Goyette, 2004). The basis of this difficulty is related to the similarity in the iso electric
points (IEP) of pyrochlore and the main contaminant minerals (the IEP of charge for
pyrochlore, biotite, pyrite and feldspar at potable water is 2.5, 2, 1.5 and 1.9, respectively
(Gomez, 1987)) which limits selective flotation in response to electrostatic collector
There is significant evidence to support that surface chemical variability can be directly
related to variability in matrix composition (Hu et al., 2003; Barros et al., 2008; Oelkers
et al., 2009). In a paper looking at the surface chemistry of multi-oxide silicates, in
particular the pyroxenes diopside and enstatite, Oelkers et al. (2009)identified (1)
divalent metal loss was directly related to pH, highest in alkaline solutions and (2) the
removal rate and amount of Mg was on the order of 2x greater in diopside relative to
enstatite. In this instance the loss of divalent metals results in the creation of ‘‘internal’’
surface sites, some of which can become protonated. Furthermore, the loss of metal ions
corresponds to a linear increase in protonation, the degree of which is a function of the
mineral composition. The data indicates that, metal-proton exchange reactions play a
major role in surface reactivity and that variability in surface reactivity is strongly linked
to mineral composition. Given this example it would be reasonable to assume that similar
relationships occur in compositionally variable pyrochlore grains where collector
adsorption may be linked to variability in metal ion removal rates. Therefore,
understanding collector attachment in relation to variable matrix chemistry and its
expression on the pyrochlore surface will potentially aid in the development of collectors
or reagent strategies towards, increasing selectivity, lowering reagent consumption,
promoting improved Nb-recoveries, and finally leading to simpler circuits.
In this chapter, matrix compositions of pyrochlore grains from Niobec froth flotation
circuit were investigated. The study utilized scanning electron microscopy coupled with
energy dispersive X-ray spectroscopy (SEM–EDX) to measure concentrations of the
main matrix elements in pyrochlore grains from the mill feed (MF), pyrochlore rougher
feed (RF), pyrochlore rougher concentrate (RC), and pyrochlore rougher tail (T) (Fig.
2-1). The main aim of this study is to examine the pyrochlore matrix composition from
various stream products with the potential to relate the matrix composition to variability
in flotation recovery. This study is investigating the link between pyrochlore surface and
Fig. 2-1. Simplified flowsheet of the Niobec process. The feed (mill feed: MF), after size reduction, is subjected to carbonate flotation; the tails from carbonate flotation,
refered to as the rougher feed (RF), are pumped to a pyrochlore flotation bank; the rougher concentrate (RC) is then sent through five countercurrent stages of cleaning; the cleaner concentrate (CC) is subjected to sulfide flotation. The rejects
from the pyrochlore rougher banks and the cleaner circuit are sent to tailings (T)
(Dufresne and Goyette, 2004).
2.2. Experimental methodology
For the mineralogical investigation, pyrochlore grains were collected from various points
in the flotation scheme at the Niobec plant. Approximately two hundred pyrochlore gains
were analyzed from the mill feed (carbonate rougher feed), pyrochlore rougher feed
(carbonate rougher tail), pyrochlore rougher concentrate, and pyrochlore rougher tail. The
concentration of selected elements were measured in the pyrochlore grains with a LEO
system. The instrument was operated at 20 keV, 400 pA. Samples were sputter- coated
with Au/Pt in order to prevent charging during analyses.
2.3. Result and discussion
2.3.1. Pyrochlore structure
Pyrochlores (A2B5O7) are complex oxides whose structures are made up of
interconnected octahedra, consisting predominantly of Na, Ca, Fe and Sr in the A
position and Nb, Ti, and Ta (B position). The various pyrochlore group end members are
made by isomorphic substitution in the B position. Predictable variability in the
proportion of A site ions results in minor compositional variability of the subgroups.
Pyrochlore grains containing inclusions of Fe (presumably as an oxide) have also been
identified (Hogarth, 1960, 1977; Petruk and Owens, 1975; Zurevinski and Mitchell,
2004).
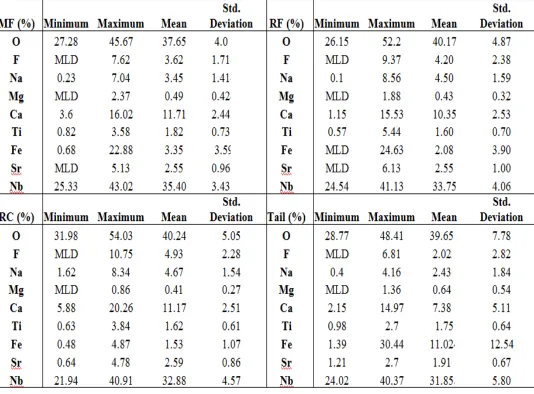
The EDX analysis of pyrochlore grains from mill feed (MF), pyrochlore rougher feed
(RF), pyrochlore rougher concentrate (RC), and pyrochlore rougher tail (T) are presented
in Table 2-1. Analyses of pyrochlore grains from the RC and Tail samples show a relative
decrease in matrix Na and Ca, along with a corresponding increase in Fe in grains from
the tail (Fig. 2-2). These results suggest that the presence of iron in pyrochlore (either as
an inclusion or structurally bound) may have an impact on its selectivity.
Given the observed relationship between Fe content and pyrochlore floatability, it was
important to determine whether this relationship was due to Fe in the mineral matrix or
related to potential inclusions within the mineral. In order to determine the nature of the
Fe in the pyrochlore, statistical methods were performed on the analyses within the entire
data set (MF, RF, RC, and T) in an attempt to distinguish matrix from inclusion iron.
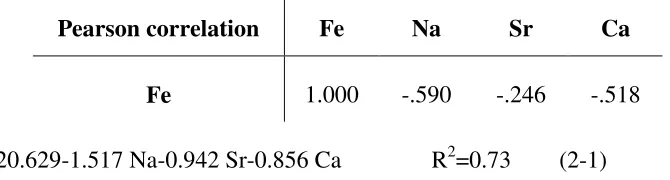
Inter-correlations between A site elements (Ca, Na, Fe, and Sr) indicate that higher Fe
contents correspond to lower amounts of Ca, Na and Sr (Table 2-2). In addition, the
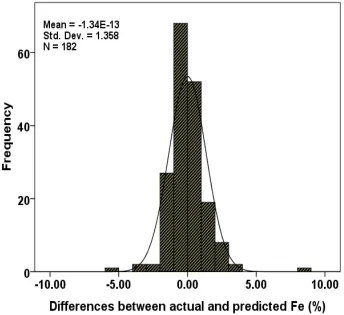
linear and non-linear enter-remove regression methods shows that the Fe content in
(2-2)) where the difference between actual and non-linear predicted iron content for more
than a hundred grains is less than %1 (Fig. 2-3).
Table 2-1. Results of EDX analysis of pyrochlore grains in mill feed (MF), pyrochlore rougher feed (RF), pyrochlore rougher concentrate (RC), and Tail (T) at.%. (*MDL =
Fig 2-2. Comparison of Fe, Ca, and Na-Concentration (%) mass signals of pyrochlore grains.
Table 2-2. Inter correlation between A site pyrochlore (A2B5O7) elements.
Pearson correlation Fe Na Sr Ca
Fe 1.000 -.590 -.246 -.518
Fe (%)=20.629-1.517 Na-0.942 Sr-0.856 Ca R2=0.73 (2-1)
Fe (%)=31.957-5.621Na+0.953Na2-0.056Na3-3.965Ca+0.28Ca2-0.007Ca3-0.407Sr
Fig. 2-3.Distribution of difference between actual and estimated Fe concentration from Eq. (2-2).
Both statistical methods theoretically corroborate that the Fe in pyrochlore is indeed a
matrix member. A significant contribution to the Fe content in pyrochlore grains by
inclusions would have resulted in poor inter-correlation data and large differences
between the actual and non-linear predicted Fe values. EDX mapping of several cross
sectioned pyrochlore grains supports the statistical analysis. The Fe map of the
pyrochlore grain in Fig. 2-4 shows a relatively homogenous distribution across the grain,
supporting the statistical analysis that Fe in the Niobec pyrochlore grains is
predominantly matrix bound. For comparison EDX maps of a pyrochlore containing Fe
as inclusions is included. Note the localized Fe regions identifying the Fe inclusions (Fig.
Fig.2-4. Distribution ofelements in a pyrochlore grain.
These analyses indicate that a higher concentration of matrix Fe in pyrochlore grains can
potentially be linked to poor selectivity. Given these observations we have identified two
potential explanations for the results (1) the higher proportion of Fe decreases the relative
negative surface charge on pyrochlore, potentially preventing the adsorption of the
cationic amine collector (Barros et al. (2008)reported higher concentrations of iron in
apatites, rendering the surface of the apatites positive or less negative in the weakly
alkaline pH range inhibiting collector attachment) and (2) higher surface iron content
could promote a greater degree of surface oxidation thereby interfering with collector
adsorption (poor flotation of iron pyrochlore is noted in the plant (Rao et al., 1988)).
investigations linking pyrochlore surface reactivity to the variability in matrix Fe content
using surface analytical tools are currently underway. The results will be applied to
testing scenarios designed to improve flotation recovery.
Fig.2-5. EDX maps of a pyrochlore grain containing Fe as inclusions.
2.4. Conclusions
SEM–EDX analysis of pyrochlore grains has linked poor flotation performance to an
increase in grain Fe content. Statistical analyses identified that the increase in Fe in the
pyrochlore is not as a result of Fe rich inclusions, rather it has been identified as an
mapping where the Fe in cross sectioned pyrochlore grains appears evenly distributed.
The results suggest that poor floatability is related to higher matrix Fe contents. Two
possible explanations linking high Fe content to poor recovery have been suggested: (1)
high Fe content resulting in change in surface charge, (2) high Fe content resulting in a
variable degree and rate of surface oxidation. In progress studies linking pyrochlore
surface reactivity using surface analytical tools are investigated. The results will be
applied to testing scenarios designed to improve flotation selectivity.
2.5. References
Abeidu, A.M., 1974. Studies on the selective flotation of pyrochlore.Journal of Applied
Chemistry and Biotechnology 24 (8), 425.
Barros, A.F.L., Ferreira, E.E., Peres, A.E.C., 2008. Floatability of apatites and gangue
minerals of an igneous phosphate ore.Minerals Engineering 21, 994–999.
Biss, R., Nadeau, R., 1982. Direct flotation of pyrochlore. United States patent, p.
4342648.
Biss, R., 1985. Process for recovering pyrochlore mineral containing niobium and
tantalum. United States patent, p. 4493817.
Belzile, E., 2009. Technical Report for Niobec Mine Quebec. Canada, NI, pp. 43–101.
Bogdanov, O.S., Yeropkin, Y.I., Koltunova, T.E., Khobotova, N.P., Shtchukina, N.E.,
1973. Hydroxamic acids as collectors in flotation of wolframite, cassiterite and
pyrochlore. In: Proceedings X International Mineral Processing Congress, IMM, London,
UK, p. 533.
Burks, H.G., 1958. Separation of pyrochlore from calcite, apatite and silica. United States
patent, p. 2951585.
Dufresne, C., Goyette, G., 2004. The production of ferronibium at the Niobec mine.
Gomez, R.E., Finch, J.A., Laplante, A.R., 1987. Effects of the type of water on the
selective flotation of pyrochlore from niobec.Colloids and Surfaces 26, 333.
Gomez, R.E., 1987. Recovery of pyrochlore from slims discarded at Niobec by column
flotation, p. 10.
Hogarth, D.D., 1960. A study of pyrochlore and betafite. The Canadian Mineralogist, p.
610.
Hogarth, D.D., 1977. Classification and nomenclature of the pyrochlore group. American
Mineralogist 62, 403–410.
Hu, Y., Liu, X., Xu, Z., 2003. Role of crystal structure in flotation separation of diaspore
from kaolinite, pyrophyllite and illite.Minerals Engineering 16, 219–227.
Kouptsidis, J., Peters, F., Proch, D., Singer W., 2008. Niob für TESLA, pp. 1–16.
Petruk, W., Owens, D.R., 1975. Electron microprobe analyses for pyrochlores from
OKA, QUEBEC. The Canadian Mineraloglst 13, 282.
Oelkers, E.H., Golubev, S.V., Chairat, C., Pokrovsky, O.S., Schott, J., 2009. The surface
chemistry of multi-oxide silicates. Geochemica et Cosmo. Acta 73, 4617–4634.
Raby, R., Desrochers, C.J., 1975. Pyrochlore flotation. United States patent, p. 3910836.
Rao, S.R., Gomez, R.E., Finch, J.A., Biss, R., 1988. Effect of water chemistry on the
flotation of pyrochlore and silicate minerals. Mineral Engineering 1 (3), 189.
Razvozzhaev, Y.I., Nikiforov, K.A., 1972. Activation of pyrochlore during flotation of a
chemical beneficiation cake. Scientific-Research Institute of Rare Metals, Irkutsk 2, 108.
Shapolov, G.M., Polkin, S.I., 1958. Flotation properties of pyrochlore, zirkon and
associated minerals.Sborn.Nauch. Trud. Moscow, Inst. Tsvet. Metal Isolate 31, 256.
Tanabe, K., 2003. Catalytic application of niobium compounds. Catalysis Today 78(1–4),
Wilson, J.A., 1979. Flotation recovery of pyrochlore. United States patent, p. 4178235.
Zakharov, A.E., Ilie, P., Pol’kin, S.I., Solnyshkin, V.I., 1967. Reaction of sodium sulfide
with pyrochlore, zircon, and monazite in flotation with sodium oleate. In: Plaksin, I.N.
(Ed.), Flotation Properties of Rare Metals Minerals. Primary Sources, New York, USA,
p. 71.
Zurevinski, S.E., Mitchell, R.H., 2004. Extreme compositional variation of
pyrochlore-group minerals at the OKA carbonatite complex, quebec: evidence of magma mixing?
Chapter 3
3
Studies on surface chemistry of minerals subjected to flotation
separation by TOF-SIMS – A review
3.1. Introduction
Flotation is a complex process, partially governed by particle size and topography, the
composition of the particle and the nature of the particle surface (edges and dislocations
etc). Selective recovery however is driven by the chemistry of the top few monolayers of
the mineral surface. The mineral particle-bubble attachment and its ensuing stability are
governed by the balance of hydrophobic/hydrophilic species on the particle surface.
Given that numerous species can coexist on the mineral surface simultaneously, shifts in
this balance can have significant consequences on recovery. For example, the promotion
of mineral surface hydrophobicity through the adsorption of hydrophobic collectors is
easily and commonly hampered by the presence of oxidation products (oxy-S-species,
oxy-hydroxides), precipitates, adsorbed ions, depressants and fine particles of other
mineral phases (Trahar, 1976; Stowe et al., 1995; Crawford and Ralston, 1988; Boulton et al., 2003; Malysiak et al., 2004; Smart et al., 2007; Shackleton et al., 2007; Muganda et al., 2012, Smart et al, 2013).
In order to optimize mineral beneficiation by means of froth flotation, a detailed
evaluation of the surface chemistry of both value and non-value minerals by phase and
stream in a process is essential. Ideally the surface evaluation must be weighed in context
of the flotation (grade and recovery) along with other significant contributors to the
recovery process: solution chemistry and speciation along with mineral chemistry and
liberation data. The approach to process improvement then becomes integrated,
potentially identifying recovery controls by linking various contributing factors prior to
looking at opportunities for improvement, for example in grinding, water quality, reagent
For the identification of the surface chemical control factors in a flotation process, it is
necessary to measure statistically, differences in surface species by mineral phase within
the flotation circuit (feed, conditioners, roughers, cleaners and tails) (Hart et al.2006, Gerson et al., 2012). Due to the complexity of the flotation procedure, the characterization of mineral grain surfaces from this process is a significantly challenging
task. There have however been great advancements in the application of various surface
analytical tools to flotation in the last 2 decades. An excellent review on a wide range of
innovative surface analytical techniques, applied to the fundamental understanding of the
flotation process is given by Smart, 2013. The article provides a short description on the development and application of the most common tools along with case studies and some
insights to new techniques for analyses.
There are numerous spectrometric and spectroscopic techniques that can be employed to
study both mineral bulk and surface chemistry (Cormia et al., 1992; Marabini et al., 1993). Some of these techniques are more applicable for identifying and understanding interactions between minerals and various components within the hosting pulp. The most
sensitive and reliable method for surface analysis is secondary ion mass spectrometry
(SIMS) which collects and analyzes the secondary ions that are removed from the surface
after bombardment with an ion beam. The process, referred to as sputtering, results in the
removal of surface material through the generation of positive and negative ions along
with neutral fragments. SIMS is divided into two categories, dynamic and static,
depending on the energy and nature of the primary ionizing beam. In the dynamic mode
(D-SIMS), the high energy direct current ion beam continuously removes surface
material creating a depth profile through the sample being analysed. The technique is
considered destructive and provides information regarding the matrix composition of the
sample (typical analytical sample depths are on the order of several microns). In the static
mode (SSIMS or more commonly TOF-SIMS) a pulsed low energy ion current removes
surface material. In the time of analysis generally less than 0.1% of the samples atomic
sites are involved in ion beam interaction. The ion interaction leads to a very low sputter
rate, on the order of a fraction of a monolayer per hour and therefore the technique is
considered non destructive. The SSIMS or TOF-SIMS technique is best suited for the
layers. Chemical imaging has been well established for both DSIMS and TOF-SIMS
(Brinen et al., 1993).
TOF-SIMS is widely used to conduct qualitative surface chemical analysis. Properly
identified secondary ions on the mineral surfaces can be characteristic of hydrophobicity
functionalities. In the flotation context, an excess of “hydrophobic fragments” or
“hydrophilic fragments” can be applied to identify the predominant surface chemical
species contributing to the concentration (floated) or rejection (tail) of a particular
particles (Trahar, 1976; Stowe et al., 1995; Crawford and Ralston, 1988; Piantadosi et al., 2000; Boulton et al., 2003; Ralston et al., 2007). Moreover, the intensity of TOF-SIMS signals from these surface chemical species as a qualitative indication tool can be used to
estimate surface wettability of a mineral (Boulton et al., 2003; Piantadosi et al., 2000; Khmeleva et al., 2005).
TOF-SIMS signal intensities can be affected by (1) the concentration of ion species on
the mineral surfaces, (2) sputter yield of species, (3) matrix effects (e.g., ion yield), and
(4) the beam conditions (Benninghoven, 1969;Vickerman and Briggs, 2001; Hagenhoff, 2000; Piantadosi et al., 2000). Numerous studies have shown that TOF-SIMS has the required level of sensitivity for detection and analysis of mineral surfaces from flotation
products (Chryssoulis et al., 1995; Nagaraj and Brinen, 1996, 1997, 2001; Smart et al., 2008). However as the procedure is based on a comparative measurement of secondary ions generated from the surface of minerals (secondary ion yield, SIY), issues regarding
matrix dependent variations in SIY, relative sensitivity factors (RSF) and surface
component loading should be considered and incorporated into a separation method of
minerals. For sulphides, comparative RSFs for various matrix components and several
surface adsorbed reagents have been worked out (Hart et al., 2010). However for the various other value added minerals (for example rare earth element minerals), this task
remains a work in progress.
It is the intent of this paper to provide a comprehensive review of the TOF-SIMS
applications in the mineral flotation context. We hope to demonstrate how this technique
testing strategies, grinding, hydrophobicity, contact angle, flotation which can reveal
elemental and molecular information from the surface of different minerals during
flotation, and the surface chemistry of single particles present in a mixture of mineral
grains.
3.2. TOF-SIMS analyses in the mineral flotation context
In the flotation context, the surface chemistry of grains representing samples from the
various points in the process stream are analysed by TOF-SIMS. The spectra are obtained
by bombarding the surface of the grains with a pulsed primary ion beam to desorb and
ionize species from the sample surface. Damage to the uppermost monolayer is
minimized by applying extremely low primary ion fluxes (Gerson et al., 2012). The process results in the production of sputtered neutrals as well as positive and negatively
charged ions. The most versatile ion beam for analysis of mineral surfaces from flotation
process samples is Bi+1 which can be clustered into 3, 5 and 7 ion clusters, retaining the
same kinetic energy while reducing or, spreading out, the ionization impact. The true
value of the Bi+1 ion gun is in its capacity for minimizing fragmentation of larger
molecules (collectors) allowing for significantly improved identification. Older
generation ion beams include Au, Ga+, Ar+, O-, Cs+, and SF6 however with the advent of
the new generation ion guns these have been phased out except for special circumstances
(for example, Cs+ depth profile sputtering, and Au cluster ions to enhance the sensitivity
for molecular species).
As a result of the low primary ion current, the majority of the sputtered species are
molecular in nature, both fragmented and parent, a feature which is exploited for reagent
identification. The generated charged ions are separated according to mass in a time of
flight (TOF) drift tube and detected by a sensitive dual channel plate analyser. By
rastering the primary ion beam over a selected area on the sample, elemental and
molecular distribution maps are obtained. From these maps, region-specific variability in
atomic and molecular intensity can be established on a qualitative basis. Under the best
All raw spectra are processed generally with instrument proprietary software (e.g.,
IONTOF or Wincadence-N). Peaks in the calibrated spectra are assigned to specific
isotopes in accordance with their atomic mass. Peaks representative of specific materials
(collectors) are defined based on spectral finger prints which are generated by analysing a
small portion of the collector mounted on a specific substrate. For surface specie loading,
comparative evaluation of the corrected ion intensity for each mass position, measured as
the integrated area under each peak corrected for dead times, is calculated. In order to
compare intensities between areas of different dimensions, corrected intensities are
normalized to the total number of counts for the areas examined (Hart et al., 2006; Vizcarra et al., 2011).
Possibly one of the greatest challenges to studying the interactions between pulp and
mineral surfaces in aqueous medium from flotation plants is sample collection. The key is
to preserve the sample for analysis at a later date in a different facility. For this a method
has been developed where surface reactions after collection are minimized by degassing
the sample immediately after collection with de-oxygenated nitrogen and snap freezing
with liquid nitrogen (Smart, 1991; Piantadosi and Smart, 2002; Hart et al., 2006, 2007). The sample must remain frozen during transport. In time delayed testing (when analysed
within a 3 month period after collection) no difference in the surface characteristics in
relation to the time of analyses have been identified.
3.3. Principle Component Analysis (PCA)
A major challenge associated with the application of TOF-SIMS analyses on the mineral
flotation stream products is mineral phase recognition due to the composition complexity
of minerals within multiphase ores and their surface chemistry. Principal component
analysis (PCA) is a common technique applied to analyze multivariate data and has been
applied in various disciplines (Jolliffe, 1986). PCA is generally utilized to reveal underlying information in the data (patterns and relationships among variables) and to
decrease the dimension of data. Linear combinations of the original variables based on
the covariance and correlation matrix are derived PCs. The test data of various analyses
based on the inter-correlations. The maximum possible variation in the database can be
presented by the first principal component (PC1) data with the maximum variation in the
uncorrelated data with PC1 represented by the second principal component (PC2). In this
interative fashion all the variations in the database are represented by PCs derived.
The first few PCs will represent the most variation in the database if the original variables
show inter-correlation. In a two dimension plan, PC1 and PC2 are geometrically applied
to indicate the structure of variables on PC1 x PC2 bi-plot and the observation patterns on
a PC1 x PC2 scatter-plot. For more information, the interested reader is referred to the
original work for a detailed description of this technique (Jolliffe, 1986).
One of the main beneficiations of PCA pattern is that this method can be applied for “the
systematic examination and interpretation of the model outputs” (Kourti & MacGregor, 1995). It allows for classification of the ore into several phases, using all elements present (Smeink et al., 2005) and also reduces the number of secondary ions that would be useful to understand the variation of reactions without missing essential data (Abreu et al., 2010).
Hart et al. (2005) have shown that for TOF-SIMS data analysis of flotation products, PCA is capable of providing useful information towards phase recognition and particle
selection. They have demonstrated that in a complex multi-phase ore, mineral
identification using PCA is a more reliable approach compared with elemental imaging
and manual particle selection; as it can provide a clearer definition of particle boundaries
using multi-variable recognition (Biesinger et al., 2004; Hart et al., 2005; Hart et al., 2006). In particular, it allows for detection of different mineral phases and their surface species rather than manually focussing on one mineral for statistical analysis. This
methodology is the subject of a patent (Smart et al., 2008).
PLS_Toolbox 2.1 from Eigenvector Research Ltd. (Manson, WA, USA) running on
Matlab 6.0 (or 7.0) was the software used for PCA analysis. In processing TOF-SIMS
images, PCA selects these correlations from the mass spectra recorded at each of 256 x
in the peak selection is the total remaining ion image (sum of ion intensity not selected as
a specific peak) shown at mass zero in the loadings. Data was either ‘‘mean centred’’ or
‘‘auto scaled’’ prior to PCA (Hart et al., 2006). Mean centring is done by subtracting the column mean from each column, thus forming a matrix where each column has a mean of
zero. For the ‘‘auto scaled’’ data, the data is first mean centred and each mean centred
variable is then divided by its standard deviation resulting in variables with unit variance.
This procedure puts all variables on an equal basis in the analysis. Thus, the less intense
but more chemically significant higher mass peaks receive the same level of
consideration in the analysis as the intense, low mass peaks (Hart et al., 2005, Gerson et al., 2012).
In the image mode, PCA has proved to be an applicable method of selecting particles by
mineral phase with clearer definition of particle boundaries due to multi-variable
recognition. Hart et al. (2005) have shown that intensities between the sphalerite and pyrite/chalcopyrite phases are clearly separated by statistical difference in copper (Fig.3-1). The experimental results validate the selective transfer of Cu from chalcopyrite to sphalerite.
In another investigation, Hart et al. (2006) applied the PCA method on concentrate and tails samples collected from the Inco Matte Concentrator. The results indicate that the
transfer of Cu and Ni between chalcocite and heazelwoodite results in the inadvertent
activation of heazelwoodite and depression of the chalcocite. The data also provided
evidence that the collectordiphenyl guanidine (DPG) may be selectively attaching to
hydroxylated Cu sites. The data revealed that there is a considerably higher CuOH signal
on both Cc and Hz particles in the concentrate relative to the tails and higher CuO
intensities on Cc and Hz particles from the tails. This finding is supported by the
statistical analyses of all TOF-SIMS variables where Pearson product moment
inter-correlations between CuOH and DPG (119) for Hz in the concentrate is 0.70 and for Cc
in concentrate 0.96 where as for the tail samples, the inter-correlation for Cc in tails is
Fig.3-1. TOF-SIMS total ion image of particles in pyrite, sphalerite and chalcopyrite
mixture (a), reconstructed image (b) and Mass loadings (c) and for PC2 selected area (a)
(Hart et al., 2005).
Abreu and Skinner (2011a) also used the PCA for TOF-SIMS images to examine the potential impact of surface chemistry on mineral recovery at constant hydrodynamic
conditions. Results indicate that PCA can be applied on TOF-SIMS signals to
differentiate chalcopyrite grains in the concentrate and tail, and on the quantified particle
responses to the flotation process. Abreu et al. (2010) also applied PCA on TOF-SIMS outputs as a database to predict the contact angle of chalcopyrite particles according to
They used principal components to classify the surface species (secondary ions) into
hydrophobic or hydrophilic categories. They have stated that “this approach is capable of
determining the surface chemistry contribution to the contact angle of individual mineral
particles and the distribution of contact angles within a large ensemble of particles”
(Abreu et al., 2010; Aberu & Skinner, 2011a).
Gerson et al. (2012) applied PCA on TOF-SIMS analyses in order to examine the surface species on both concentrates and tails samples from the Bingham Canyon porphyry
copper deposit. The source of the ore, is geologically complex (Triffett and Bradshaw 2008) but can be simplified into limestone skarn (LSN) ore, containing economic concentrations of Cu sulfide minerals, and monzonite (MZ) ore, containing economic
concentrations of both Mo and Cu sulfide minerals. It had been proposed, as a result of
plant-based flotation observations that blending of these two ore types would lead to
‘poisoning’ of the flotation response. The TOF-SIMS PCA analyses indicate that
copper-containing components within both the MZ and LSN ores showed significant surface
contamination so that, on blending, their flotation response was not significantly affected.
However, the surface of the molybdenite component of the MZ ore was largely clean. On
blending, partial transfer of the hydrophilic load in the LSN ore took place on to the MZ
molybdenite resulting in apparent ‘poisoning’ of the flotation response of this component
(Smart et al 2013).
3.4. Grinding
Flotation separation of galena from pyrite was significantly affected by the oxidation of
metal species on the surface of galena and pyrite throughout grinding. Iron hydroxide
species on the surface of both minerals depressed their flotation, whereas lead hydroxide
species can activate the pyrite surfaces with negligible impact on galena flotation. To
optimize selective separation of galena from pyrite by flotation, grinding conditions
Peng et al. (2003) used a specific type of mill which allowed for controlling the pH during grinding. It was utilized to study the impact of grinding conditions on selective
flotation of galena from pyrite. Two types of iron media were investigated: mild steel and
30 wt. % chromium (with 70wt. % iron). They used TOF-SIMS to identify differences
in surface species occurring as a result of the different media and test parameters The
TOF-SIMS results revealed the highest percentage of oxygen and iron species on the
surface of galena was observed during grinding with mild steel and oxygen purging. In
flotation testing, these results correlated with the poor galena recovery.
In the same investigation TOF-SIMS analyses of pyrite surfaces also identified that the
highest concentration of FeOH was observed during grinding with mild steel and oxygen
purging. The percentage of lead and lead hydroxide species on the pyrite surfaces also
had a positive correlation with low recovery of pyrite. Comparative analyses between
EDTA extraction analyses and TOF-SIMS results suggest that on the surface of galena
and pyrite, lead hydroxide could be covered by iron hydroxide. This explains the
reduction of lead oxidation species in the presence of iron oxidation species, independent
of whether lead oxidation species depressed galena flotation or activated pyrite flotation
(Peng et al., 2003).
In another investigation on flotation of galena and chalcopyrite, by using a similar
experimental procedure, it was shown that flotation of fine particles, in the order of −10
µm, strongly depended on grinding conditions (Peng & Grano, 2010). Two hypotheses were suggested: 1. Fe contamination depressed flotation of particles; 2. various
percentages of iron hydroxide species could be present on the surface of fine and
intermediate size grains. These possibilities were examined by TOF-SIMS, using two
types of grinding media: the tapered cylinder mild steel grinding medium ( 100wt. %
iron, supplied from Pasminco Mining Co., Elura, Australia) and the spherical chromium
grinding medium (30 wt.% chromium, supplied from Magotteaux, Australia) (Peng & Grano, 2010).
The normalized intensities of selected ions on the surface of treated galena for various
that the surfaces of treated fine particles under grinding with mild steel medium and
oxygen purging showed much stronger intensities of O, Fe and Fe(OH) compared with
intermediate particles (Fig. 3-2a). The higher adsorption of iron hydroxide species on the surface of fine grains is consistent with the lower recovery of those particles. Also, the
same intensities of O, Fe and Fe(OH) on the surface of both fine and intermediate grains
were observed when grinding was done with 30 wt. % chromium medium with nitrogen
purging (Fig. 3-2b). The same recoveries under this condition for different particle sizes were achieved (Peng & Grano, 2010).
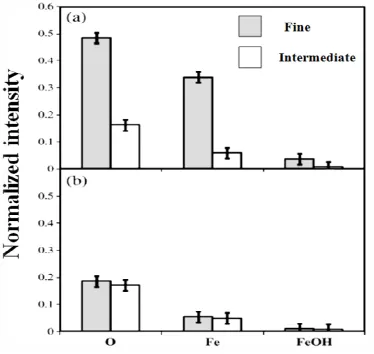
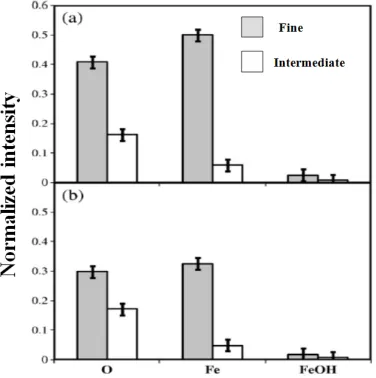
Fig. 3-2. TOF-SIMS normalized intensities of oxygen and iron on chylcopyrite particles: (a)
Fig. 3-3. TOF-SIMS normalized intensities of oxygen and iron on galena particles: (a) mild
steel medium with oxygen purging (b) chromium medium with nitrogen purging (Peng & Grano, 2010).
The same procedure was conducted on the surface of chalcopyrite particles under
different grinding conditions. Greater intensities of O, Fe and Fe(OH) were detected on
the surface of fine particles compared with intermediate ones after grinding with mild
steel medium and oxygen purging (Fig. 3-3a). These results explained the low recovery of fine chalcopyrite particles even when minimizing iron contamination from grinding
conditions. The normalized intensities of O, Fe and Fe(OH) on the surface of fine grains
for samples ground with 30 wt. % chromium medium with nitrogen purging show a