Drug Design, Development and Therapy
Dove
press
O r i g i n a l r e s e a r c h open access to scientific and medical research
Open access Full Text article
Predictive performance of gentamicin
dosing nomograms
Jieon lee1
seonghae Yoon1
Donghoon shin1
hyeKyung han1
hyungmi an1,2
Jongtae lee1
Kyoung soo lim3
Kyung-sang Yu1
howard lee1
1Department of clinical Pharmacology
and Therapeutics, seoul national University college of Medicine and hospital, seoul, Korea; 2Department
of statistics, college of natural sciences, seoul national University, seoul, Korea; 3Department of clinical
Pharmacology and Therapeutics, cha University school of Medicine and cha Bundang Medical center, seongnam, Korea
correspondence: howard lee Department of clinical Pharmacology and Therapeutics, seoul national University college of Medicine and hospital, 101 Daehak-ro, Jongno-gu, seoul 110-799, Korea
Tel +82 2 3668 7602 Fax +82 2 742 9252 email [email protected]
Background: Several nomograms have been proposed to facilitate the determination of initial gentamicin dosing regimens in clinical settings. This study aimed to assess the predictive performance of these nomograms in Korean patients.
Methods: Gentamicin concentrations were determined in 84 patients with infective endocarditis (IE) and in 95 patients with other infections. All patients underwent therapeutic drug monitoring in Seoul National University Hospital from 2006 to 2012. Individual phar-macokinetic parameters were estimated using a Bayesian method, which predicted steady state peak and trough serum concentrations. Six nomograms were evaluated in patients with “other” infections: the Thomson guidelines, Hull-Sarubbi table, and Rule of Eights, for multiple daily dosing; and the Hartford nomogram, Barnes-Jewish Hospital nomogram, and Sanford Guide, for extended-interval dosing. In IE patients, synergistic combination dosing nomograms, based on the American Heart Association dosing interval guidelines, were evaluated.
Results: Gentamicin dosing nomograms performed poorly in attaining the target peak serum concentrations. Multiple-daily dosing nomograms predicted peak serum gentamicin concentra-tions better than did the extended-interval dosing nomograms (31.9%–72.3% vs 4.3%–45.7%, respectively). Similarly, in patients with IE, the once-daily dosing nomogram resulted in a significantly lower percentage of patients achieving target peak gentamicin concentrations than that associated with the thrice-daily dosing nomogram (P=0.0015). All of the multiple-daily dosing, extended-interval dosing, and synergistic combination dosing nomograms predicted the nontoxic target trough concentrations in .80% of patients.
Conclusion: Gentamicin dosing nomograms performed poorly in achieving the target peak serum concentrations. New gentamicin nomograms may be required in patients with IE, particu-larly for once-daily dosing. Therapeutic drug monitoring is highly recommended for gentamicin to ensure that the target concentrations are achieved.
Keywords: antibiotics, infectious endocarditis, therapeutic drug monitoring, Bayesian method
Introduction
Gentamicin is an aminoglycoside antibiotic with bactericidal activity against aerobic gram-negative organisms. Although gentamicin has been widely used, it is potentially toxic to the kidney (nephrotoxicity) and the inner ear (ototoxicity).1 Therefore, it is
essential to use an appropriate initial dose and dosing interval for gentamicin to mini-mize its toxicity, while maintaining its efficacy. When determining the appropriate gentamicin dose, many factors need to be considered, eg, infection site, patient age, sex, body weight, serum creatinine, and creatinine clearance.2–4
Several nomograms and dosing guidelines have been developed to optimize the initial dosage regimen for gentamicin. These can be categorized into three groups:
Drug Design, Development and Therapy downloaded from https://www.dovepress.com/ by 118.70.13.36 on 22-Aug-2020
For personal use only.
Number of times this article has been viewed
This article was published in the following Dove Press journal: Drug Design, Development and Therapy
Dovepress
lee et al
multiple-daily dosing (MDD), extended-interval dosing (EID), and gram-positive synergistic combination dosing (SCD). MDD regimens administer gentamicin intermittently, twice- or thrice-daily. Although MDD has been conven-tionally used, once-daily administration of gentamicin in EID regimens may be preferable because of the increased convenience. In fact, several studies in various clinical set-tings demonstrated that EID was as safe as or safer than MDD, with equal efficacy.5–8 SCD is generally reserved for
patients with serious infections, such as infective endocardi-tis (IE), in which β-lactams or vancomycin is frequently coadministered.9,10
One study in Kuwait revealed that up to 63% of patients were outside the target ranges when an initial gentamicin dose regimen was chosen based on six MDD nomograms.11
Similarly, another study in the USA reported that EID nomo-grams, including the Hartford nomogram, did not achieve the target peak concentration of 20 µg/mL in most patients.12
To the best of our knowledge, no study has ever reported the predictive performance of SCD nomograms. Moreover, although the MDD, EID, and SCD nomograms mentioned above have been widely used for the determination of gen-tamicin dose in Korea, their performances have not yet been systematically reviewed.
Based on this understanding, the objective of the present study was to evaluate the predictive performance of several gentamicin nomograms and dosing guidelines, in Korean patients. To this end, various gentamicin nomograms were ret-rospectively evaluated, by comparing the percentage of patients whose predicted peak and trough concentrations achieved the target therapeutic and nontoxic ranges, respectively.
Materials and methods
subjects
Gentamicin concentrations were deter mined in patients .19 years of age, who underwent therapeutic drug monitoring (TDM) at Seoul National University Hospital
from January 2006 to December 2012. Subjects with one or more sets of paired steady state peak and trough serum gentamicin concentrations, with documented actual sample collection times, were included. Subjects with incomplete demographic data relating to age, serum creatinine, or body weight were excluded. Subjects were also excluded if they were on dialysis or pregnant. Eligible subjects were classi-fied into two infection groups; IE, and infections other than IE (OI). The study protocol was reviewed and approved by the Institutional Review Board at Seoul National University Hospital (approval number 1309-016-518). This study was conducted in compliance with the ethical principles set forth in the Declaration of Helsinki (sixth revised), Good Clinical Practices,13 and other regulatory laws and requirements.
Determination of gentamicin
concentrations
Serum gentamicin concentrations were determined by chemiluminescent immunoassay using the Architect i2000SR (Abbott Laboratories, Abbott Park, IL, USA).14 The precision
for the gentamicin assay was 3.6%–8.2%. The lower limit of quantitation was 0.2 µg/mL.
Dosing nomograms
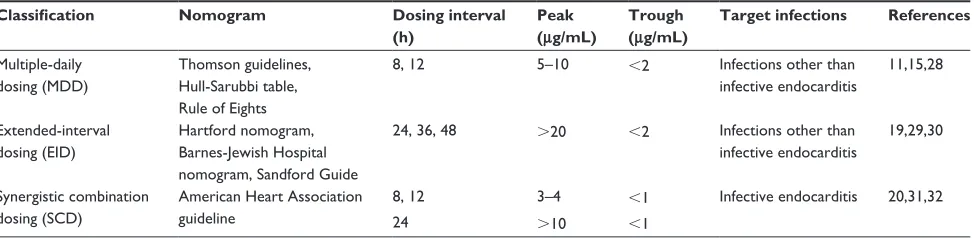
Table 1 shows the MDD and EID nomograms evaluated in OI patients and the SCD nomograms evaluated in IE patients. The following three MDD nomograms were evaluated: the Thomson guidelines, Hull-Sarubbi table, and the Rule of Eights. The Thomson guidelines (Table S1) recommend a dose ranging from 80 to 160 mg, with a dosing interval of 8 hours, 12 hours, or 24 hours, depending on the patient’s creatinine clearance and body weight.15 In the Hull-Sarubbi
table, a loading dose is administered, followed by a mainte-nance dose, at a dosing interval determined by the patient’s creatinine clearance and body weight;16 the dosing chart
shown in Table S2 was used to determine a maintenance dose for each patient in the present study. Lastly, the Rule of
Table 1 Target serum concentrations of gentamicin by nomogram
Classification Nomogram Dosing interval
(h)
Peak (μg/mL)
Trough (μg/mL)
Target infections References
Multiple-daily dosing (MDD)
Thomson guidelines, hull-sarubbi table, rule of eights
8, 12 5–10 ,2 infections other than
infective endocarditis
11,15,28
extended-interval dosing (eiD)
hartford nomogram, Barnes-Jewish hospital nomogram, sandford guide
24, 36, 48 .20 ,2 infections other than
infective endocarditis
19,29,30
synergistic combination dosing (scD)
american heart association guideline
8, 12 3–4 ,1 infective endocarditis 20,31,32
24 .10 ,1
Drug Design, Development and Therapy downloaded from https://www.dovepress.com/ by 118.70.13.36 on 22-Aug-2020
Dovepress Predictive performance of gentamicin nomograms
Eights assigns doses of 1.0 to 1.66 mg/kg to be administered at variable intervals, depending on the patient’s serum creatinine.17 In this study, a median dose of 1.33 mg per
patient’s ideal body weight was chosen. The dosing interval in the Rule of Eights is 8 hours for patients with normal serum creatinine (ie, ,1.24 mg/dL); for those with elevated serum creatinine, dosing is repeated every 8 hours, 12 hours, or 24 hours, selecting whichever is closest to eight times the patient’s serum creatinine level (mg/dL).17 The typical target
peak and trough concentrations for MDD are 5–10 µg/mL and ,2 µg/mL, respectively.14
For EID, the Hartford nomogram, the Barnes-Jewish Hospital nomogram, and the Sanford Guide were evaluated. The Hartford nomogram15 and the Barnes-Jewish Hospital
nomogram18 recommend gentamicin at 7.0 mg/kg and
5.0 mg/kg, respectively, with dosing intervals of 24 hours, 36 hours, or 48 hours, depending on the patient’s creatinine clearance (Table S3). Similarly, the Sanford Guide recom-mends a dose ranging from 4.0 to 5.1 mg/kg, with a dosing interval of 24 hours or 48 hours, based on the patient’s crea-tinine clearance (Table S4).19 The target peak concentration
for EID is .20 µg/mL, higher than that of MDD, while its target trough concentration is the same, ,2 µg/mL.
Gentamicin remains an important therapy, in both the European and American guidelines, for SCD treatment of patients with IE. For example, the American Heart Associa-tion guideline recommended a dose of 3 mg/kg/day, based on the patient’s actual body weight.20 Although MDD has
been widely used for the treatment of IE, recent reports have indicated that once-daily regimens can also be employed.17
In the present study, we chose clinically practical dosing intervals of 8 hours, 12 hours, or 24 hours for the evaluation of SCD nomograms.20 Because other antibiotics are
con-comitantly used with gentamicin in SCD, its target peak and trough concentrations are typically lower than those of MDD and EID, at 3–4 µg/mL (peak) and ,1 µg/mL (trough) for 8-hour dosing, and .10 µg/mL and ,1 µg/mL for 24 hours dosing, respectively. The present study evaluated nomograms for initial dosing only. Additional details of the nomograms and guidelines are provided in Tables S1–S4.
calculation of individual pharmacokinetic
(PK) parameters and steady state peak
and trough concentrations
The Abbottbase® Pharmacokinetic System program
(version 1.10; Abbott Laboratories) was used to derive individual PK parameters and steady state peak and trough concentrations throughout the study.18 The Pharmacokinetic
System program is based on the Bayesian maximum a posteriori method, using a one-compartment linear model.18
Like other Bayesian dose individualization methods, the prior model estimates the population PK parameters of gentamicin as follows:
Vd (L) =0.27 × WT (kg), CV =30%, (1)
CLTB (L/h) = CLR+ CLNR, (2)
CLR (L/h) =0.815 × CLcr, CV =40%, and (3) CLNR (L/h) =0.0025 × LBW (kg), CV =25%, (4) where Vd represents the volume of distribution; CLTB is total body clearance; CLR and CLNR are renal and nonrenal clear-ance, respectively; CLcr is creatinine clearance, calculated using the Cockcroft–Gault equation; WT is actual body weight; LBW is lean body weight,19 calculated for females,
as
LBW = (height - 150 cm) × 0.9 + 45 kg, (5)
or for males, as
LBW = (height - 150 cm) × 0.9 + 50 kg; (6)
and CV is the interindividual coefficient of variation. Based on equations 1–4, individual PK parameters were estimated, taking into account gentamicin concentrations and covariates for each patient.
After individual PK parameters had been estimated, steady state peak and trough concentrations were predicted using the dose-estimator section of the PKS program as follows:
C K
k V
1 e
1 e ,
ss
0
e d
k t
k t
e inf e
=
× ×
−
− ×
− ⋅
− ⋅ − ⋅
( )
( e keτ)
(7)
where Css represents predicted steady state concentration, tinf is the duration of intravenous infusion (30 minutes), K0 is the dos-ing rate, t is the time of concentration measurement after termi-nation of drug infusion, Ke is the elimination rate constant, and the τ is the dosing interval. The steady state peak and trough gentamicin concentrations were the values predicted using equation 7, at the end of intravenous infusion and immediately before the next scheduled administration, respectively.
statistical analysis
SAS software (version 9.3; SAS Institute Inc., Cary, NC, USA) was used for statistical analysis in the present study.
Drug Design, Development and Therapy downloaded from https://www.dovepress.com/ by 118.70.13.36 on 22-Aug-2020
Dovepress
lee et al
Demographic data and individual PK parameters were summarized using descriptive statistics, such as mean and standard deviation. All of the continuous data were first evaluated for normality of distribution by plotting a histogram followed by the Shapiro–Wilk test for normality. The mean values were compared between infection groups (OI vs IE), using the Student’s t-test or the Mann–Whitney U test for normally or nonnormally distributed variables, respectively. The predicted peak and trough concentrations were assessed against the target therapeutic and nontoxic ranges for gen-tamicin, respectively. Predictive performance was then defined as the percentage of subjects whose peak and trough concentrations achieved the target therapeutic and nontoxic goals, respectively. Using the GLLIMIX procedure in SAS, generalized linear mixed models were developed to compare the predictive performance of MDD and EID nomograms in OI patients, and SCD nomograms in IE patients. Furthermore, pair-wise post hoc comparisons were made based on the models, with multiplicity adjusted. A two-sided P#0.05 was considered to be statistically significant.
Results
subjects
Of 703 patients who underwent gentamicin TDM, 524 patients were excluded because: their peak or trough gentamicin con-centrations were not available or were obtained at nonsteady state (n=352); they were ,19 years old (n=64); demographic data were missing (n=65); or they were on dialysis or pregnant (n=43) (Figure 1). As a result, the final analysis population included a total of 179 patients, who were classified into two infection groups: IE (n=84) and OI (n=95). Of these 179 patients, 110 were male and 69 were female. Baseline characteristics, including individual PK parameters, were comparable between the OI and IE patient groups, except that patients with OI were significantly older than those with IE (49 vs 56 years) (P=0.0005) (Table 2).
Predictive performance of nomograms
In the OI group, MDD nomograms generally resulted in a higher percentage of patients achieving the target therapeutic peak concentrations than did EID nomograms (31.9%–72.3% vs 4.3%–45.7%) (Table 3); fewer patients attained the therapeutic target using the Rule of Eight com-pared with the Hartford nomogram. On the other hand, non-toxic target trough concentrations were reached in a relatively large proportion of patients (.80%) by all of the MDD and EID nomograms, although more patients achieved the nontoxic target using EID nomograms than using MDD nomograms
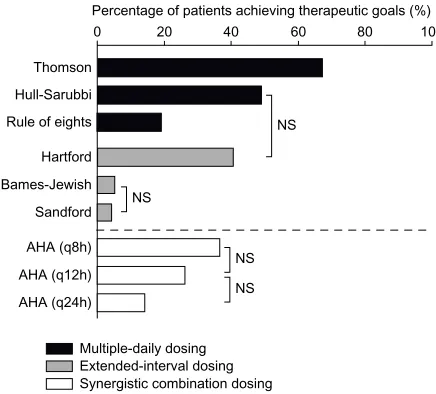
(94.7%–97.9% vs 83.0%–90.4%) (Table 3). Collectively, when assessed against both the peak and trough targets, the Thomson guidelines performed significantly better than did the other nomograms, while the predictive performances of the Barnes-Jewish Hospital nomogram and the Sanford Guide were lowest, at 6.4% and 4.3%, respectively (Figure 2).
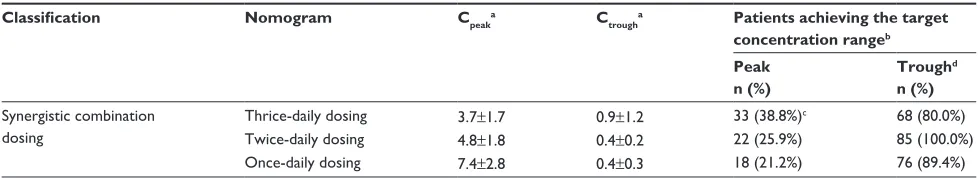
Similar performance findings were noted for the SCD nomograms in patients with IE. For example, the once-daily dosing nomogram resulted in a significantly lower percentage of patients achieving the target therapeutic peak concentrations than did the thrice-daily dosing nomogram (21.2% vs 38.8%) (P=0.0146) (Table 4). A high percentage of patients attained the target nontoxic trough concentration (80.0%–100.0%) (Table 4), and no significant difference was observed between the nomograms in this respect. Together, these data indicated that thrice-daily dosing was associated with the best predictive performance in SCD nomograms, for both peak and trough concentration targets (Figure 2).
Discussion
This study indicated that gentamicin dosing nomograms performed poorly in attaining the intended target peak (therapeutic) concentrations, irrespective of the dosing fre-quency and the type of infection. For example, the percentage of patients who failed to attain the target peak concentrations was .50% for most nomograms, which even increased to .95% for some EID nomograms, such as the Barnes-Jewish Hospital nomogram and the Sanford Guide. However, the target trough concentrations were achieved relatively well by all of the nomograms (80%–100%) (Tables 3 and 4). Furthermore, the percentage of patients whose predicted peak and trough concentrations achieved both the therapeutic and the nontoxic targets, respectively, was ,50% for all of the nomograms, with the exception of the Thompson guidelines, which performed slightly better (67.0%) (Figure 2).
The poor predictive performance of these gentamicin dosing nomograms, particularly in achieving the target peak concentrations, may reflect large interindividual variability in the PK parameters for gentamicin, leading to different tis-sue accumulation and dispositional characteristics between subjects.21,22 Furthermore, the typical population gentamicin
PK parameters can vary depending on the clinical setting. For example, they may be altered in seriously ill patients receiving a great deal of hydration.5,6,23,24 Because the use of nomograms
oversimplifies these differences, poor predictive performance may result, as clearly exemplified in this study. Moreover, given that the peak gentamicin concentrations are likely to be overes-timated due to the longer distributional half-life,22 the predictive
Drug Design, Development and Therapy downloaded from https://www.dovepress.com/ by 118.70.13.36 on 22-Aug-2020
Dovepress Predictive performance of gentamicin nomograms
703 patients, who underwent Therapeutic Drug Monitoring (TDM) in Seoul National University Hospital between January 2006 and
December 2012
352 patients were excluded because their gentamicin concentrations were obtained at nonsteady state or <1 set of peak and trough
351 patients
287 patients
222 patients
65 patients with missing demographic data were excluded
43 patients on dialysis or pregnant were excluded
179 patients
84 patients with
infective endocarditis 95 patients withother infections than infective endocarditis
64 patients aged <19 years were excluded
Figure 1 Flow chart of subject inclusion and exclusion criteria.
Table 2 Baseline characteristics of the subjects (n=179)
Characteristicsa Patients with infective
endocarditis (n=85)
Patients with infections other than infective endocarditis (n=94)
Total patients (n=179)
age (yr) 49±17 56±15 53±17
sex (male/female) 48/37 62/32 110/69
Body weight (kg) 59.0±11.0 62.0±11.0 60.7±11.0
height (cm) 165.4±9.0 165.4±8.4 165.4±8.7
serum creatinine (mg/dl) 1.0 ±0.4 1.0±0.5 1.0±0.4
creatinine clearanceb (ml/min) 80.9±31.0 79.6±31.5 80.1±29.5
individual pharmacokinetic parameters for gentamicin
Total clearance (l/h) 4.2±1.7 4.3±1.6 4.2±1.7
Total volume of distribution (l) 19.6±5.1 17.7±4.1 18.6±4.7
elimination rate constant (h-1) 0.2±0.1 0.3±0.1 0.2±0.1
half-life (h) 4.0±2.9 3.4±1.9 3.7±2.4
Notes: all data are presented as mean ± standard deviation, except for sex. aNo significant difference was found between patients with infective endocarditis and those with
other infections, except for age (P=0.012); bestimated by the cockcroft–gault equation.
Drug Design, Development and Therapy downloaded from https://www.dovepress.com/ by 118.70.13.36 on 22-Aug-2020
Dovepress
lee et al
Table 3 Predictive performance of multiple-daily dosing and extended-interval dosing nomograms in patients with infections other
than infective endocarditis (n=94)
Classification Nomogram Cpeaka
(μg/mL)
Ctrougha
(μg/mL)
Patients achieving the target concentration rangeb
Peakc
n (%)
Trough n (%)
Multiple-daily dosing Thomson guidelines 7.9±2.3 1.0±1.5 68 (72.3%) 85 (90.4%)
hull-sarubbi table 5.5±1.3 1.1±0.9 55 (58.5%) 85 (90.4%)
rule of eights 5.0±1.7 1.3±1.4 30 (31.9%) 78 (83.0%)d
extended-interval dosing hartford nomogram 20.4±4.8 0.4±0.9 43 (45.7%) 89 (94.7%)
Barnes-Jewish hospital nomogram 14.5±3.6 0.3±0.7 6 (6.4%) 86 (95.7%)
The sanford guide 13.1±3.8 0.4±0.8 4 (4.3%) 86 (97.9%)e
Notes:aMean ± standard deviation is presented; bthe target ranges of peak (therapeutic) and trough (nontoxic) gentamicin concentrations were 5–10 µg/ml and ,2 µg/ml,
respectively, for multiple daily dosing; and .20 µg/ml and ,2 µg/ml, respectively, for extended-interval dosing; call pair-wise comparisons, based on a generalized linear
mixed model, were statistically significant, except for the Hull-Sarubbi table vs the hartford nomogram; and the Barnes-Jewish hospital nomogram vs the sanford guide;
dsignificantly lower vs all the extended-interval dosing nomograms; esignificantly higher vs all the multiple daily dosing nomograms.
Percentage of patients achieving therapeutic goals (%) 100 80
60 40
20 0
Thomson
Hull-Sarubbi Rule of eights
Hartford
Bames-Jewish
Sandford
AHA (q8h)
AHA (q12h) NS
NS
NS AHA (q24h)
Multiple-daily dosing Extended-interval dosing Synergistic combination dosing
NS
Figure 2 Percentage of patients achieving the target peak and trough gentamicin concentrations.
Notes: The nomograms investigated were: the Thomson guidelines; hull-sarubbi table; the rule of eights; the hartford nomogram; Barnes-Jewish hospital nomogram; the sandford guide; and the american heart association guideline. Pair-wise comparisons were made among multiple-daily dosing and extended-interval dosing nomograms combined, and synergistic combination dosing nomograms, respectively. all pair-wise comparisons (based on a generalized linear mixed model) were statistically significant, except for those marked as not significant).
Abbreviations: AHA, American Heart Association guideline; NS, not significant; q8h, every 8 hours; q12h, every 12 hours; q24h, every 24 hours.
performance in achieving the therapeutic target can further deteriorate. Therefore, the present study confirmed that TDM is still essential in patients treated with gentamicin.
It is worth noting that the predictive performance of the once-daily dosing nomograms was generally poorer than that of the MDD nomograms with respect to attaining target therapeutic peak concentrations. For example, the percentage of patients who achieved the target peak concentration was only 4.3%–6.4% for the Barnes-Jewish Hospital nomogram
and the Sanford Guide, two of the EID nomograms (Table 3). Likewise, only one-fifth of IE patients achieved the target peak concentration using once-daily dosing, whereas this proportion was increased to almost two-fifths by thrice-daily dosing (Table 4).
In a recent study conducted in patients with IE, once-daily gentamicin dosing was as efficient as twice-daily dosing and did not associate with increased nephrotoxicity.21 In contrast,
the SCD nomograms using once-daily dosing in the present study resulted in only 14.1% of IE patients achieving both the target peak and the target trough concentrations – far fewer than the 36.5% who achieved this using thrice-daily dosing (Figure 2). Because no SCD nomogram takes into account renal function, which plays an important role in gentamicin clearance,25 a new nomogram may be needed in patients with
IE, particularly for once-daily dosing regimens.
We used the Abbottbase PKS system to estimate indi-vidual PK parameters. It employed the Bayesian method, which has performed better than other approaches, such as the traditional two-point Sawchuk–Zaske method.25 The
bet-ter performance of the Bayesian method is possible because it incorporates, not only population-derived PK parameters based on patient demographic data, but also, the dosing his-tory and observed peak and trough serum concentrations to determine individual dosage requirements.26,27
The present study had several limitations. Because of its retrospective nature, the predicted performance of nomograms was not assessed against clinical outcomes, such as treatment success, disappearance of target infections, or development of toxicity. Moreover, a one-compartment model was used in the present study (because blood samples were sparsely col-lected at trough and peak), although gentamicin may behave
Drug Design, Development and Therapy downloaded from https://www.dovepress.com/ by 118.70.13.36 on 22-Aug-2020
Dovepress Predictive performance of gentamicin nomograms
Table 4 Predictive performance of synergistic combination dosing nomograms in patients with infective endocarditis (n=85)
Classification Nomogram Cpeaka C
trougha Patients achieving the target
concentration rangeb
Peak n (%)
Troughd
n (%)
synergistic combination dosing
Thrice-daily dosing 3.7±1.7 0.9±1.2 33 (38.8%)c 68 (80.0%)
Twice-daily dosing 4.8±1.8 0.4±0.2 22 (25.9%) 85 (100.0%)
Once-daily dosing 7.4±2.8 0.4±0.3 18 (21.2%) 76 (89.4%)
Notes:aMean ± standard deviation is presented; bthe therapeutic target ranges of peak and trough gentamicin concentrations were 3–4 µg/ml and ,1 µg/ml, respectively,
for multiple daily dosing (thrice- and twice-daily); and .10 µg/ml and ,1 µg/ml, respectively, for once-daily dosing; csignificantly higher vs the once-daily dosing nomogram
(P=0.0146, a generalized linear mixed model); dnot significant between any pair of nomograms (P=0.8845, a generalized linear mixed model).
following a two-compartment model.27 Another limitation
was that subjects were relatively young, with normal or moderately-altered renal function, which cautions against the generalization of the study results to elderly subjects or to patients with chronic kidney disease. Therefore, future prospective studies employing more frequent PK samplings and various clinical settings are warranted to address all of these limitations.
Conclusion
Most gentamicin dosing nomograms failed to achieve the target peak concentrations, although the Thomson guide-lines performed slightly better than the other methods. New nomograms are needed in IE patients because the current AHA guideline did not predict the therapeutic peak concen-tration effectively, particularly for once-daily dosing. TDM of gentamicin is highly recommended.
Disclosure
The authors report no conflicts of interest in this work.
References
1. Brunton LL, Chabner BA, Knollmann BC. Goodman and Gilman’s Phar-macological Basis of Therapeutics. 12th ed. New York, NY: McGraw-Hill; 2011.
2. Charhon N, Neely MN, Bourguignon L, Maire P, Jelliffe RW, Goutelle S. Comparison of four renal function estimation equations for pharmacokinetic modeling of gentamicin in geriatric patients. Antimicrob Agents Chemother. 2012;56(4):1862–1869.
3. Hilmer SN, Tran K, Rubie P, et al. Gentamicin pharmacokinetics in old age and frailty. Br J Clin Pharmacol. 2011;71(2):224–231.
4. Bourguignon L, Goutelle S, De Saint-Martin JB, Maire P, Ducher M. Evaluation of various gentamicin dosage regimens in geriatric patients: a simulation study. Fundam Clin Pharmacol. 2010;24(1):109–113. 5. Lopez SA, Mulla H, Durward A, Tibby SM. Extended-interval
gentamicin: population pharmacokinetics in pediatric critical illness. Pediatr Crit Care Med. 2010;11(2):267–274.
6. Abdel-Bari A, Mokhtar MS, Sabry NA, El-Shafi SA, Bazan NS. Once versus individualized multiple daily dosing of aminoglycosides in criti-cally ill patients. Saudi Pharm J. 2011;19(1):9–17.
7. Ward K, Theiler RN. Once-daily dosing of gentamicin in obstetrics and gynecology. Clin Obstet Gynecol. 2008;51(3):498–506.
8. Tiwari S, Rehan HS, Chandra J, Mathur NN, Singh V. Efficacy and safety of a single daily dose of gentamicin in hospitalized Indian children: a qua-si-randomized trial. J Antimicrob Chemother. 2009;64(5):1096–1101. 9. Philips BG, Somers VK. Drug Information Handbook for Cardiology.
Washington, DC: Lexi-Comp, Inc.; 2000.
10. Béraud G, Le Moal G, Elsendoorn A, et al. A survey on the use of gentamicin in infective endocarditis. Eur J Clin Microbiol Infect Dis. 2012;31(7):1413–1418.
11. Al-Lanqawi Y, Capps P, Abdel-hamid M, et al. Therapeutic drug monitoring of gentamicin: evaluation of five nomograms for initial dosing at Al-Amiri Hospital in Kuwait. Med Princ Pract. 2007;16(5):348–354.
12. Wallace AW, Jones M, Bertino JS. Evaluation of four once-daily aminoglycoside dosing nomograms. Pharmacotherapy. 2002;22(9): 1077–1083.
13. Verma K. Base of a Research: Good Clinical Practice in Clinical Trials. J Clin Trials. 2013;3(1).
14. Lorian V. Antibiotics in Laboratory Medicine. 5th ed. Philadelphia, PA: Lippincott Williams & Wilkins; 2005.
15. Thomson AH, Duncan N, Silverstein B, Alcock S, Jodrell D. Antimicrobial practice. Development of guidelines for gentamicin dosing. J Antimicrob Chemother. 1996;38(5):885–893.
16. Hull JH, Sarubbi FA Jr. Gentamicin serum concentrations: pharmacokinetic predictions. Ann Intern Med. 1976;85(2):183–189. 17. Lesar TS, Rotschafer JC, Strand LM, Solem LD, Zaske DE. Gentamicin
dosing errors with four commonly used nomograms. JAMA. 1982;248(10):1190–1193.
18. Bailey TC, Little JR, Littenberg B, Reichley RM, Dunagan WC. A meta-analysis of extended-interval dosing versus multiple daily dosing of aminoglycosides. Clin Infect Dis. 1997;24(5):786–795. 19. Gilbert DN, Moellering RC Jr, Eliopoulis GM, Saag MS. The Sanford
Guide to Antimicrobial Therapy 2011. 41st ed. Sperryville, VA: Antimicrobial Therapy, Inc.; 2011.
20. Baddour LM, Wilson WR, Bayer AS, et al; Committee on Rheumatic Fever, Endocarditis, and Kawasaki Disease; Council on Cardiovascular Disease in the Young; Councils on Clinical Cardiology, Stroke, and Cardiovascular Surgery and Anesthesia; American Heart Association; Infectious Diseases Society of America. Infective endocarditis: diagnosis, antimicrobial therapy, and management of complications: a statement for healthcare professionals from the Committee on Rheumatic Fever, Endocarditis, and Kawasaki Disease, Council on Cardiovascular Disease in the Young, and the Councils on Clinical Cardiology, Stroke, and Cardiovascular Surgery and Anesthesia, American Heart Association: endorsed by the Infectious Diseases Society of America. Circulation. 2005;111(23):e394–e434.
21. Matzke GR, Jameson JJ, Halstenson CE. Gentamicin disposition in young and elderly patients with various degrees of renal function. J Clin Pharmacol. 1987;27(3):216–220.
22. Bourguignon L, Goutelle S, de Saint Martin JB, et al. [Interindividual pharmacokinetic variability in long-term antibiotherapy]. Med Mal Infect. 2010;40(1):38–41. French.
Drug Design, Development and Therapy downloaded from https://www.dovepress.com/ by 118.70.13.36 on 22-Aug-2020
Dovepress
lee et al
23. Janušonis T, Mačiulaitis R, Sveikata A, Milašius A, Kregždytė R. Rationality of administered gentamicin dose in cerebral coma patients treated in an intensive care unit. Medicina (Kaunas). 2011;47(2): 79–84.
24. Rea RS, Capitano B, Bies R, Bigos KL, Smith R, Lee H. Suboptimal aminoglycoside dosing in critically ill patients. Ther Drug Monit. 2008;30(6):674–681.
25. Burton ME, Shaw LM, Schentag JJ, Evans WE, editors. Applied Pharmacokinetics and Pharmacodynamics: Principles of Therapeutic Drug Monitoring. 4th ed. Baltimore, MD: Lippincott Williams & Wilkins; 2006.
26. Jelliffe RW, Iglesias T, Hurst AK, Foo KA, Rodriguez J. Individualising gentamicin dosage regimens. A comparative review of selected models, data fitting methods and monitoring strategies. Clin Pharmacokinet. 1991;21(6):461–478.
27. Xuan D, Nicolau DP, Nightingale CH. Population pharmacokinetics of gentamicin in hospitalized patients receiving once-daily dosing. Int J Antimicrob Agents. 2004;23(3):291–295.
28. Sawchuk RJ, Zaske DE. Pharmacokinetics of dosing regimens which utilize multiple intravenous infusions: gentamicin in burn patients. J Pharmacokinet Biopharm. 1976;4(2):183–195.
29. McNamara DR, Nafziger AN, Menhinick AM, Bertino JS. A dose-ranging study of gentamicin pharmacokinetics: implications for extended interval aminoglycoside therapy. J Clin Pharmacol. 2001; 41(4):374–377.
30. Anaizi N. Once-daily dosing of aminoglycosides. A consensus document. Int J Clin Pharmacol Ther. 1997;35(6):223–226. 31. Buchholtz K, Larsen CT, Schaadt B, Hassager C, Bruun NE. Once
versus twice daily gentamicin dosing for infective endocarditis: a randomized clinical trial. Cardiology. 2011;119(2):65–71. 32. Habib G, Hoen B, Tornos P, et al; ESC Committee for Practice
Guidelines. Guidelines on the prevention, diagnosis, and treatment of infective endocarditis (new version 2009): the Task Force on the Prevention, Diagnosis, and Treatment of Infective Endocarditis of the European Society of Cardiology (ESC). Endorsed by the European Society of Clinical Microbiology and Infectious Diseases (ESCMID) and the International Society of Chemotherapy (ISC) for Infection and Cancer. Eur Heart J. 2009;30(19):2369–2413.
Drug Design, Development and Therapy downloaded from https://www.dovepress.com/ by 118.70.13.36 on 22-Aug-2020
Dovepress Predictive performance of gentamicin nomograms
Supplementary material
Table S1 Thomson guidelines
CLcra (mL/min) Weight (kg)
40–49 50–59 60–69 70–79 .80
20–29 80 (24) 100 (24) 100 (24) 120 (24) 120 (24)
30–39 100 (24) 100 (24) 120 (24) 120 (24) 140 (24)
40–49 80 (12) 100 (12) 140 (24) 140 (24) 160 (24)
50–59 100 (12) 100 (12) 120 (12) 120 (12) 160 (24)
60–69 100 (12) 120 (12) 140 (12) 140 (12) 140 (12)
70–79 120 (12) 140 (12) 140 (12) 140 (12) 160 (12)
80–89 140 (8) 140 (12) 140 (12) 160 (12) 160 (12)
90–99 140 (8) 140 (8) 160 (8) 160 (8) 180 (12)
.100 140 (8) 160 (8) 160 (8) 160 (8) 180 (12)
Notes: The table shows dose (mg) and dosing interval (8, 12, or 24 h) determined from the patient’s weight and creatinine clearance (clcr). aestimated by the cockcroft–
gault equation.
Table S2 hull-sarubbi table
CLcra (mL/min) Percentage of LDb
to use for MD
Dosing interval (h)
.90 84 8
80 80 8
70 76 8
60 84 12
50 79 12
40 72 12
30 86 24
20 75 24–36
,20 give lD ×1, then check random level(s) Notes:aestimated by the cockcroft–gault equation; bloading dose (lD) (=2 mg/kg
of dosing weight) is first determined, and maintenance dose (MD) and dosing interval is consequently selected based on patient’s creatinine clearance (clcr).
Table S4 The sandford guide nomogram
CLcr (mL/min)a Dosing regimen
Dose (mg/kg) Dosing interval (h)
$80 5.1 24
60–79 4.0 24
40–59 3.5 24
30–39 2.5 24
20–29 4.0 48
Note:aestimated by the cockcroft–gault equation.
Abbreviation: clcr, creatinine clearance.
Table S3 hartford and Barnes-Jewish hospital nomograms.
Nomogram Gentamicin
dose (mg/kg)
Dosing interval (h)
CLcra$60 mL/min CLcra 40–59 mL/min CLcra$20–39 mL/min
hartford nomogram 7 24 36 48
Barnes-Jewish hospital nomogram 5 24 36 48
Note:aestimated by the cockcroft–gault equation.
Abbreviation: clcr, creatinine clearance.
Drug Design, Development and Therapy downloaded from https://www.dovepress.com/ by 118.70.13.36 on 22-Aug-2020
Drug Design, Development and Therapy
Publish your work in this journal
Submit your manuscript here: http://www.dovepress.com/drug-design-development-and-therapy-journal
Drug Design, Development and Therapy is an international, peer-reviewed open-access journal that spans the spectrum of drug design and development through to clinical applications. Clinical outcomes, patient safety, and programs for the development and effective, safe, and sustained use of medicines are a feature of the journal, which
has also been accepted for indexing on PubMed Central. The manu-script management system is completely online and includes a very quick and fair peer-review system, which is all easy to use. Visit http://www.dovepress.com/testimonials.php to read real quotes from published authors.
Dovepress
Dove
press
lee et al
Drug Design, Development and Therapy downloaded from https://www.dovepress.com/ by 118.70.13.36 on 22-Aug-2020