Article
1
A Real-time Geo-Resilience Support Paradigm for
2
Regional
Infrastructure
Sustainability
using
3
Synthetic DADO Machine Architecture
4
Hasan Tariq 1.*, Farid Touati 1, Mohammed Abdulla E. Al-Hitmi 1, Damiano Crescini 2 and Adel
5
Ben Mnaouer 3
6
1 Department of Electrical Engineering, College of Engineering, Qatar University, 2713, Doha, Qatar;
7
[email protected] (H.T.); [email protected] (F.T.); [email protected] (M.A.E.A.-H.)
8
2 Brescia University, 25121 Brescia, Italy; [email protected] (D.C.)
9
3 Canadian University Dubai, Dubai, UAE; [email protected] (A.B.M.)
10
* Correspondence: [email protected]; Tel.: +974-50419852
11
12
Abstract: Swift and diligent resilience response is mandatory in sustainable geo-distributed
13
ecosystems. The real-time geo-spatial resilience requires agility in millions of parallel and
14
distributed data processing tasks on data acquired from regional condition monitoring(RCM)
15
systems. These tasks include expiditous resolution of complex sustainability conflict sets, promptly
16
anomalies characterization in chaos sets, and resilience response uniqueness. This work is an
17
archetype of a paragon geo-resilience support system(GRSS) for regional sustainability using a
18
novel melioration in DADO production machine. The proposed expert system capitalized the
19
synergic strengths of RETE, TREAT, LEAPS and GATOR networks was designed and implemented
20
as a synthetic DADO machine(SDM). The generic architecture of DADO machine was improved in
21
this work by enrichment in rule set conditions and solution set for regional scale resilience rule set
22
conditions. The condition left-hand side(LHS) X equal to the solution set 2X for right-hand side
23
(RHS) was the goal achieved by working memory(WM) optimization and conflict resolution
24
strategy(CRS) in alpha and beta networks rules. A round-trip time of 80.2 seconds for first event
25
response set using 1492 segment size and sequence number 360,000 with maximum packets at a
26
single geospatial structure was 21 packets/sec was a noticeable landmark in this work. LEAPS and
27
Concurrent-read algorithm for GATOR cluster networks in the proposed synthetic DADO machine
28
architecture was the overall implementation that enabled urban scale resilient system practically
29
possible on physical SHM deployment.
30
Keywords: Sustainability; geo-resilience support system(GRSS); chaos sets; structure health
31
monitoring (SHM); DADO machine; RETE; TREAT; LEAPS; GATOR; Internet of Things (IoT)
32
33
1. Introduction
34
Chronological and random natural disasters occurring across the globe have a vital impact [1]
35
on state-level infrastructure safety and sustainability. The desultory chaos and disasters have a
36
direct impact on regional [2] economics, and future investment plans irradiating need for GRS to
37
stipulate the regional sustainability. The sustainable development efforts were observed using the
38
GDFI-Simulator [3] for Africa, America, Asia, Europe and Oceania in the 19th and 20th centuries.
39
The GDFI-Simulator work for resilience epitomized gaps as real-time resilience system architecture
40
requirement to optimize the trade-offs in regional development and sustainability matrix. The
41
community resilience indicators for assessing the urban community resilience in Malaysia [4] was a
42
substantial effort and a nascence for brisk global resilience systems(GRS). The risk interpretation and
43
action framework for responses to natural hazards review and the role of urban actors to coordinate
44
and contribute to sustainability [5] depicted a need for an integrated and enmeshed GRS.
45
In regional sustainability literature, a momentous rapture for GRSS in [6] was based on the
46
meta-analysis of an etymological journey in resilience and disaster risk reduction from 1973,
47
illuminated 38 cases with an obligation of dexterous GRSS. The urban resilience through regional
48
adaptability [7] was demonstrated with systems of systems gap. The theoretical and empirical
49
perspectives explained in [8] need to be formulated in the form of a reference model for resilience
50
systems design. The mapping of nine narratives M1, M2, M3, N1, N2, N3, CT1, CT2 and CT3 in
51
figure 1 [9] were very practical resilience design markup but still craved artificial intelligence and
52
standardized geo-spatial sensing capabilities. The life sustainability and assurance elevated in [9] for
53
disaster resilience created an obligation for usage for infrastructure safety systems as reality towards
54
sustainability against natural calamities. This created an opportunity for infrastructure health
55
monitoring systems i.e. SHM sensing capabilities as a sustainability assessment tool for rapid
56
resilience response in GRSS as reliable RCM system.
57
The SHM system reference architectures developed on Imote2 platform and boards SHM-H
58
and SHM-A in [10] and SHM-S and SHM-DAQ in [11] could serve as RCM tools if aided with
59
inference engines(IE) and big data manipulation support. Recently, building information
60
modeling(BIM) based approach by utilizing sensor data [12] gathered from actual construction
61
projects craved for an expert system(ES) capability to assist GRSS. Moreover, this approach had
62
lacked dynamic data buffering and interpretation framework for bridging BIM and sensor networks
63
[13] through an IE to assist GRS. Likewise, finite element analysis(FEA), finite element
64
modeling(FEM), and wireless sensor networks(WSNs) based analysis and methods were thoroughly
65
compared [14] using the results of a structural analysis software through ABAQUS simulation
66
mechanism. These methods did not feature alarms for anomalies due to the absence of IE. In all these
67
WSNs [14-16] type of researches, the gap of an inference engine with IF-THEN rules for bounded
68
value conditions as well as network integrated GRSS was observed.
69
The real-time data processing capabilities observed in the inter-storey test-bench based design
70
and implementation approach [17, 18] using a system of remote monitoring sensor nodes being
71
analyzed through a personal computer need to be framed as GRSS. This approach lacked parallel
72
computing architecture for complex chaos sets matching cases and rules conflict resolution. An
73
effort [19] that explored new horizons was an infrastructure comprised of TinyOS based sensors
74
nodes running TinyOS Network Simulator(TOSSIM) a PC running Mathworks Matrix
75
Laboratory(MATLAB) for data analysis and simulation. It was very effective in many aspects but
76
still lacked expert system system architecture and work memory optimization. The passive gateway
77
based approaches [20] using smart sensor nodes i.e. COTS+ [21] needed integration of the expert
78
system for anomaly detection and resilience response generation.
79
A plethora of approaches was observed in recent years for regional sustainability and resilience
80
automation. Information bank-based data gathering and application Bayesian networks [22] had
81
limitation from sustainability prospect. The resilience of coupled human–digital environment
82
systems by capitalizing SVIDT [23] method required regional infrastructure data incorporation and
83
intelligent architecture addressed in this work. The SVIDT proposal required matching algorithms
84
for event classification and handling. The Big data trends and vision for sustainability [24] of critical
85
infrastructures and resilience methodologies needed to be backed by updated and realtime
86
characterization and conflict resolution implmentation. The work proposed in [25] concluded that
87
the AI matching algorithm RETE needed bigger working memory and α and β network hierarchy
88
for solution space, TREAT needed an only α network. LEAPS algorithm as a superset of strengths of
89
RETE and TREAT rule-based matching algorithms was more suitable but created a gap at state-level
90
sample spaces i.e. LHS and solution side i.e. RHS where rules space caused big conflict sets. Trisolda,
91
the environment [26] with TriQ RDF query language for semantic data processing and natural
92
speech processing [27] could serve as a tangible tool in urban sustainability and resilience by
93
interfacing with some expert systems as well as condition monitoring sensing platform.
The state-level scalable infrastructure created and implemented in [28] needed to be integrated
95
with a bi-variable sensing mechanism for 50+ km safety assessment in [29] for regional canvas. The
96
work [28] also required applications and optimization by distributed computing [30] capabilitiy of
97
DADO machine architecture. The DADO machine enrichment in [31] could multiply the resilience
98
performance of [32] agent centered model(ACM) and infrastructure centered model(ICM) for IoT
99
and internet of everything(IoE) based scalable and sustainablility solutions. The conflict sets(CS)
100
resolution in GRSS using dynamic programming(DP) with the GATOR [33] approach for
101
sustainability applications of [34, 35] SHM-UCM could serve a reliable source of real-time
102
geo-resilience.
103
Furthermore, regional sustainability intents observed in [1-35] had the gaps in physical and real
104
application centered GRSS design and implementation. The regional sustainability based on cost
105
metrics utilizing MOSPA in SHM-UCM [34] with geo-analytics capabilities would have been a huge
106
service to geo-resilience by integarion with DADO machine as GRSS core. The improvement in
107
limitations of [34, 35] has been accommodated in this work by improving the system architecture
108
from regional sustainability [36] prospect by RSS i.e. SURFmap. This work is the proposition of a
109
physical geo-resilience support system architecture(GRSSA) implemented using a novel synthetic
110
SDM system prototype as GRSSA-SDM, discussed in two sections:
111
1. Real-time Geo-Resilience Support System Architecture
112
2. Synthetic DADO Machine System Design
113
In section 2, the conceptual real-time geo-resilience was actualized by symbiosis of (i) millions
114
of geospatial infrastructure health or condition monitoring sensors nodes processed as packets of
115
multi-variable time-series (ii) thousands of real-time parameters computed on the go from
116
time-series variables inferred as anomalies in abnormal conditions as acknowledgement from
117
cyber-physical geo-resilience system (iii) hundreds of chaos sets inferred from characterization of
118
anomalies time vectors (iv) hundreds of mutually exclusive beliefs sets inferred from chaos sets (v)
119
hundreds of rules trees derived from belief functions updates segregated as rule networks
120
achnkowledged as packet sequence numbers (vi) geo-resilience response generation by parallel
121
computation of rule networks resolution (vii) geo-resilience rendering as feedback to confirm
122
regional sustainability by scanning the runtime anomalies. This all sequence required super fast
123
problem solving architecture based on a real machine capable of handling huge data rates and
124
integrity constraints to ensure trust worthy alarms in the nick of seconds termed as SDM.
125
In section 3, The phycial SDM system consisted of three blocks. In the first block, the SHM
126
specialized sensor node clusters collected data from remore locations and filtered primary anamolies
127
associated with electronics and communication behaviors. The node clusters were coupled at a zonal
128
sustainability specialized system on chip(SoC) to perform tasks (i), (ii), and (iii) as distributed
129
computing edge device with shared working memory support. In the second block, the regional
130
sustainability specialized gateway(RSG) collected task (i), (ii), and (iii) results from shared memories
131
of connected SoCs and implemented tasks (iv), (v), and (vi) as parallel computing edge device with
132
public shared memory pool(PSMP). The third block was a virtual private server(VPS) hosted on a
133
desktop or Laptop PC that had access to PSMP. The VPS loaded the results from remote PSMPs and
134
performed tasks (vi) and (vii) globally to verify the unique resilience responses for events.
135
In section 4, a case study is presented with a practical implementation at the campus level that
136
demonstrated the regional sustainability assurance capabilities of GRSSA and real-time data
137
processing capabilities of SDM in Qatar University, Doha.
138
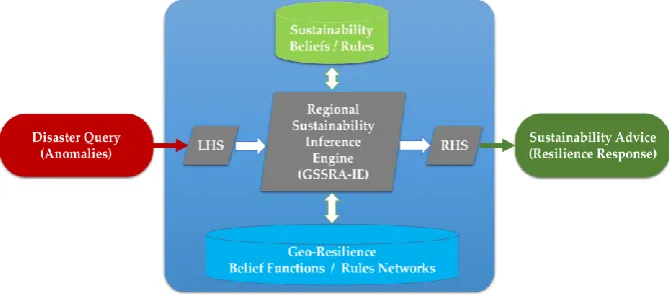
2. Geo-Resilience Support System Architecture
139
A Resilience Support System (RSS) is an expert system that works on the principle of
140
Belief-Rule (BR) deductive logic called IF-THEN operations; for example, if temperature T is 38 °C
141
then weather is hot. The intersection of multi-event confidence intervals is termed as degrees of
142
belief; if T is 38 °C and humidity H is 75% in five days. The belief is: for all T > 37 °C implies that H >
70%. from belief function fbelief(H/T) = (75/38) = 1.973 ⇒ H = (1.973)T. The belief is computed against
144
similarity or matching all the possible combinations of events; if the temperature is between 0°C to
145
20°C then humidity should be between 5% to 25%; if the temperature is 20°C to 35°C then humidty
146
will be 25% to 55%. A belief is based on belief function i.e. fbelief(H/T) = (75/38) = 1.973 ⇒ H = (1.973)T
147
derived from mathematical and logical relationships. In real world applications, there can be more
148
than single a belief function according to Dempster-Shafer evidence theory. There has to be a unique
149
belief function for every global event as a function of dependent variables.
150
At regional, zonal or city level there exist thousands of multi-sensors systems that have to
151
justify the truthfulness in evidence of different events. The deviation of these events from
152
sustainability belief functions and absence in resilience rules memberships is termed as “anomaly”.
153
A set of unresolved anomalies are termed as “chaos sets” i.e. no belief function and no rule
154
memberships exist means zero conflict support; leading to an uncontrollable event. If there are two
155
belief functions for the same anomaly and event there rises a condition called “conflict”, and set of
156
all such conditions is called “conflict set”. There must be rules to resolve conflict sets called “conflict
157
support” and rules to resolve conflicting rules are called “resolution support”. The quick anomaly
158
detection, as well as belief function update, are mandatory for runtime sustainability goals. The
159
conceptual model for global sustainability through GRSSA is given in figure 1 as a big picture.
160
Figure 1. Simplified Conceptual Layout of GRSSA in the big picture
In figure 1, LHS as geo-acquistions and RHS as geo-response generated by proposed
161
geo-resiience paradigm. Real-time sustainability is only possible due to rapid resilience response
162
conceivable by application of discrete mathematics and decision-trees based mechanism instead of
163
machine learning methods. In the machine learning approach, the computation of mathematical
164
relationships needed artificial neural networks (ANN) that required training at first and then the
165
generation of relationship functions. Training mechanisms were not feasible [36] for real-time
166
applications as training a model takes time. This work proposes matching algorithms based rules
167
engine approach that saves historical computations and works on meta-heuristics of deductive logic
168
decision trees(DLDTs). The DLDTs are based on combinations of anomalies or event transitions like
169
a chess game winning move problem.
170
Let t be the time vector for time-series variables as a set of Vectors V with n variables in a
171
multi-sensing monitoring system with heterogeneous data rates D, vector V is given as a function of
172
time.
V(n, t) = {V1(n1, t1), V2(n2, t2), V3(n2, t2), ….. Vn(nn, tn)} (1)
There exist abnormalities or anomalies as a set A= {A1, A2, A3, …. An} in real-time magnitudes M
174
that have an unacceptable difference of ΔA from normal or safe values N ensuring sustainability. Let
175
us say M>N or M<N in range a = ±10% from recent value is written as:
176
ΔA(V(n1, t1), V(n2, t2)) = (M-N)/N ∀ ΔA ϵ [-0.1,+0.1] = {a | -0.1 ≤ a ≤ +0.1} (2)
Each combination of ΔAs is called chaos set C = {C1, C2, C3, …. Cn}. Let Ci be the instantaneous
177
chaos set at instant i may or may not be member of C. The similarity in Ci and Vi is called belief
178
function f(β) and Ci and C as conflict set according to argumentation or conflict support rule R. All
179
the members of C and should be mutually exclusive to characterize a unique event and generate
180
unique resilience response RRSS. For every event, in V and A relationship, there has to be a conflict
181
support SC and resolution support for SR at time t for confidence interval I. The rule model for a
182
real-time BR expert system for an isometric monitoring system is given as:
183
The value of I for SR is dependent on belief degree of accurate event management βk with a
184
referential value i and belief update for R is given by the equation:
185
βn(in+1) = βn(in) x {I(in+1)/I(in)} for i = (0, 1, 2, .. t-1) (4)
Every βk has any one of the five severity levels, i.e. HH=High-High, HL=High-Low,
186
M=Medium, LH=Low-High, and LL=Low-Low in a single conditional membership. If the new βk(t)
187
has I(t) > I(t-1) i.e. more confidence interval than previous it will replace the older degree of belief.
188
This model works on all the data streams of isometric condition monitoring systems or all SHMs
189
with same architecture, i.e. identical sensor types, number of nodes, polling rate or sampling rate,
190
and communication infrastructure that can rarely happen at regional level due to variety of vendors
191
and solution providers and terms of service level agreements(SLAs).
192
In realistic geo-resilience scenarios, there is heterogeneous sensing, heterogeneous
193
communication, and most importantly heterogeneous CPU and memory configurations, in this case,
194
the equations 1 to 4 will confuse the entire GRSSA. Let us modify the mathematical model for
195
geo-resilience. Let D be set of all the data-rates at the core where all SHM systems converge such that
196
D = [1 bit/second, 10 Gigabit/second]. The number of mutually exclusive communications buses be a
197
set B with packet structure BPacket for every unique SHM uplink. Let US be a unique set of regional
198
structures deployed with V-SHM as a unique cluster or set of sensors variables in V sent through B.
199
Let SHM-SENSOR be a unique set of sensors. Let the number of real-time state variables for a unit
200
geo-event be GRss(STATE) for a single SHM cloud and given as:
201
GRss(STATE) = DCB x USCV-SHM x VCSHM-SENSOR (5)
The set of four equations 1 to 4 need to be framed as combinations i.e. systems of systems. In
202
geo-resilience solutions, the milestone is to estimate the bottlenecks as:
203
1. The maximum number of regional anomalies with respect to the maximum number of packets
204
PN, given as:
205
PN = { Size(GRss(STATE)) + Size(ΔA)} / Size(BPacket) (6)
2. The round trip time(rrt) Tβ for belief function update for a respective geo-event is the difference
206
between the time to send(TTS) first chaos set member ΔA to a matching algorithm in DADU
207
machine and conflict resolution for last belief function by GATOR network in DADO machine,
208
given as:
209
Tβ = {TTS(ΔA) - TTR(SRn (βn(t-1))} (7) SRn(t) =
{
If V has A in n(N,t) = (0, 1, 2, … N) and a = (0, 1, 2, … t) at I for ∀ Ciϵ V (3)
3. The maximum throughput TP is achieved to satisfy minimum time Tβ to generate a unit
210
geo-resilience response by GATOR network. In the proposed design, it is computed as the size
211
of the sum of all anomalies or one complete chaos set transferred to DADU machine working
212
memory divided by unit Tβ at an instant, TP is given as:
213
TP = size{ƩiΔA(i)} / Tβ (8)
TP = size{C}/ Tβ (9)
4. The sequence or ticket numbers for every networked community alarming system based on
214
different standards for specific area anomaly localization is used by local authorities. In this
215
work, a sequence number mechanism has been used that has a range of [0, 232 –1]. The least
216
magnitude of Tβ for least sequence number is the ideal most condition for RSS. The maximum
217
allowed sequence number is 232. The overall SHM cloud dashboard is displayed after this step.
218
The percentage health H of structures is computed as the number of variables NV divided by the
219
number of classified anomalies NA multiplied by 100 and is given as:
220
H(%) = (NV / NA) x 100 (10)
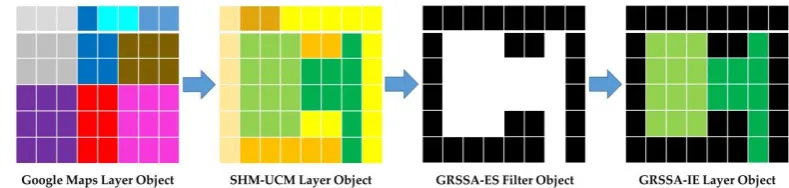
5. The live geo-analytics is the most popular tool used by local authorities is another visualization
221
that expert systems use to assist the decision making. A simple binary operation has been used
222
in this work i.e. load Google Maps frame in matrix G and subtracts it from Matrix RSS with
223
geo-spatial coordinates of areas or structures with nodes having sequence numbers > 216. The
224
empty SRn(t) computed as matrix RSS-IE or GRSSA-IE, let it be termed as “condition zero”. The
225
GRSSA-IE layer is updated at every unit resilience response as shown in figure 2.
226
Figure 2. GRSSA-ES Adaptive Filter Subraction Process Block Diagram
The safe area on the map with active resilience will be green and waiting will be bordered green
227
with GRSSA computation is progress and unrecoverable as black. Geo-spatial images are
228
treated as matrixes with selected latitude and longitude bounds with each patch as a pixel for
229
the respective color model used e.g. RGB, CMY, etc. The matrix operation subtraction needs
230
same dimensions as R for row and C for column given as:
231
GRSSA-IE(Layer)[RxC] = G(Layer)[RxC] – RSS(Layer)[RxC] (11)
Based on the mathematical model, we needed to design a precise architecture that had the
232
potential of accommodating big data of rules and belief sets. The state-level parameters of GRSSA
233
controlled the cost and time of disaster recovery while keeping the utility computing system [33] at
234
optimum performance. The proposed GRSSA comprised of 3 layers of conceptual frameworks
235
working in hierarchy given as:
236
1. SHM-GRSSA Interaction Block Conceptual Framework(SRIB-CF)
237
2. GRSSA-SDM Resilience Expert System Block Conceptual Framework(RESB-CF)
238
3. GRSSA-SDM Resilience Response Block Conceptual Framework(RRB-CF)
239
The geo-processing model for GRSSA is given below in figure 3.
Figure 3. Detailed Conceptual Layout for GRSSA utilizing the proposed SDM
Figure 3 illustrates that the existing geo-spatial condition monitoring systems deployments
241
were used by proposed GRSSA and SDM. The sustainability assessment is entirely based on
242
real-time sensing variables. Following are the diagrammatic conventions used in figure 1 and 3:
243
• The word N is a natural number i.e. number of globally existing units.
244
• The dotted rectangles refer to the variable number of units and tasks in GRSSA.
245
• Dotted arrows show that they can be pointing to different units according to runtime
246
conditions.
247
• The light gray rectangles with round edges are for sub-sections with no further processing in
248
every major block, i.e. deployments, sensor variables, zonal buffer zone, regional buffer zone,
249
event response, and sustainability.
250
• The light blue rectangles with round edges are RTL block sub-sections.
251
• The light green rectangles with round edges are IoT GATOR block sub-sections.
252
• The dotted black rectangle for GRSSA-SRIB.
253
• The dotted blue rectangle refers to the entire GSSRA-RESB.
254
• The dotted green rectangle is GSSRA-RRB
255
• The biggest arrow in figue is the black arrow at the top is for feedback i.e. restart the entire
256
sequence.
257
Figure 3 is further explained stepwise in later sections with inner details.
258
2.1. SHM-GRSSA Interaction Block Conceptual Framework
259
The SHM-GRSSA data model was the step zero in the form of a standard entity-relation(ER)
260
diagram in figure 4 for SHM and SDM integration for GRSSA implementation. The GRSSA interactd
261
with the physical world with this block. The entire SHM ecosystems with structures, areas where
262
structures were located on the map, type of structures, sensors categories for a specific strucuture,
263
and sensors variables were the core fields with 4 entities. The first obligation for GRSSA was
264
geo-data sources that were LHS to feed the expert system as a problem domain accomplished using
265
SHM systems installed at remote zones. The sensor data was gathered in a single database file using
266
SQLite database client on site SoC modules from all the connected SHM system nodes. In figure 4, it
267
can be seen that initially, the input buffer is 36 attributes of 4 entities i.e. projects, SHM, Structures
268
and Sensors-Grid of data rate 36 x data type size i.e. int, string, text, and date-time with minimum
269
data rate requirement of 512kbps. The tables were designed for operational optimization of RSS so
270
that every client does its job and keep the server dedicated to critical jobs also. This was for one site
271
i.e. one structure in a zone and region that contributed LHS. The ER model enmeshed all the SRIB
272
zones attributes.
Figure 4. ER Diagram of SHM-GRSSA Interaction Block (SRIB) Prototype Database
In the ER diagram in figure 4, the zone level tasks (i), (ii), and (iii) were executed by
274
GRSSA-SDM site block as shown in figure 8 and region level tasks (iv), (v), and (vii) were performed
275
by the gateway as shown in figure 10.
276
2.2. GRSSA-SDM Expert System Block Conceptual Framework
277
The systematic and summarized work flow of a rule and knowledge base expert system is given
278
in figure 5 in the light of GRSSA-SDM realization. The first step is the "Disaster Query" as real-time
279
sensor variables enquired if there are anomalies or not. SHM inference engine is a perception engine
280
i.e. rules and knowledge based program that processes the sensor data. It consists of a set of beleifs
281
and rules in the form β0 to βk for all R0 to Rn for S0 to Sm where R is the set of clauses of n possibilities
282
of the relationship of problem database and S is the set of actions or commands to update the
283
existing database for a given βk(t). The "Sustainability Advice" as resilience response is the last step
284
as well as the desired goal to be achieved.
285
Figure 5. Simplified GRSSA-SDM ES Conceptual Frameowork
In figure 5, a regional sustainability inference engine can be observed that is the heart of
286
GRSSA-SDM expert system. In this work, a novel inference engine has been proposed that is
287
composed of two blocks as:
288
1. GRSSA-SDM Matching Alogorithms or RETE-TREAT-LEAPS(RTL) Block
289
2. GRSSA-SDM Resilience Network Control or IoT GATOR Block
290
291
These two blocks are explained in detail their respective sections.
2.2.1. GRSSA-SDM Matcthing Algorithms or RETE-TREAT-LEAPS Block
293
In inference engine, each R is a rule network to reflect a unit relationship, i.e. can be constants
294
and variables. Constants are evaluated directly by just SELECT command and JOIN is used for
295
variable relationships. The operations of the inference engine (IE) proceed by evaluating one R at a
296
time and then cyclic workflow.
297
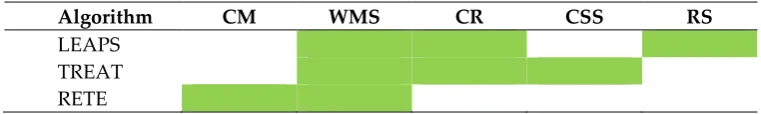
The state information of a matching algorithm was evaluated as a condition of
298
membership(CM), WMS, condition relationship(CR), conflict set support(CSS) and resolution
299
support(RS) for details please see the table below from [12].
300
Table 1. State Information of Matching Algorithms in LH
301
Algorithm CM WMS CR CSS RS
LEAPS TREAT RETE
Table 1, clarified that RETE is a strong initiator, LEAPS is a good finisher and TREAT has
302
smaller memory requirements in event management problems. Cascading these three algorithms to
303
make a RETE-TREAT-LEAPS (RTL) block as part of a single algorithm can lead to better results. An
304
efficient RTL block can be constructed from CM capabilities of RETE and joint WMS block to extract
305
the best rule and CR intersection to find the best CSS set for RS.
306
Figure 6. Comprehension of GRSSA-ES Inference Engine Working Principal
In figure 6, the gradient ΔA is introduced as a function of Newton Forward Difference(NFD)
307
method to track the difference between past and present sensor values. If this difference is
308
incremental means that probability of anomaly is high. The first segment of the RTL block is only
309
triggered if either anomaly is detected or gradient is rising. If CM functions are not having the
310
appropriate set of beleifs and rules then the knowledge base or buffer zones are searched searched,
311
i.e. WMS and PSMP. The WMS created is dynamically accessed by TREAT and LEAPS as shared
312
memory using concurrent read algorithm inside the RTL block. The WMS in figure 6 is created for
313
every single anomaly. The complete anomaly vectors are generated from sensor data using β0 to βk
314
and later are transformed into chaos sets on the basis of R networks and stored in WMS. All the
315
geo-spatially created WMSs are loaded into IoT PRL PRAM for IoT GATOR block.
316
2.2.2. GRSSA-SDM Resilience Network Control or IoT GATOR Block
317
In IoT GATOR block, conflict support and response support is provided for response authentic
318
generation. The chaos sets in IoT RTL PRAM may have similarities, if exist are resolved by GATOR
network controller(GNC) presented in figure 7. All the regional sustainability conflicts are and event
320
response block with N nodes, all running in parallel to generate unique resilience response against
321
unique anomalies as shown in figure 7. All the WMSs are accessed in parallel flow by IoT RTL
322
PRAM to feed the GATOR network controller(GNC) that generates interlocked event responses. In
323
figure 7, the IoT GATOR block diagram shows that all RTL blocks from individual cities have their
324
respective WMS areas mapped into zonal WMS that is shared with IoT RTL programmable RAM.
325
The components zonal WMS and IoT TRL PRAM are acting as a private buffer zone for zonal
326
sustainability computed from regional data.
327
Figure 7. GRSSA-ES IoT GATOR Block Diagram for RRB
Every WMS in figure 7 is connected to WMS in figure 6. The Zonal WMS is a single memory
328
buffer with all the RTL WMS results as an anomaly. The matching anomalies vectors from figure 4
329
are transformed in chaos set. The rule networks and chaos sets are the hubs of all the rules and
330
information models master storage that governs the decisions of the inference engine.
331
2.3. GRSSA-SDM Resilience Response Block Conceptual Framework
332
The RRB consists of shared WMS access block,
333
The Working memory (dynamic and volatile runtime storage) has the selected variables, rules
334
and algorithms that apply to an instantaneous case or situation only for that specific time.
335
Figure 8. Description of GRSSA-ES interaction with the physical world; a) acquiring regional data from a region of 3 cities with urban scale SHM deployments, and b) generating a geo-response for regional sustainability. This layout is for Qatar as a modelled example.
In figure 8, the proposed overall GRSSA-SDM ES is displayed from LHS to RHS i.e. real-time
336
sensing to resilience response using urban SHM sites and enabling technologies respectively.
3. Synthetic DADO Machine System Design
338
DADO is a mega-scale parallel machine designed to support the swift execution of expert
339
systems, as well as multiple, independent expert systems. The proposed SDM based on dual IE
340
concept of the deterministic and comparitive model was implemented in GRSSA. The conceptual
341
block diagram of the proposed GRSSA is shown in figure 3 was running on the SDM. Data
342
processing, AI and machine learning algorithms operate in this inference engine. Real-time rules for
343
operators and operands are being handled through working memory and hierarchy using layers of
344
networks. Rules & SHM definitions are being adopted from the SHM knowledge base unit. SDM has
345
two major sections the hardware or physical section and software section given below:
346
1. GRSSA-SDM Hardware Section.
347
2. GRSSA-SDM Software Section.
348
The sections are comprehended below.
349
3.1. GRSSA-SDM Hardware Section
350
The GRSSA tasks are executed on a physical system with three blocks given below:
351
• GRSSA-SDM Remote Block
352
• GRSSA-SDM Site Block
353
• GRSSA-SDM Cloud Block
354
Each block is explained with detail in the sections mentioned below.
355
3.1.1. GRSSA-SDM Remote Block
356
It consists of two layers RPi3 out-surface board (OSB) and CAN-Open sensors nodes, which
357
consist of MMA8451Q(14-Bit Accelerometer) and STM32F10RBT6(32-Bit microcontroller with
358
CAN-Open Transceiver). This is block performs geo-acquisition task presented in figure 1.
359
(a) (b) (c) (d)
Figure 9. GSSRA-SDM Remote Block: (a) Circular Grid Topology; (b) SSN [33]; (c) Linear Grid Topology; (d) CSN [33].
Figure 9 exhibits the GRSSA-SDM remote block with event tactical sensor topology in addition
360
to configuration options. The physical appearance [33] is shown in figure 9(a) as a seismic sensor
361
node(SSN) and figure 9(b) cylindrical sensors node(CSN). The nodes were deployed in circular and
362
rectilinear orientation to measure primary(P), secondary(S) and Rayleigh(R) seismic waves as a
363
global threat to infrastructure. The topology in figure 9 serves two-fold benefits i) vibration and tilt
364
measurement and ii) assists in the realization of seismic waves with minimum computation cost.
365
3.1.2. GRSSA-SDM Site Block
366
It has three layers; Mesh Network Layer using Wi-Fi and Bluetooth (Built-in RPi3), application
367
gateway (Banana Pi R1), and bridge layer (wired and wireless). Two options are available for local
and remote display and configuration i.e. first on the OSB as SSH for Raspbian OS using VNC and
369
second on SDM-IaaS gateway as Bananian OS as shown in figure 8.
370
Figure 10. GRSSA-SDM Site Block [33] that performs GRSSA task (i), (ii), and (iii) as distributed computing edge node for RTL block operations with results shared in WMS.
3.1.3. SDM-GRSSA Cloud Block
371
SDM-GRSSA cloud block is shown in figure 11 with two clouds; the first was a customized
372
cloud that is based on a local workstation serving as a VPS enhanced with MATLAB, Laboratory
373
Virtual Instrument Engineering Workbench(LabVIEW), Apache2, and MySQL Server. The second is
374
a public cloud with VPS that utilized the open-source IoTs. It connected only to ThingSpeak IoT at
375
the time of experimentation and had options for Kaa & EmonCMS services for later
376
implementations.
377
Figure 11 is the complete snapshot of GRSSA-SDM network infrastructure that enabled
378
real-time geo-resilience with very promising results exhibited in results sections.
379
3.2. GRSSA-SDM Software Section
380
The robust and swift implementation of GSSRA tasks required very specific software
381
applications combination consisting of two blocks, given below:
382
383
• GRSSA-SDM IoT Core Block
384
• GRSSA-SDM ES Block
385
Both sections are elaborated below with essential details.
386
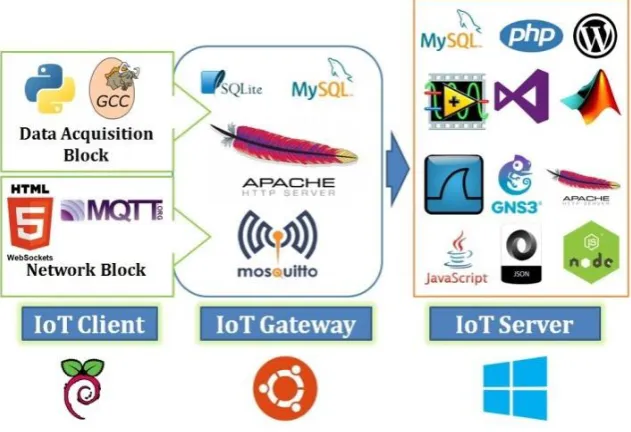
3.2.1. GRSSA-SDM IoT Core Block
387
This block integrates the entire GRSSA-SDM hardware block shown in figure 11 to perform all
388
GRSSA tasks will utmost agility by utilizing the full spectrum of capabilities of the underlying
389
technology. The big picture is being orchestrated in the form of IoT client, gateway amd server in
390
figure 12.
391
Figure 12. GRSSA-SDM IoT Core Block Architecture
Figure 12 is a mirrored silhouette of GSSRA-SDM hardware and software section. The task
392
assignment is explained below:
393
1. The IoT client block as zonal distributed geo-processing software platform with CANopen
394
driver was written in C++ and its bash shell wrapper was written in python in data acquisition
395
block. All incoming CANopen connections and outgoing results on WiFi were handled in
396
network block in HTML5 websockets constituting software service for RTL block as distributed
397
geo-processor. The results were constantly uploaded to SQLite as WMS. Secondly, data was
398
communicating between IoT server and IoT client using MQTT, i.e. with MQTT Server in IoT
399
server responding to MQTT client in IoT client.
400
2. The IoT gateway block as regional parallel geo-processing software platform gathering data
401
from SQLite processing it and saved it in MySQL client database as buffer-zone called IoT RTL
402
PRAM. The private GNC controller was rendered in python that was saving results in PSMP in
403
form of MySQL client database files. Moreover, the MQTT Broker, i.e. Mosquito was also
404
handling multi-threaded two way communication between the IoT node and IoT server.
3. The IoT server block as a global parallel geo-processing software platform that reprocessed all
406
the results stored in PSMP generated by python and compared results generated by MATLAB
407
with data traffic received at MQTT server interfaced with LABView. The purpose of this
408
re-computation was to ensure the authencity and credibility of geo-response. LabVIEW was
409
interacting with MQTT broker using DAQIO library and MySQL Server database was
410
gathering all the data from MySQL clients on gateways as PSMPs. MySQL Server database was
411
accessed by MATLAB. The same service was IoT server was deployed on a public cloud with
412
Thingspeaks with built-in MQTT server and MATLAB support. The complete Hyrbid cloud
413
hardware and software constituted the proposed geo-resilience paradigm.
414
3.2.2. GRSSA-SDM ES Block
415
The GRSSA-SDM-ES block was designed in python 2.7 to perform all the GRSSA tasks from (i)
416
to (vii) through intelligent optimization of the GRSSA-SDM software section over GRSSA-SDM
417
hardware section to address the challenges opted by regional sustainability. This block is a synergic
418
integration and optimization of GRSSA and SDM to achieve geo-resilience. The synopsis of
419
proposed geo-resilience paradigm is exhibited in figure 13.
420
Figure 13. Complete Interaction Diagram for GRSSA-SDM ES
Figure 13 is very self-explanatory and synthesis of entire design work flow. The brownish land
421
globe means earth with disaster challenges and greenish land means earth with sustainability.
4. Case Study: GRSSA-SDM Implementation on SHM Systems at Qatar University
423
The chosen case study was SHM system prediction for Qatar University (QU) as potential
424
GRSSA-SHM study ground. Three different specification and configuration systems were installed
425
in QU at three physically 1 km apart unique locations, namely, SHM-QU-B09 Lab,
426
SHM-QU-CO5-Bridge and SHM-QU-H10-Research Complex. In parallel the two virtual installations
427
i.e. SHM-QU-B03 Corridor and SHM-QU-B01 Higher Administrative Building. The SHM system
428
details for these locations are:
429
• SHM-QU-CO5-Bridge SHM Site (SHM-BS) System with 5 SHM-ASSP-ZRC-SSNs
430
• SHM-QU-H10-Research Complex SHM site (SHM-RC) with 5 SHM-ASSP-ZRC-SSNs.
431
• SHM-QU-B09 SHM site (SHM-LB) with 5 SHM-ASSP ZRC-SSNs and 10
432
SHM-ASSP-ZRC-CSNs.
433
• SHM-QU-B03 Corridor (Virtual Machine Running on Project NPRP8 Laptop) simulating 5
434
SHM-ASSP-ZRC-SSNs.
435
• SHM-QU-B01 Higher Administrative Building (Virtual Machine Running on Project NPRP8
436
Laptop) simulating 5 SHM-ASSP-ZRC-CSNs.
437
The entire deployment plan for case study QU is shown in Figure 11 published in our earlier papers:
438
Figure 14. Realization of a Regional GRSSA-SDM Hardware Prototype
In figure 14, a very basic regional level GRSSA-SDM hardware prototype is presented i.e the 2
439
unique remote blocks were connected with SHM-OSB called out-surface board (OSB) with IoT node
440
software using CANopen network with CAN-USB adapter by Gingko. The CANopen addresses
441
were 1, 2, 3, 4, 5 on both sides. The resilience support system(RSS) sites are RSS-SHM site A with
442
bi-axial inclinometer based nodes and resilience support RSS SHM site B with bi-axial
443
accelerometer-based nodes. The two SHM site nodes were connected to I/O multiplexer block of RSS
444
gateway (installed with IoT gateway software) with keyboard-video-multimedia (KVM) switch for
445
multiple displays, communication ports and power supply unit (PSU).
(h)
(a)
(b) (c)
(d) (e)
(f) (g)
Figure 15. Case Study: QU SHM Sites Deployment Detailslisted as (a) H10 SHM site with 4 CSNs
447
and 1 SSN; (b) B09 Lab with 10 CSNs on SHM stand; (c) B09 Lab with 5 SSNs on table; (d) OSB and a
448
SSN QU Bridge Site; (e) SSN QU Bridge Site; (f) ODU for QU Bridge site mounted on outer side of
449
boundary wall of C05; (g) IDU for QU Bridge site mounted on inner side of boundary wall of C05; (h)
450
Overview on Google Maps for QU SHM sites.
451
In figure 15, the physical deployment of the SHM-QU case study is displayed that was done in
452
C05-Bridge (red), H10-Research Complex (yellow) and B09-Lab (cyan). Two sites are for simulation
453
purpose only i.e. the B03-Corridor (dotted-green) and B01-Higher Administrative Building
454
(dotted-green). The purpose is only to test the model of SHM RSS in urban scale for more data and
455
sites later with 3 physical and rest virtual SHM sites. The pictures and more details of physical sites
456
are given in [33] as figure 9(a), 9(b) and 9(c). Core challenges in swift resilience response in regional
457
level SHM deployments systems were resolved at campus level implementation in this work as:
1. Swift anomaly centered packet transmission PN in SHM based implementations at a regional
459
scale.
460
2. Rapid chaos set estimation through Tβ as belief function update acknowledgement contributing
461
to anomaly vectors verification matching RTL block performance test.
462
3. Speedy chaos sets conflict resolution by rules network estimated from the rise in gateway
463
throughput TP as performance evaluation of IoT GATOR block.
464
4. Brisk resilience response estimated with consistency in packet sequence numbers, i.e. data
465
processing stopped. No further sustainability advice needed.
466
5. The 15s lag in every variable on ThingSpeak is a real hurdle in real-time geo-analytics. An
467
application-specific web-based private cloud RSS platform with the sustainability assessment
468
capabilities was so far been absent.
469
6. Regional sustainability GRSS-IE layer generation mechanism was so far missing.
470
The physical sensor dependent data streams have a dependency on ADC sampling rate thus
471
have lesser data rate i.e. in range of 250 kbps per node. In addition, two virtual SHM systems were
472
deployed with higher data rate i.e. 128 Mbps per. Five different condition monitoring sites i.e. SHM
473
systems were feeding 5 different data streams for the same ER diagram.
474
The network analysis and performance indicators verify the performance of real-time
475
geo-resilience system architecture. The entire GRSSA-SDM for QU was designed and deployed with
476
the system configuration is given in table 2:
477
Table 2. GRSSA-SDM SHM Network Configuration
478
Systems Packet Size Data-Rate Protocols Nodes Quantity
PBCL 1500 Bytes 128Mbps IPv4 1
PRCL-N 1500 to 9000 Bytes 1Gbps IPv4 2+
GRSSA-SDM-Gateway 2312 Bytes 1Gbps IPv4 1+
GRSSA-SDM-Site Blocks 32-Bit to 251 Bytes 100Mbps IPv4 & BT4.2 5+ GRSSA-SDM-Remote Blocks 8 Bytes 250kbps CANopen 15+
The backbone of any data processing system is data processors and data buses in any definition.
479
The databases are data processors and their size as well as the technology of storage that includes
480
access time and read/write time play a vital role in data processing capabilities of systems. The
481
GRSSA-SDM-ES data configuration for synthetic DADO machine is given in table 3.
482
Table 3. GRSSA-SDM-ES Data Configuration
483
Systems Database Role Size on Disk Technology
PBCL MySQL 5.5 Server 3 TB PCI-E SSD
PRCL-N MySQL 5.5 Server 1 TB m.2 SSD
GRSSA-SDM-Gateway MySQL 5.5 Client 200GB SATA SSD
GRSSA-SDM-SHM Site SQLite 3.0 Client 8GB Micro-SD-XC
GRSSA-SDM-Remote Block NIL Node 32KB SPIFFS
Furthermore, the data architecture was designed in a way that whenever the hierarchy moves
484
upward the width of data block or size of data processing clusters risen. Two core analysis
485
mechanisms used for GRSSA-SDM implementation and performance analytics were Wireshark 3.0
486
and Python IDLE 2.7 with the following libraries:
487
• pyknow for expert systems implementation with the addition of three improvements RETE,
488
TREAT and LEAPS programming and customization to formulate RTL block
489
• NetworkX, Scipy, numpy, and pyknow together to design GATOR block
490
• pyknow, NetworkX, Matplotlib, network2tikz, and pysocks to plot the geo-analytics of
491
GRSSA-SDM performace analysis and operations.
5. Results
493
The results followed the proposed methodology steps sequence given in section 2 for regional
494
computations. The first step was the start of transmission from remote block to the gateway as PN
495
trace from equation 6 in figure 16.
496
(a) (b)
Figure 16. Desciption of GSSRA-SDM Site to Gateway, PN I/O Graph as (a) First 270 seconds trace at GNS3 running on IoT gateway in B09; (b) Data network establishment for the sensor to gateway uni-directional as communication of five sites.
In figure 16, we can see that the maximum 21 packets/second transmission took place from
497
SHM Sites to RSS Gateway i.e. 48552 bytes/second or 388.416 kbps as per table 2. Only anomalies
498
data A is transmitted upward in the hierarchy to avoid collision and data fusion scenarios. This data
499
rate is suitable for 15 CANopen nodes with a total of 75 variables, i.e. 15 x-axis tilt-angles Ɵx, 15
500
y-axis tilt-angles Ɵy, 15 x-axis accelerations Ax, 15 y-axis accelerations Ay, and 15 temperatures. At 250
501
kbps for 15 nodes, it is calculated as 3750 kbps in the ideal case for CANopen 3 clusters only i.e.
502
58593.75 packets/second of CANopen. But when it comes to CANopen data nodes in the form of
503
tables transferred and accessed as queries then the situation is much more complex.
504
(a) (b)
Figure 17. Line plot for two β0 and β1 belief functions update round trip time as (a) Two acknowledgements of anomalies at 571ms and 46s (b) Site 2 and 5 received packets from the gateway as well as primary alarm in dotted blue and entire WMS and PSMP accessed by PRCL.
Figure 17 shows that Tβ at 46.1 seconds as the maximum round trip time in updating the belief
505
function β1 in the worst case in this trace computed from equation 7. The first β0 was updated at
506
571ms and second at 29.4 seconds in figure 13. It can take even one complete solar day to update one
507
belief function depending on the size of Rss(STATE).
(a) (b) (c) Figure 18. Description ofGRSSA-SDM-gateway throughput as (a) Bi-directional communiation between two nodes (b) first 2 minutes for SHM 5 sites and 6 nodes at different MTUs; (c) Bidirectional communication between three nodes as new sustainability update in green lines.
The equation 8 resulted in in figure 18 plot as gateway throughput. In figure 17, the frequency
509
of acknowledgements had increased at 29.4 seconds as throughput demand as gateway needed new
510
more beliefs to characterize the run-time anomalies. The WMS and PSMP were updated when belief
511
functions and rule network needed updates. Furthermore, it was observed that the maximum
512
throughput of 749,300 bits/second was achieved 37.2 seconds with a segment size of 1482 bytes on a
513
GRSSA-SDM gateway with MTU=1500B. Achieving event response below MTU at such a low data
514
rate was the very competitive benchmark.
515
(a) (b)
Figure 19. Descriptionofsequence numbers generated at GRSSA-SDM-gateway as (a) first 2 minutes by GNC for rule network update till resilience response; (b) new decision tree loaded into gateway from PRCL and sustainability advice or resilience reponse conveyed to two nodes in green.
In figure 19, the equation 9 computed sequence number were illustrated i.e. GRSS-SDM 11,000+
516
sequence numbers generated for the first belief function update and first event response for a
517
particular SHM variable and second at 148,586th sequence number. The horizontal green line is the
518
time in which one belief function data stayed consistent and blue dots represent that response
519
generation stayed constant with every next sequence. After 360000+ sequence numbers, the belief
520
function achieved maturity as reflected by a horizontal line. The events generation stopped 372000th
521
token at 48 seconds means no all possible rule networks and event responses calculated.
Figure 20. Line plots and speedometer charts illustrating the health of structures in QU as per deployment details are given in figure 11 in form of Real-timeQU-RSS Dashboard for Hybrid Cloud
Step 4 is H(%) estimated by equation 10 is displayed on the RSS-SHM Dashboard as
523
speedometers. In figure 20, we can see RSS dashboard as a holistic overview of the system. The
524
green-colored speedometer charts show zero resilience needed. There occurred a condition at 6:00
525
am for SRIB to transmit 40kb/s and at 6:30 am again to depict the mass employee or staff movement
526
due to change in duty shifts. Absence of color speedometer charts on the dashboard means the
527
system is fulfilling the safety integrity level (SIL) parameters and conditions. The line graph in the
528
bottom displays the number of belief functional values updated in 24 hours that are only 40.
529
(a) (b) (c)
Figure 21. The SHM-RSS Events Response Layer are shown as (a) Google Earth View; (b) SHM-UCM Layer
530
(MOSPA); (c) GRSSA-SDM-IE Layer.
531
The final step geo-spatial plot is estimated as by subtracting Figure 21(b) from Figure 21(a) as
532
well as applying “the condition zero” defined in step 5 in section 2. Figure 21(a) is the actual view
533
without application of GRSSA-SDM-ES as acquired from Google Earth. In figure 21(b) we have used
a machine learning algorithm MOSPA for urban scale geo-informatics and SHM analytics presented
535
in [33] as an applied algorithm for testing. The belief functions in RTL block in figure 17(c) optimized
536
WMS by deleting the green area from conflict sets, the green area guided the citizens are a safe
537
location to move till the brown area was set for recovery that took the time of 80.2 seconds to mark
538
H08 and B01 as recoverable zones. The yellowish area turn is in WMS and GATOR networks
539
generated only safe exit response for inhabitant till the areas get back to normal. The cost of damage
540
is the parameter of assessment in MOSPA whereas in RSS-IE the number of independent parameters
541
for unit events in minimum time is the degree of merit. Maximum cost leads to maximum resilience
542
needed. Cost refers to the real-time damage estimated and predicted lifetime damage of structures
543
and human resource.
544
6. Discussion and Limitations
545
6.1. The Problem/Challenge
546
Regional events are happening in parallel at different geospatial locations. The resilience delay
547
due to the tendency of similarity between these events is very high. The runtime sensing and
548
classification of these events is domain-dependent as resilience parameters vary from domain to
549
domain i.e. environmental, structural, geological, utility grid, and water supply, etc. The real test of
550
any geo-resilience is generating a unique and swift resilience response with minimum resources and
551
time to handle heterogeneity or a variety of zones and regions.
552
6.2. The Contribution of Proposed GRSSA-SDM Paradigm
553
An organization level GRSSA-SDM was designed to test this RSS machine by using inputs from
554
three physically deployed SHM systems visible in figure 15. The sensor dependent data streams
555
have a dependency on ADC sampling rate thus have lesser data rate i.e. in range of 250 kbps per
556
node. In addition, two virtual SHM systems were deployed with higher data rate i.e. 128 Mbps per
557
also visible in figure 15. Five different condition monitoring sites i.e. SHM systems were feeding 5
558
different data streams for the same ER diagram. The step-wise operations of RSS are given below:
559
1. Step 0: All the SHM nodes set sensor data as variable vector V given in equation 1. The data was
560
continuously monitored for unsafe conditions M and safe range N and anomalies vector ΔA
561
was estimated from equation 2. Equation 3 and 4 were only for ideal RSS system.
562
2. Step 1: The diversity and variety expected at urban-scale were computed from equation 5 as
563
resilience system state Rss(STATE). The first factor in equation 5, DCB = 2 i.e. two unique data
564
rates were used. The second factor, USCV-SHM = 10 i.e. 3 SHM sites were unique out of 5. The third
565
factor, VCSHM-SENSOR = 595 i.e. 2 unique out of 35 total sensor nodes. The Rss(STATE) for the given
566
case study was computed as 11900 from equation 5. The data size fed to GRSSA-SDM machine
567
by SHM sites was 11900 x size of data-type. In our case was integer i.e. 11900 x 4 bytes = 47600
568
bytes. Means 11900 event states fed to RSS. The data rate was 48552 bytes/second meant all sent
569
to RSS and number of packets required for end to end communication were 20.5882 packets but
570
results shown 21 packets/seconds as displayed in figure 16.
571
3. Step 2: The Tβ estimated by equation 7 had to be ideally in milliseconds taking into account the
572
capability of Corei7 processors by in reality was totally dependent on GRSSA-SDM network
573
infrastructure and quality of communication channels. The value 571ms was too ideal whereas
574
29.4 is near to realistic as shown in figure 17.
575
4. Step 3: The RSS system achieved its goal at lesser MTU i.e. 1492 as shown in figure 14. It had
576
shown its fitness and robustness for handling heterogeneity at urban-scale.


![Figure 9. GSSRA-SDM Remote Block: (a) Circular Grid Topology; (b) SSN [33]; (c) Linear Grid Topology; (d) CSN [33]](https://thumb-us.123doks.com/thumbv2/123dok_us/7949610.1319330/11.595.88.500.478.591/figure-gssra-remote-block-circular-topology-linear-topology.webp)