IJEDR1603088
International Journal of Engineering Development and Research (www.ijedr.org)536
of solar cells performance under various conditions it is necessary to understand how the variation in temperature affects the solar cell. From all the solar cell performance parameters short circuit current, open circuit voltage, fill factor, band gap and efficiency have been discussed. A simple silicon solar cell has been simulated using MATLAB. The reverse saturation current increases with temperature and causes Voc to decrease which decreases the fill factor and hence the efficiency of the solar cell. The temperature dependence of performance parameters open circuit voltage, short circuit current density, fill factor and efficiency has been investigated.Index Terms—Solar cell, Temperature dependence parameter, mathematical modeling, device simulation
.
________________________________________________________________________________________________________
I.INTRODUCTION
A solar cell is a device which directly converts sunlight into electricity. Light shining on solar cell produces a voltage and a current to generate electric power. This process requires a material in which both absorption of light raises an electron to a high energy state and the movement of this high energy electron from the solar cell in to an external circuit [1]. This electron then dissipates its energy in the external circuit and returns to the solar cell.
The solar cell parameters like open circuit voltage, short circuit current and fill factor have been discussed. The open circuit voltage is temperature dependent. The short circuit current increases proportionally with temperature [2]. The fill factor and efficiency which depends on open circuit voltage and short circuit current follows these variations. The temperature change affects these parameters and hence the performance of solar cells. Here we are going to analyze the dependence of temperature on the parameters of efficiency stated above and we will be using MATLAB for analyzing the dependence of temperature on various parameters of efficiency.
II .TEMPERATURE DEPENDED PARAMETERS ON EFFICIENCY
Solar cells are usually characterized using four parameters: short circuit current Isc, open circuit voltage Voc, fill factor FF, and conversion efficiency η. Here we will be dealing with the parameters that vary with temperature and how they have an impact on the efficiency of solar cell. Like all other semiconductor devices, solar cells are temperature sensitive. Increase in temperature reduces the band gap of a semiconductor, thereby affecting material parameters of the semiconductor. The reduction in the band gap of a semiconductor with increasing temperature can be seen as rise of the energy of the electrons in the material. Lower energy is therefore needed to break the bond. In the bond model of a semiconductor band gap, reduction in the bond energy also reduces the band gap [4]. Therefore increasing the temperature reduces the band gap.
Band gap
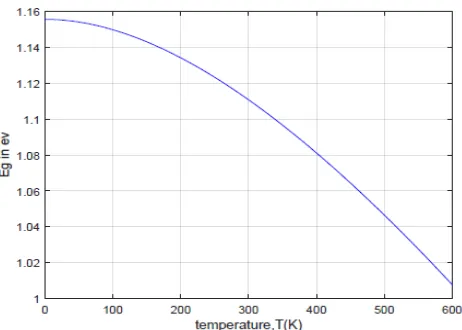
The band-gap energy of semiconductors tends to fall with increasing temperature. When temperature rises, the amplitude of atomic vibrations rises leading to more interatomic spacing [3]. The interaction between the lattice phonons and the free electrons and holes will also influence the band gap to a smaller extent [9]. The relationship between band gap energy and temperature can be described by the expression,
Eg(T) = Eg(0) − (αT2
T+β) (1)
IJEDR1603088
International Journal of Engineering Development and Research (www.ijedr.org)537
Figure 1: Plot of energy band gap vs. temperatureOpen circuit voltage
The open circuit voltage is the maximum possible voltage developed across the terminals of a solar cell when they are kept open, i.e., I=0 .Illuminating a cell adds to the normal "dark" currents in the diode so that the diode law becomes
I=I0(e(qV/KT)-1) -IL (1)
where IL = light generated current and should be as high as possible; for commercial solar cells it should be more than 0.7. The energy conversion efficiency is given by η = pmax/pi , where pi is the power density of the incident radiation. Under Air mass, AM 1.5 illumination this is 1000 Wm−2 .The open-circuit voltage is the maximum voltage available from a solar cell. At J=0 yields the expression for Voc as:
J = −JPH+ JO(e
qV
nKT− 1) (2)
VOC= KT
q ln( JSC
JO + 1) ( 3)
where, Jsc~Jph, Voc is related to Jsc and Jo and hence to Eg. For a high Voc, a low Jo is absolutely necessary. The above equation shows that Voc depends on the saturation current of the solar cell and the light-generated current. While Isc typically has
a small variation, the key effect is the saturation current, since this may change by orders of magnitude. The saturation current, I0
depends on recombination in the solar cell. Open-circuit voltage is then a measure of the amount of recombination in the device. Silicon solar cells on high quality single crystalline material under one sun and AM1.5 conditions have open-circuit voltages of up to 730 mV, while commercial devices on multicrystalline silicon have open-circuit voltages around 600 mV. Voc decreases with increasing temperature where as it increases with increasing band gap. The decrease in band gap with increasing temperature results in lower Voc. In figure 2 the open circuit voltage is plotted for temperature ranging 0-600K.
Figure 2: Plot of open circuit voltage vs. temperature
The VOC can also be determined from the carrier concentration. The temperature dependence of Voc can be obtained as
dVOC
dT = (
VOC
T ) + Vth( 1 JSC
dJSC
dT −
1 JO
dJO
IJEDR1603088
International Journal of Engineering Development and Research (www.ijedr.org)538
respectively. Combining Eqs 5 & 6, the expression for Jo can be written in terms of temperature and band gap energy as:JO= CT3e−(
Eg
KT) (7)
In the above equation, doping and the material parameters of solar cells are merged in to a constant. The important solar cell parameters for the model calculations are the temperature and band gap [5].The higher the band gap, lesser will be the saturation current density. The reverse saturation current density of a pn junction is dependent on semiconductor material and device parameters. It is a complex geometrical factor which results from the solution of continuity and current equation is replaced by a constant ‘c ‘. It is possible to generate the reverse saturation density as a function only of c, temperature T and band gap Eg which is given above. Recently the parameter was determined to be C=17.90Ma//K3/cm2. As the value of open circuit voltage of a solar cell is improved the formerly determined parameter c has to be revised.
𝐶 = (𝐽𝑆𝐶
𝑇3)𝑒 𝑞𝐸𝑔𝑉𝑂𝐶
𝐾𝑇 (8) Short circuit voltage
The short-circuit current is the current through the solar cell when the voltage over the solar cell is zero (i.e., V=0). When we put V=0 in Eqs 1-3 we have obtained the short circuit current as Jsc =-Iph. The Isc is usually represented in terms of current density and current per unit area in terms of mA/cm2.When the p-n junction is illuminated, charge carrier pairs are produced wherever light is absorbed. The strong field at the junction attracts minority carriers across the junction and a current flow results. The semiconductor device is not in thermal equilibrium, which indicates that electric power can be delivered to a load. This is the basic technique of a solar cell [7]. A typical such solar cell consists of a p-n junction, which has a diode characteristic. This characteristic can be obtained from standard solid state physics. It is:
𝐼 = 𝐼0(𝑒
𝑉𝐴
𝑉𝑇− 1) (9)
The I is the current through the diode at applied voltage VA. VT is a constant, the so-called thermal voltage. I0 is the diode
saturation current, which rely on the type, doping density, and the semiconductor material quality and the p-n junction quality. If this junction is illuminated, a supplementary current, the light-generated current Iph is added: than the equation becomes
𝐼 = 𝐼𝑝ℎ− 𝐼0(𝑒
𝑞𝑉
𝐾𝑇− 1) (10)
The K is the Boltzmann constant, T is the absolute temperature, q (>0) is the electron charge, and V is the voltage at the
terminals of the cell. I0 is well known to electronic device engineers as the diode saturation current serving as a reminder that aIJEDR1603088
International Journal of Engineering Development and Research (www.ijedr.org)539
Figure 3: Plot of short circuit current vs. temperature
Generally, for semiconductors, as the temperature increases, the band gap decrease. Consequently, the solar cell acknowledges to longer wavelength regions in the solar spectrum and Jsc increases. Thus, Jsc is roughly proportional to the incident spectral intensity at wavelengths near the band edge. The short-circuit current rely on a number of factors which are described below:
the area of the solar cell. To neglect the dependence of the solar cell area, it is more common to list the short-circuit current density rather than the short-circuit current;
the number of photons .Isc from a solar cell is directly dependant on the light intensity
the spectrum of the incident light
the optical properties (absorption and reflection) of the solar cell and
the collection probability of the solar cell, which depends chiefly on the surface passivation and the minority carrier lifetime in the base.
When comparing solar cells of the same material type, the most important material parameter is the diffusion length and surface passivation. In a cell with perfectly passivated surface and uniform generation, the short-circuit current equation can be approximated as:
𝐽𝑆𝐶 = 𝑞𝐺(𝐿𝑛+ 𝐿𝑝) (13)
where G is the generation rate, and Ln and Lp are the electron and hole diffusion lengths respectively.
Fill factor
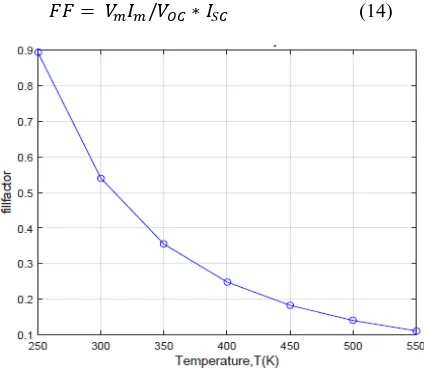
The fill factor is defined as the ratio of maximum power Pm=∗ Vm∗ Im that can be obtained from a solar cell to the ideal
powerPO= VOC∗ ISC. Fill factor decreases with increasing temperature .The decrease in fill factor is mainly controlled by
decrease in Voc whereas increase in short circuit current with temperature does not contribute much to fill factor. In figure 4 fill factor is plotted against temperature. Fill factor can be expressed as
𝐹𝐹 = 𝑉𝑚𝐼𝑚/𝑉𝑂𝐶∗ 𝐼𝑆𝐶 (14)
IJEDR1603088
International Journal of Engineering Development and Research (www.ijedr.org)540
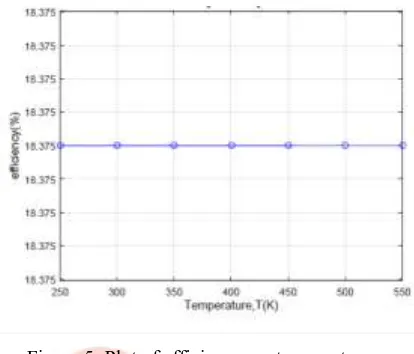
Figure 5: Plot of efficiency vs. temperature
In addition to reflecting the performance of the solar cell itself, the efficiency has an effect on the spectrum and intensity of the incident sunlight and the temperature of the solar cell [11]. Therefore, conditions in which efficiency is measured must be carefully controlled for performance comparison. Terrestrial solar cells are measured under AM1.5 conditions and at a temperature of 25°C. Solar cells intended for space use are measured under AM0 conditions [8]. The efficiency of a solar cell is determined as the fragment of incident power which is converted to electricity and is defined as:
𝜂 =𝑃𝑚
𝑃𝑖𝑛= 𝐼𝑚𝑉𝑚
𝑃𝑖𝑛 =
𝐹𝐹𝐼𝑆𝐶𝑉𝑂𝐶
𝑃𝑖𝑛 (15)
The terms AM0 and AM1.5 are the designations of a particular radiation conditions. The concept Air Mass is the amount of atmosphere through which the solar radiation has travelled and is interrelated to the amount of absorption.
𝐴𝑀 = 1
cos 𝜃 (16)
The θ represents the angle of the sun to the vertical. Outside the atmosphere the spectrum is AM0 and that on the surface of the earth for normal incidence is AM1. The spectrum AM1.5 corresponds to an angle of incidence of solar radiation of 48° relative to the surface normal. The maximum achievable efficiency for each solar cell is computed based on the calculated current density, open circuit voltage and fill factor.
III. CONCLUSION
The temperature dependence of performance parameters open circuit voltage, short circuit current density, fill factor and efficiency has been investigated in the temperature range 273–523K. With increasing temperature reverse saturation current increases and therefore, Voc decreases which decreases the fill factor and hence the efficiency of the solar cell. At the same time, the band gap also decreases with increasing temperature and this result in an increase in Jsc which acts to improve the efficiency of the cell. Therefore, the tendency of Voc to decrease and Jsc to increase with increasing temperature in the solar cells results in a decrease in the efficiency with increasing temperature. The variation of efficiency and all other temperature dependent parameters during the temperature is small as the maximum temperature available is around 40℃ , so we may not experience the increase in the efficiency of solar cell.
IV. REFERENCES
[1].S.M.Sze, Physics of Semiconductor Devices, John Wiley & Sons, New York, 1981, p.264 (Chapter14).
[2].J.J.Wysocki, P.Rappaport ,Effect of temperature on photo voltaic solar energy conversion, Journal of Applied Physics 31(1960)571–578.
[3].J.C.C.Fan ,Theoretical temperature dependence of solar cell parameters ,Solar Cells 17(1986)309–315.
[4]. P.Singh, S.N.Singh ,M.Lal ,M.Husain, Temperature dependence of I–V characteristics and performance parameters of silicon solar cell,Solar Energy Materials and Solar Cells92(2008)1611–1616.
IJEDR1603088
International Journal of Engineering Development and Research (www.ijedr.org)541
[6].W. Shockley, H.J. Queisser, Detailed balance limit of efficiency of p–n junction solar cells, Journal of Applied Physics32 (1961) 510–519.
[7].Luque, S. Hegedus, Handbook of Photovoltaic Science and Engineering, Wiley-Sons, 2003.
[8].]Riordan, R. Hulstron, What is an air mass 1.5 spectrum?, in: Proceedings of the Conference Record 21st IEEE Photovoltaic Specialists Conference 2, 1990, pp. 1085–1088
[9].Y.P. Varshni, Temperature dependence of the energy gap in semiconductors, Physica 34 (1967) 149–154.
[10].N.M. Ravindra, V.K. Srivastava, Temperature dependence of the energy gap in semiconductors, Journal of Physics and Chemistry of Solids 40 (1979) 791–793.