British Journal of Nutrition (1995), 73, 531-550 53 1
Validation of weighed records and other methods
of
dietary
assessment using the
24
h urine nitrogen technique and other
biological markers
B Y S.A. BINGHAM', A. CASSIDY', T. J. COLE', A. WELCH', S.A. RUNSWICK', A. E. BLACK', D. T H U R N H A W , C. BATES', K. T. KHAW4, T. J. A. KEY5,
A N D N. E. DAY6
'
MRC Dunn Clinical Nutrition Centre, Hills Road, Cambridge CB2 2DH MRC Dunn Nutrition Unit, Downhams Lane, Milton Road, Cambridge CB4 I X J Human Nutrition Group, Department of Biological and Biomedical Sciences, University of Ulster,Coleraine BT52 1SA
Clinical Gerontology Unit, F & G Block, Addenbrooke's Hospital, Cambridge CB2 2QQ Imperial Cancer Research Fund, Cancer Epidemiology Unit, Gibson Building,
The Radclife Injirmary, Oxford OX2 6HE
'Institute of Public Health, University Forvie Site, Robinson Way, Cambridge CB2 2SR
(Received 15 April 1994 - Revised 15 July 1994 - Accepted 21 July 1994)
Results from analysis of 24 h urine collections, verified for completeness with para-amino benzoic acid, and blood samples collected over 1 year were compared with 16 d weighed records of all food consumed collected over the year, and with results from 24 h recalls, food-frequency questionnaires and estimated food records in 160 women. Using the weighed records, individuals were sorted into quintiles of the distribution of the urine N excreti0n:dietary N intake ratio (UN:DN). UN exceeded DN in the top quintile of this ratio; mean ratio UN:DN = 1.13. Individuals in this top quintile were heavier, had significantly greater body mass indices, were reportedly more restrained eaters, had significantly lower energy intake:basal metabolic rate ratios (EI:BMR), and had correlated ratios of UN:DN and EI : BMR (r - 0.62). Those in the top quintile reported lower intakes of energy and energy-yielding nutrients, Ca, fats, cakes, breakfast cereals, milk and sugars than individuals in the other quintiles but not lower intakes of non-starch polysaccharides, vitamin C, vegetables, potatoes or meat. Correlations between dietary intake from weighed records and 24 h urine K were 0.74 and 0.82, and between dietary vitamin C and &carotene and plasma vitamin C and &carotene 0.86 and 0.48. Correlations between dietary N intake from weighed records and 24 h urine excretion were high (0-78-0.87). Those between N from estimated food records and urine N were r 0-60-0.70. Correlations between urine N and 24 h recalls and food-frequency questionnaires were in the order of 0.01 to 0.5. Despite problems of underreporting in overweight individuals in 20% of this sample, weighed records remained the most accurate method of dietary assessment, and only an estimated 7 d diary was able to approach this
accuracy.
Dietary assessment methods: Urine nitrogen: Dietary nitrogen
532 S. A. B I N G H A M A N D O T H E R S
collections is an independent measure of protein intake (Bingham & Cummings, 1985). We have therefore used this method to assess (1) the validity of estimations of habitual diet from 16 d weighed records kept by 160 women aged 50-65 years over the course of 1 year, and (2) the validity of estimates of diet from 24 h recalls, diet diaries and food-frequency questionnaires. The relationship between weighed records and other potential biomarkers of dietary intake including blood levels of some vitamins was also investigated.
M E T H O D S Volunteers
Volunteers for the present study were obtained from the lists of two general practitioners in Cambridge in 1988 and 1989. Seventy-nine female volunteers aged 50-65 years completed the study in year one (1989-1990; group l), and eighty-one completed the study in year two (1990-1991 ; group 2). Full details of the recruitment procedure and of the study participants are given elsewhere (Bingham et al. 1994). The protocol was approved by the Dunn Nutrition Unit Ethical Committee in October 1988.
Protocol
Each individual was studied at home on four occasions (seasons) over the course of 1 year, and at each season was asked to complete
4
d weighed food records, using the PETRA (portable electronic tape recorded automatic) scales (Cherlyn Electronics Ltd, Cambridge). Full details of the weighing procedure are given elsewhere (Bingham et al. 1994). The volunteers were also asked to provide two 24 h urine collections on each occasion, so that over the year each individual provided 16 d weighed dietary records, and eight 24 h urine collections. Overnight fasting blood samples were also obtained, together with body weight and fasting breath samples at each occasion. Seven other dietary methods were investigated over the course of 1 year (two different food-frequency questionnaires, two variants of the 24 h recall, and three types of food diary) and these are fully described elsewhere (Binghamet al. 1994). Volunteers in group 2 were weighed immediately before beginning and after completing the last occasion of
4
d weighed intake, and were assessed for their tendency towards restrained eating at the end of the study.Urine collections
V A L I D A T I O N OF D I E T A R Y ASSESSMENT M E T H O D S 533 In urine, total N was determined by the Kjeldahl technique (Tecator 1002; Perstorp Analytical, Bristol, Avon) and Na and K by flame photometry. PABA was measured colorimetrically (Bingham et al. 1988).
Fasting blood and breath collections, anthropometry and bowel habit diary
Subjects were visited by the study nurse within 7 d of completing the 4 d diet record by prior arrangement at home between 06.00 and 09.00 hours after overnight fasting and before breakfast. The second 24 h urine collection was picked up, and subjects were weighed on a spring balance, without shoes and in light clothing. Height without shoes was also measured using a Nivotoise portable height measure. Group 2 subjects were also weighed when they were not fasting, in light clothes and without shoes the day before they were due to start weighing their food for the last time (season 4) and the day after the
4
d period. Basal metabolic rate (BMR) was calculated from the equations of Schofield et al. (1985). Duplicate end-expiratory fasting breath samples were collected using a party blower into 20 ml plastic syringes fitted with three-way stopcocks for CH, and H, determination. Samples of room air were also taken and the value subtracted from the breath sample (Gibson et al. 1990). H, was measured with an exhaled H, monitor (Gas Measurement Instruments Ltd, Renfrew, Scotland) and CH, by gas chromatography using a Pye Unicam PU 4500 with flame ionization detector. Subjects were asked to keep a 7 d record of the number of stool specimens per week within 7 d of completing the weighed records.A 30 ml sample of blood was taken by venepuncture, 20 ml in lithium heparin, and 10 ml without anticoagulant. The samples were returned to the laboratory within
3-4
h in an insulated picnic box, when 0.5 ml whole blood was retained for packed cell volume analysis, and 0.2 ml whole blood was added to 1-8 ml22.7 mM-ascorbate at pH 4.6 before storage at -40" for pteroylglutamate (folate) analysis. The remainder of the whole blood was centrifuged at 3000 rev./min for 10min at lo", and 0.2ml plasma was added to 0-4ml 1.25 M-metaphosphoric acid and stored at -40" before analysis for vitamin C. Remaining plasma was stored at - 40" before analysis for carotenoids. After centrifugation, serum was separated from the 10 ml sample containing no anticoagulant, and stored at - 20" for later cholesterol analysis using the Roche cobas-bio method.Plasma vitamin C was measured by liquid chromatography with electrochemical detection in both groups (Bates & Cowen, 1988; Margolis & Davis, 1988). In group 1 only, carotenes, retinol and tocopherols were measured using absorptiometric detection (Thurnham et al. 1988). The intrabatch precision of these methods is 5-10 % coefficient of variation. Erythrocyte folate in both groups was measured by radioassay (Fuller et al.
1983).
Food restraint score
At the end of the last season, season
4,
participants of group 2 were asked to fill in questionnaires designed to assess their tendency to restrain food consumption. The first ten general questions of the Dutch eating behaviour questionnaire (DEBQ) (van Strein et al.534
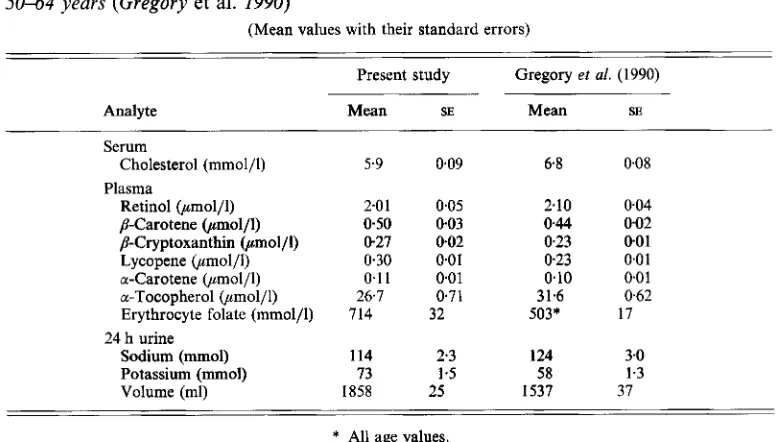
S. A. B I N G H A M A N D O T H E R STable 1. Average values for some blood and urine analytes from subjects in the present study compared with those obtained from a randomly selected population group of women aged
5064
years (Gregory et al. 1990)(Mean values with their standard errors)
Present study Gregory et al. (1990)
Analyte Mean SE Mean SE
Serum
Plasma
Cholesterol (mmol/l) 5.9 0.09 6.8 0.08
Retinol (pmol/l) 2.01 0.05 2.10 004
p-Carotene (,umol/l) 0.50 0.03 0.44 002
/?-Cryptoxanthin (,umol/l) 0-27 0.02 0.23 0.0 1
Lycopene (pmol/l) 030 0.01 023 0.0 1
a-Carotene (pmol/l) 0.11 0.01 0.10 0.0 1
a-Tocopherol (pmol/l) 26.7 0.71 31.6 0.62
Erythrocyte folate (mmol/l) 714 32 503* 17
Sodium (mmol) 114 2.3 124 3.0
Potassium (mmol) 73 1 5 58 1.3
24 h urine
Volume (ml) 1858 25 1537 37
* All age values.
Statistics
Unless otherwise stated, results are given for the mean and standard deviation or standard error, and for Pearson correlation coefficients between variables. Results are given for energy, macronutrients, non-starch polysaccharides (NSP), K, Ca, Fe, carotene, retinol and vitamin C , all of which had less than 1 % ‘missing values’ (numbers of foods with no entry out of the total consumed) in the database. Results are also shown for ‘dietary fibre’, although the database contained 9 % missing values. Cross correlations between dietary cholesterol, total folate and erythrocyte folate were also made, although the dietary data had 8 YO missing values for folate. The cholesterol database was complete.
R E S U L T S Dietary intakes
Group mean results of the weighed dietary intake data and that from other methods have been fully discussed elsewhere (Bingham et al. 1994). One hundred and fifty-six subjects completed all four seasons, and a further four subjects completed three seasons of the study, but had moved out of the area by season
4.
The results from these subjects are also included (total 160 subjects).Urine and blood results
V A L I D A T I O N O F D I E T A R Y ASSESSMENT METHODS 535
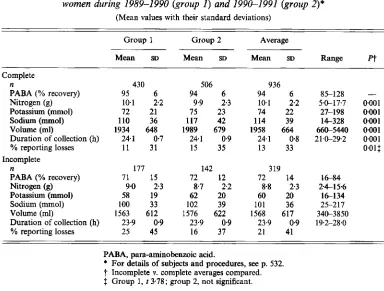
Table 2. Comparison of complete and incomplete 24 h urine samples collected from 160 women during 1989-1990 (group I ) and 199e1991 (group 2)*
(Mean values with their standard deviations)
Group 1 Group 2 Average
Mean SD Mean SD Mean SD Range Pf
Complete
n 430 506 936
Nitrogen (9) 10.1 2.2 9.9 2.3 10.1 2.2 59-17.7 0*001
Sodium (mmol) 110 36 117 42 114 39 14-328 0001
Volume (ml) 1934 648 1989 679 1958 664 66&5440 0.001 Duration of collection (h) 24.1 0.7 24.1 0.9 24.1 0.8 21.0-292 0.001
PABA (% recovery) 95 6 94 6 94 6 85-128 -
Potassium (mmol) 72 21 75 23 74 22 27-198 0.001
YO reporting losses 11 31 15 35 13 33 0.01$
Incomplete
n 177 142 319
PABA (% recovery) 71 15 72 12 72 14 1 6 8 4
Nitrogen (g) 9.0 2.3 8.7 2.2 8.8 2.3 24-156
Potassium (mmol) 58 19 62 20 60 20 16134
Sodium (mmol) 100 33 102 39 101 36 25-217
Volume (ml) 1563 612 1576 622 1568 617 340-3850
Duration of collection (h) 23.9 0 9 23.9 0.9 23.9 0.9 19.2-28.0
YO reporting losses 25 45 16 37 21 41
PABA, para-aminobenzoic acid.
* For details of subjects and procedures, see p. 532. 7 Incomplete v. complete averages compared. 2 Group 1, t 3.78; group 2, not significant.
al. 1990). Values for plasma carotenes, and erythrocyte folate tended to be higher and values for plasma tocopherol and retinol lower than those found in the randomly selected group. However, dissimilar methods of analysis, likely to produce discrepancies of this order, were used for folate in the two studies. Plasma cholesterol values were markedly lower in the present study, as were urine Na values. Urine K values were higher, as was 24 h urine volume.
Urine collections
536 S. A. B I N G H A M A N D OTHERS
of slightly (0.2 h) longer duration than those that were incomplete, and there was a smaller proportion of reported one or more missed specimens over the 24 h period in the complete sample in group 1. However, there were no differences in group 2.
Comparison of 24 h urine nitrogen output with recorded nitrogen intake from weighed records and grouping into quintiles
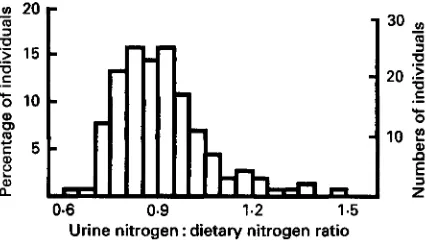
Comparisons between urine N and dietary N intake were not possible for the three individuals who submitted only a single complete urine collection, and the individual who had been taking paracetamol medication. In the remaining 156 individuals, average N intake from the 16 d records was 11.2 (SD 2-3) g/d, and that from N excretion in the complete 24 h urine 9.84 (SD 1.78) g/d, so that the average urine N : dietary N ratio was 0.91 (SD 0.09). The distribution of the urine N :dietary N ratio was not normal and is shown in Fig. 1 ; coefficients of skewness and kurtosis were 1.21 and 2.00. In the absence of a clear bimodal distribution, results were sorted and examined as quintiles of the distribution of the urine N : dietary N ratio. Means of this ratio varied from 0.76 in the lower quintile of the distribution to 1.13 in the upper quintile (Table 3), and these differences between means were significant
(P
<
0.001) for all quintiles. Correlations between urine N and dietary N were 0.98 to 0.99 in the bottom four quintiles of the distribution, but lower, 0.78, in the top quintile.Energy intakes, calculated BMR and the calculated energy intake : BMR ratio are also shown in Table 3. The average energy intake:BMR ratio of 1.15 in the top quintile was significantly different
(P
< 0-05) from that of the fourth quintile, but there was no significant difference in means between the fourth and third quintiles(P
>
0.05). The energy intake : BMR ratio was not correlated with the urinary N : dietary N ratio in the lower four quintiles of the distribution (r 0.03 to 0.12) but there was a significant inverse correlation in the top quintile (r -0-62). The thirteen subjects who submitted only two or three complete collections were fairly evenly distributed throughout the quintiles of the distribution and their energy intake: BMR ratios showed the same trends as the complete quintiles, with average ratios of 1.39, 1.58, 1.48, 1-23, and 0.98 (results not shown).Table 3 shows means and standard errors of anthropometric and other data from 156 individuals grouped into quintiles. There were clear trends in the urine K : dietary K ratio associated with the quintiles of urine N : dietary N ratio and correlations of 0.74 to 0.90 between urine K and dietary K within quintiles. Individuals in the top quintile had a significantly greater BMI and weight than those in the fourth quintile
(P
c
0-OS), but there were no significant differences between the average BMI and weight in individuals in the fourth compared with those in the third quintile(P
> 0.05). Individuals in the lower, second and fourth quintiles put on 0-4 to 1.2 kg over the year, but those in the top quintile did not gain or lose weight and those in the third quintile lost 0.3 kg weight. There was no consistent trend with height, although individuals in the lower quintiles of the distribution were 20 and 50 mm shorter on average than those in the other quintiles. No marked trends were evident in serum cholesterol or in plasma vitamins C and E across the quintiles of the distribution, although values for some carotenoids were significantly lower in the top quintile compared with the bottom quintile.V A L I D A T I O N OF D I E T A R Y ASSESSMENT M E T H O D S
537
fn 20
a
‘5
.-
15b
10EW 5 n
30 In
-
-
9
U
U
m
U
.-
204
9 10
;
Q) 2
6
.-
C
.-
.cQ 0
rn
a 2
Urine nitrogen : dietary nitrogen ratio
0.6 0.9 1.2 1.5
Fig. 1 . The distribution of 24 h urine nitrogen excretion: dietary nitrogen intake ratio obtained from 16 d weighed records in 156 women. For details of subjects and procedures, see pp. 532-534.
exceeded urine K by 2mmol in the top quintile (results not shown). There was no significant difference in social class index (assigning 1 to social class 1 and 5 to social class 5) between the upper and lower quintiles, upper quintile 2.51 (SD 0.18), lower quintile 2.35 (SD 0.16) (results not shown).
Table
4
shows intakes of nutrients by quintile of the distribution in urine N : dietary N ratio. Intakes were highest in the second quintile and lowest in the top quintile for energy and energy-yielding nutrients, Ca, retinol, NSP and fibre. Mean intakes of energy, fat protein and Ca were significantly lower in the top quintile compared with the fourth(P
<0.05) but there were no significant differences between the mean reported intakes of individuals of the fourth compared with those of the third quintile.
Intakes of cereals, milk, eggs, fats, fish and potatoes, and sugars were highest in the second quintile and lowest in the top quintile, but there was no such trend seen in consumption of meat, other vegetables and fruit. There were significant differences between reported consumption of milk, milk products and butter between the top and fourth quintiles (P
c
0.05) but there were no significant differences in average reported values of the fourth and third quintiles (results not shown). Since these and the data shown in Tables 3 and 4 indicated that mean values from individuals assigned to the top quintile were different from the others, data were recalculated and Table 5 shows differences in reported food and some nutrient intakes for the top quintile compared with those of the other four quintiles of the distribution in urine N:dietary N ratio. Mean consumption of cakes, breakfast cereals, milk, eggs, fats, and sugars was significantly lower in those individuals classified in the top quintile of the distribution, and intakes of energy and all energy- yielding nutrients significantly lower. On average there was an 18 g difference in reported fat consumption, and a 27 g difference in reported sugars consumption between the average values reported in the top and the other four quintiles according to the urine N:dietary N ratio.Assessments using different dietary methods
Table 6 shows reported mean nutrient intake of the same individuals classified into the lower four and the top quintiles of the urine N : dietary N ratio according to the weighed records, using three other methods of dietary assessment described elsewhere (Bingham et
Table 3. Mean values with their standard errors and correlation coeficients (r) for anthropometric and other variables from 156 individuals grouped into quintiles of the distribution according to their urine nitrogen:dietary nitrogen (UN: DN) ratio from 16 d weighed records$ Lower quintile 2nd quintile 3rd quintile 4th quintile Top quintile Mean SE Mean SE Mean SE Mean SE Mean SE ? n 31 31 32 31 31
z
1.13*** 0022 z UN:DN ratio 076*** 0.005 083*** 0003 0.89*** 0.003 0.96*** 0.004 Range 0.69479 0.79486 0.86493 093-1.00 1 .O(t1.47 0 Urine N (g) 8.76 0.23 9.74 0.36 10.34 0.27 10.56 0.35 10.89 0.30 Dietary N (g) 11.55 0.29 11.78 0.43 11.25 0.30 1 1.00 036 9.69 0.283 9
r UN v. DN 0.976 0.994 0.989 0.994 0.778 EI (MJ) 8.35 0.17 8.84 0.30 7.87 0.18 7.50 022 6.65t 0.23 EI : BMR ratio 1.54 003 1.60 0.05 1.40 0.03 1.32 004 1.15 0.04
'
0 ePlasma vitamins and carotenoids ($mol/l)ll 5 4 Retinol 2.0 0.1 2.0 3.8 2.0 0.1 2.0 0.1 2.0 0.1
*
a-Tocopherol 27 2 26 1 26 1 28 2 26 1t:
y-Tocopherol 1.9 0.2 2.4 0.3 2.1 1.2 24 02 2.4 0.3 U Lutein 045 0.03 0.47 0.04 0.39 0.03 044 005 0.323 0.03*
,5-Cryptoxanthine 0.26 0.02 028 0.04 0.29 0.03 0.30 006 024 004 =) p-Carotene 0.57 006 0.62 0.07 0.50 0.07 0.49 0.07 0.351 0.042
0003u
cis-Carotene 0-05 0-005 0.05 0.004 0.05 0-006 004 0005 004 Food restraint measures1 m Vitamin C 69 5 59 4 62 4 60 4 61 Lycopene 0.33 0.02 0.36 0.04 028 0.03 0.30 006 024 0-04g
a-Carotene 0.12 0.02 0.13 0.02 0.1 1 0.01 0.1 1 002 0073 0.01 CI Restraint DEBQ 5.08 0.84 8.41 0.92 669 0.76 7.25 1.00 857$ 1.222
Restraint SMQ 6.50 1.11 8.88 0.87 9.33 1.18 9.73 1.36 11.713 1.1 1 w Hunger SMQ 4.30 0.84 3.00 0.63 4.27 0.73 3.33 0.63 3.43 0.815
A Wt S4 (kg) - 047 0.18-
0.23 0.15 -056 0.17 -0.16 018 -0.36 0.29 CA A Wt life (kg) 10.09 2.15 13-23 1.57 15-86 2.3 1 13.46 238 17.46 3.375
5 4
Fl
540 S. A. BINGHAM A N D OTHERS
1 2 3 4 5
Quintiles of distribution
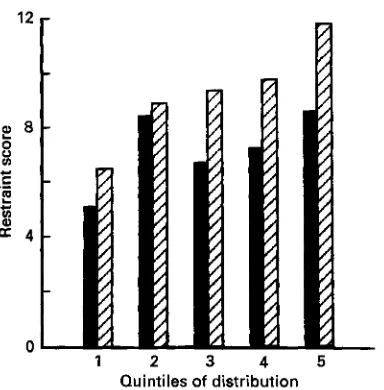
Fig. 2. Relation of two measures of restrained eating, Stunkard & Messick (1985) questionnaire
(m)
and Dutch eating behaviour questionnaire(m),
to quintiles of the urinary nitrogen: dietary nitrogen ratio established from weighed records and 24 h urine collections in eighty women volunteers. For details of subjects and procedures, see pp. 532-534.Table
4.
Mean values with their standard errors of daily nutrient intake from 156 individualsgrouped into quintiles of the distribution according to their urine nitrogen :dietary nitrogen ratio from 16 d weighed records?
Lower quintile 2nd quintile 3rd quintile 4th quintile Top quintile
Mean SE Mean SE Mean SE Mean SE Mean SE
n
Energy (MJ) Protein (9)
Starch (9)
YO E protein
YO E fat
% E carbohydrate
YO E alcohol Iron (mg) Calcium (mg)
NSP (g)
Fibre (g) Alcohol (9) Retinol (ug) Carotene (g) Vitamin C (mg) Dietary vitamin C Fat k)
sugars (g)
including supplements (mg)t
31 31 32 31 31
8.35 72 82 115 122 14 37 45 3.0 12.7 157 22.7 8.5 3.5 1027 805 94 98 0.17 2 3 5 6 0 3 0.8 0 9 0.6 0.6 0.7 0.9 1.8 108 0.3 5 35 8.84 73 87 121 132 14 37 45 2.8 13.3 168 23.4 9.2 3.7 1075 990 108 101 0.30 3 3 6 7 0.4 0.9 1.6 0.8 0.7 1.1 1.5 3.3 184 0.4 8 48 7.87 70 77 110 107 15 37 44 3.5 14.0 164 22.5 8.9 3.1 988 736 104 99 0.18 2 3 5 6 0.4 0.9 1.1 0.8 0.7
1 -0
1.4 1.9 131 0.3 8 41
7.50 0.22
68 2
74 3
108 5
98 5
15 0.6 37 1.0
44 1.1
3.4 0.6 12.5 0.7
15.5 0.7 21.5 1.2 9.0 1.7 908 39
759 135
92 6
109
3.7 0.4
6,65* 60* 62* 100 88 16 35 45 3.6 11.9 785* 14.6 20.4 8.6 3.5 762 95 101 023 2 2 5 2 0 5 0.5 1.0 0.9 0.7 0.9 1.3 2.1 129 0.4 8 36
% E, percentage of dietary energy; NSP, non-starch polysaccharides.
* Mean values were significantly different from those for the 4th quintile, P < 0.05.
t
For details of subjects and procedures, see pp. 532-534.V A L I D A T I O N OF D I E T A R Y ASSESSMENT M E T H O D S 54 1
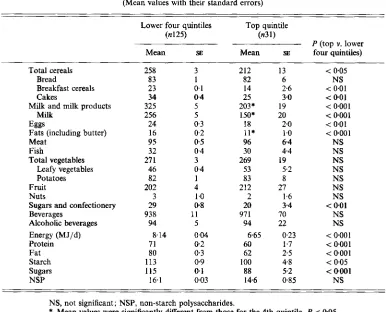
Table 5. Food and nutrient intakes ( g l d ) from 156 individuals grouped into the top v. the other four quintiles of the distribution according to their urine nitrogen: dietary nitrogen ratio from
16 d weighed records?
(Mean values with their standard errors)
Lower four quintiles Top quintile
(n125) (n31)
P (top v. lower
Mean SE Mean SE four quintiles)
~ ~~ ~ ~~~~
Total cereals 258 3 212 13 < 0.05
Bread 83 1 82 6 NS
Breakfast cereals 23 0.1 14 2.6 < 0.01
Cakes 34 0.4 25 3.0 < 0.01
Milk and milk products 325 5 203* 19 < 0.001
Milk 256 5 150* 20 < 0001
Eggs 24 0.3 18 2.0 < 0.01
Fats (including butter) 16 0 2 11* 1
.o
< 0.001Meat 95 0.5 96 6.4 NS
Fish 32 0.4 30 4.4 NS
Total vegetables 27 1 3 269 19 NS
Leafy vegetables 46 0.4 53 5.2 NS
Potatoes 82 1 83 8 NS
Fruit 202 4 212 27 NS
Nuts 3 1 .O 2 1.6 NS
Sugars and confectionery 29 0.8 20 3 4 < 0.01
Beverages 938 1 1 971 70 N S
Alcoholic beverages 94 5 94 22 NS
Energy (MJ/d) 8.14 0.04 6.65 023 < 0.001
Protein 71 0 2 60 1.7 < 0.001
Fat 80 0 3 62 2.5 < 0.001
Starch 113 0.9 100 4.8 < 0.05
Sugars 115 0.1 88 5.2 < 0.001
NSP 16.1 003 14.6 0.85 NS
NS, not significant; NSP, non-starch polysaccharides.
* Mean values were significantly different from those for the 4th quintile, P < 005.
t
For details of subjects and procedures, see pp. 532-534.Correlations between diet and biological indices of diet
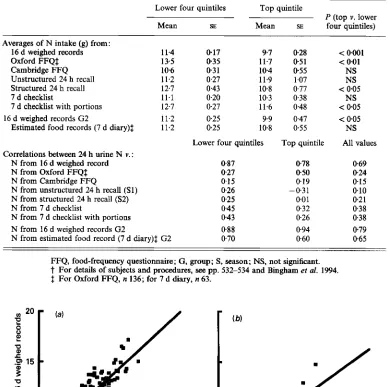
Table 7 shows averages of dietary N intake and of urine N from different methods of dietary assessment in the 156 individuals grouped into the lower four v. the top quintiles of the distribution according to the urine N: dietary N ratio from the 16 d weighed records.
As for the weighed records, significant differences in mean intakes between the top and the other four quintiles were found for the Oxford food-frequency questionnaire, the structured 24 h recall, and the 7 d checklist with portions. No significant differences in mean intakes were apparent for results obtained from the Cambridge food-frequency questionnaire, the unstructured 24 h recall, the estimated food record (7 d diary) and 7 d checklist.
Correlations between dietary N intake and dietary assessment methods were highest for the weighed records (0.87 lowest four quintiles, 0.78 top quintile, 0.69 all values combined). The regression coefficient of the slope of the relationship between urine N (independent variable) and dietary N (dependent variable) was 0.724 (SE 0.107) in the upper quintile, which was not significantly different from that in the lower four quintiles combined (0933
(SE 0.047), t 1.79, P
>
0.05; Fig. 3).542 S. A. B I N G H A M A N D O T H E R S
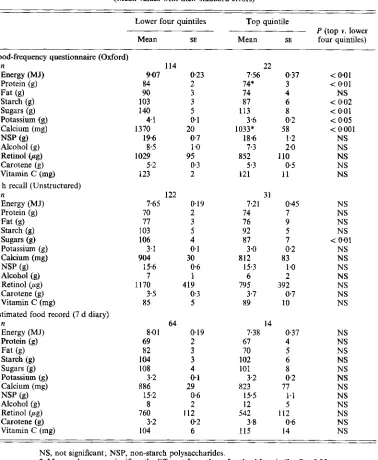
Table 6. Daily nutrient consumption from food-frequency questionnaires, 24 h recalls and
estimated menu records (7 d diaries) from I56 individuals grouped into the top v. the lower four quintiles of the distribution according to their urine nitrogen: dietary nitrogen ratio from
16 d weighed records?
(Mean values with their standard errors)
Lower four quintiles Top quintile
P (top v. lower
Mean SE Mean SE four quintiles)
Food-frequency questionnaire (Oxford) n
Energy (MJ)
Protein (g) Fat (g) Starch (g) Sugars (g) Potassium (g) Calcium (mg)
NSP (g)
Alcohol (g) Retinol (ag) Carotene (g) Vitamin C (mg)
n
Energy (MJ) Protein (g) Fat (8) Starch (g) Sugars (g) Potassium (g) Calcium (mg) NSP (g) Alcohol (g) Retinol @g) Carotene (g) Vitamin C (mg)
n
Energy (MJ) Protein (g)
Starch (g)
Potassium (g) Calcium (mg)
Alcohol (g) Retinol Gg) Carotene (g)
Vitamin C (mg) 24 h recall (Unstructured)
Estimated food record (7 d diary)
Fat (€9
Sugars (g)
NSP (8)
114
84 2
90 3
103 3
140 5
9.07 0.23
4.1 0 1
19.6 0.7 8.5 1
.o
5.2 0.3
1370 20 I
1029 95
123 2
122
70 2
77 3
103 5
106 4
3.1 0.1
904 30
15.6 0.6
7 1
1170 419
3.5 0.3
85 5
7.65 0.19
64 8.01 0.19
69 2
82 3
104 3
108 4
3.2 0.1
886 29
15.2 0.6
8 2
760 I12
3.2 0 2
104 6
22
74* 3
74 4
87 6
113 8
1033* 58 756 0.37
3.6 0.2
18.6 1.2 7.3 2.0
5.3 0.5
852 110
121 11
31
74 7
76 9
92 5
87 7
3.0 0.2
812 83
15.3 1
.o
6 2
795 392
3.7 0.7
89 10
7.2 1 0.45
14
67 4
70 5
102 6
101 8
3.2 0.2
823 77
15.5 1.1
12 5
542 112
115 14
7.38 0.37
3.8 0 6
< 0.01 < 0.01 NS < 0.02 < 0.01 < 0.05 < 0~001
NS NS NS NS NS NS NS NS NS < 0.01
NS NS NS NS NS NS NS NS NS NS NS NS NS NS NS NS NS NS NS
NS, not significant; NSP, non-starch polysaccharides.
V A L I D A T I O N O F D I E T A R Y A S S E S S M E N T M E T H O D S 543
Table 7. Comparisons between dietary nitrogen intake from diflerent methods of dietary
assessment and 24 h urine nitrogen in 156 individuals grouped into the top v. the lower four quintiles of the distribution according to their urine nitrogen:dietary nitrogen ratio from 16 d weighed recordst
Lower four quintiles Top quintile
P (top v. lower
Mean SE Mean SE four quintiles)
Averages of N intake (g) from:
16 d weighed records 11.4
Oxford FFQ$ 135
Cambridge FFQ 106
Unstructured 24 h recall 11.2 Structured 24 h recall 12.7
7 d checklist 11.1
7 d checklist with portions 12.7 11.2 11.2 16 d weighed records G2
Estimated food records (7 d diary)$
Correlations between 24 h urine N v. : N from 16 d weighed record N from Oxford FFQ$ N from Cambridge FFQ
N from unstructured 24 h recall (Sl) N from structured 24 h recall (S2) N from 7 d checklist
N from 7 d checklist with portions N from 16 d weighed records G2
N from estimated food record (7 d diary)$ G2
0.17 9.7
0-35 11.7
0 3 1 104
0.27 11.9
0.43 10.8
0.20 10.3
0.27 11.6
0.25 9.9
0.25 10.8
Lower four quintiles
0.87 027 015 0.26 0.25
0.45
0.43
0.88
0.70
0.28 031 055 1.07 0.77 0.38 0.48 0.47 0.55
Top quintile
0.78 050 019 - 0.3 1 001 032 0.26 0.94 0.60
< 0.001 < 001
NS
NS
< 0.05
NS
< 0.05 < 0.05
NS
All values
0.69 024 015 0.10 0.2 1 0.38 0.38 0.79
0.65
FFQ, food-frequency questionnaire; G, group; S, season; NS, not significant.
t
For details of subjects and procedures, see pp. 532-534 and Bingham et al. 1994. $ For Oxford FFQ, n 136; for 7 d diary, n 63.10 15 20 5 10 15 20
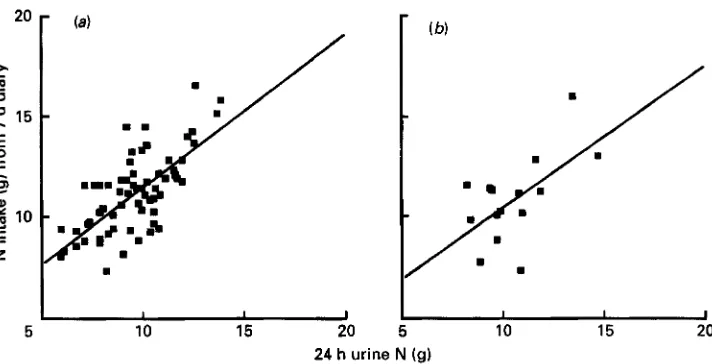
24 h urine N (g)
S. A. B I N G H A M A N D OTHERS
1 I I
10 15 20
I I I
10 15 20
24 h urine N (g)
Fig. 4. The relationship between 24 h urine nitrogen and dietary nitrogen established from a 7 d estimated food record (diary) in individuals from (a) the lower four quintiles and (b) the top quintile of the urinary nitrogen:dietary nitrogen ratio distribution established from weighed records. For details of subjects and procedures, see pp. 532-534.
questionnaires and 24 h recalls were much lower, 0.1 to 0.2. There did not appear to be differences between groups of individuals classified into the top v. the other four quintiles, apart from a negative correlation (- 0.3 1) between urine N and dietary N in the top quintile of 24 h recall data and a positive correlation (0.50) in the top quintile of Oxford food- frequency questionnaire data. Correlations were in the order of 0.2 to 0.4 for checklist methods.
When group 2 was considered separately the mean value for dietary N intake in the top quintile was significantly lower than in the other four quintiles (Table 7), as before. Correlations between urine N and dietary N in the lower four quintiles were the same (0.88) as in group 1 and 2 combined data. However, the correlation was rather higher in the top quintile, 0.94. The correlations between urine N and dietary N from the 7 d diary were 0.60
and 0.70, which compared well with coefficients
of
0.88 and 0.94 obtained with weighed intake data. Fig. 4 shows 24 h urine N values in relation to dietary N values from the 7 d estimated food record. Regression coefficients were not significantly different (0.701(SE 0.262) upper quintile, lower four quintiles 0.757 (SE 0.098), t 0.02, P
>
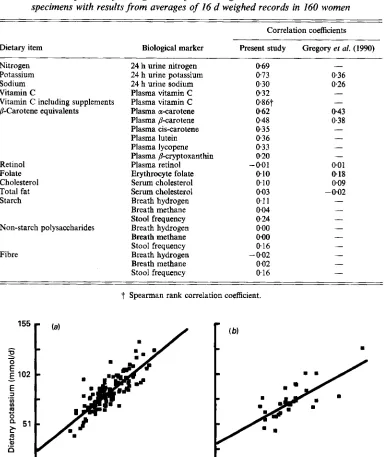
0.05).Table 8 shows correlations between dietary variables from the 16 d weighed record averages and other analytes in urine, blood and breath. There was a high correlation (0.73) between 24 h urine K excretion and dietary K intake. Fig. 5 shows the relationship between these variables for individuals in the top and lower four quintiles of the distribution of urine N:dietary N (v 0-78 top quintile, Y 0.87 other four quintiles). The correlation between
plasma vitamin C and dietary vitamin C with values from supplements added to values obtained from dietary records, was 0.86 (Spearman rank coefficient). The maximum plasma vitamin C value was 15 1 ,umol/l and the minimum 6 prnol/l, with evidence of a plateau in values between 100 and 150 ,umol/l even with very high supplementation levels (Fig. 6 ) .
V A L I D A T I O N OF D I E T A R Y A S S E S S M E N T M E T H O D S 545
Table 8 . Comparison of average results from biological markers in urine and other specimens with results from averages of I6 d weighed records in 160 women
Correlation coefficients
Dietary item
~ ~~~~
Biological marker Present study Gregory et al. (1990)
Nitrogen 24 h urine nitrogen 069 -
Potassium 24 h urine potassium 013 0.36
Sodium 24 h urine sodium 0.30 026
Vitamin C Plasma vitamin C 032 -
Vitamin C including supplements Plasma vitamin C 086t -
/&Carotene equivalents Plasma a-carotene 0 6 2 043
Plasma p-carotene 0.48 0.38
Plasma cis-carotene 0.3 5
Plasma lutein 0.36
-
Plasma lycopene 033 -
Plasma /3-cryptoxanthin 020 -
Retinol Plasma retinol
-
0.0 1 0.0 1Folate Erythrocyte folate 0.10 0.18
Cholesterol Serum cholesterol 0.10 0.09
Total fat Serum cholesterol 0.03 - 0.02
Starch Breath hydrogen 0.1 1 -
Breath methane 0.04 -
Stool frequency 0.24
-
Non-starch polysaccharides Breath hydrogen 000 -
Breath methane 0.00 -
Stool frequency 016 -
Fibre Breath hydrogen - 002 -
Breath methane 0.02 -
Stool frequency 0.16 -
-
t
Spearman rank correlation coefficient.155
0 5 0 100 150 0 50 100 150
Urine potassium (mrnol/d)
Fig. 5. Dietary potassium intake from 16 d weighed records in relation to average urine potassium excretion from
546 S. A. B I N G H A M A N D OTHERS
0 5
.-
100CI
s
.-
>m
E
m-
a 50
.
.
.
.
0 0.05 0.15 0.4 1 3 8
Diet plus supplementary vitamin C (gid)
Fig. 6 . Logarithmic plot of plasma vitamin C @mol/l) in relation to log e vitamin C intake (g/d) from weighed records and records of vitamin supplements in 156 women. For details of subjects and procedures, see
pp. 532-534.
D I S C U S S I O N
The assessment of habitual food intake is one of the most problematic tasks in human nutrition, and even weighed records, regarded in the past as ‘gold standards’, have been criticized (Bingham, 1987). However, despite evidence of underrecording in one quintile of this volunteer group, and often-expressed doubts about the accuracy of the weighed intake technique, it was in remarkable agreement with two biological markers of food intake, the
24 h urine N and K (Table 3). Table 7 shows that it easily outperformed other simpler epidemiological methods in correlation analyses when compared with 24 h urine N.
The next best method was the 7 d estimated food diary or record (Table 7). This method also gave results for foods and nutrients that were closest to those of the 16 d weighed records (Bingham et al. 1994). Some confidence can therefore be placed in the results obtained from the 7 d diary. Problems with the food-frequency questionnaires used here have been described elsewhere (Bingham et al. 1994) and the low correlations with single 24 h recalls are to be expected from the known effect of attenuation due to day-to-day variation.
V A L I D A T I O N O F D I E T A R Y ASSESSMENT METHODS 547
When using 24 h urine collections to validate dietary assessments, the importance of including a 24 h urine collection marker to check compliance is shown in the present study, which found highly significant differences in excretion of 24 h urine analytes and volume between samples designated complete by the PABAcheck method, and those that were incomplete. Samples designated incomplete were of shorter duration and contained a larger proportion of reported missed samples (Table 2). Only samples that were complete were used for comparison with dietary intake data, so that the baseline for each individual varied from two to eight complete collections. The precision of estimates of urine N and other analyte excretion in those individuals who submitted less than four complete collections would have been reduced, but in the thirteen individuals who collected only two to three complete 24 h samples the energy intake: BMR ratio was similar to that obtained from individuals who did comply with the urine collection protocol to a greater extent and submitted four or more complete collections.
The urine N : dietary N ratio was 9 1 YO, rather greater than the expected ratio of 80 YO for a group established elsewhere (Bingham & Cummings, 1985), despite the fact that the group as a whole increased their body weight by an average of 040 kg over the year. These findings suggested bias in the estimation of dietary intake, either in the group as a whole or in a proportion of individuals within the group. There was no evidence of a bimodal distribution in the urine N:dietary N ratio (Fig. l), which would have allowed a clear cut- off point between those individuals whose dietary N intake was within the expected physiological limits of 80 (SD 5)% urine N excretion (Bingham & Cummings, 1985). However, when sorted into quintiles of the distribution in urine N:dietary N ratio, the top quintile was clearly different from the rest, with a lower correlation between urine N and dietary N (0.78), an inverse association between the energy intake:BMR ratio ( r -0.61),
not apparent in the other 80 % of the distribution, and a significantly greater average BMI
of 26.6 kg/m2 than that
of
the adjacent quintile of the distribution. The average energyintake:BMR ratio of 1.15 was below the physiological limits that would match energy expenditure with no gains or losses of weight (Goldberg et al. 1991). Since, over the year, this group neither gained nor lost weight, it has to be concluded that individuals in this 20% of the distribution were not reporting their usual diet.
To investigate this further, group 2 volunteers were weighed immediately before and after weighing their food over the last 4 d of the study, and assessed for their tendency to restrain their food consumption. The 0.36 kg lost over 4 d by individuals in the top quintile would have been equivalent to a daily loss of 90 g whole-body tissue, or 25 g fat-free mass. This however would contain only 0.7 g N and 1.5 mmol K (Garrow, 1993), compared with the average negative N balance of 2.7 g, and negative K balance of 10 mmol found after comparisons of dietary and urine data and allowance for faecal losses. It is probable therefore that the failure of the dietary records to match the urine output and BMR data was mainly caused by errors and omissions, rather than changes in habitual dietary habits in an attempt to slim or simplify the procedure whilst weighing food.
Questions from both the restrained-eating questionnaires indicated that individuals in the top quintile of the distribution were more restrained eaters than others (Fig. 2). Black
et al. (1994) have also shown that successful slimmers who underreport their food intake are more likely to be restrained eaters. The relationship between urine N:dietary N index and restrained-eating score, though significant, ( r 0.29) was not strong in this group of relatively unselected individuals. There was no relationship between hunger and disinhibition scores and underreporting, nor between gain or loss of weight over the year and restrained eating. Individuals in the fourth quintile gained on average the most weight
(1.2 kg), yet had a higher score than those in the third quintile, who lost on average 0.27 kg
548 S. A. B IN GHA M A N D OTHERS
in underreporting (Black et al. 1991) recorded by individuals in the top quintile failed to reach significance when compared with the average reported by subjects in the lower quintile. There was no discernible difference in social class index across quintiles of the distribution.
Underreporting by obese individuals and patients has been documented for some time (Steen et al. 1977; Prentice et al. 1985; Lichtman et al. 1992; Hallfrisch, 1994). Total energy expenditure assessed from the doubly-labelled water technique has shown evidence of underreporting of energy intake in overweight and normal weight individuals (Prentice et al. 1985; Livingstone et al. 1990; Schoeller, 1990). However, this technique is expensive and the energy intake : BMR ratio has been suggested as a means of assessing the likely validity of group estimates of energy intake, since in the absence of gain or loss of weight it must equal the total energy expenditure:BMR ratio (Bingham, 1987; Goldberg et al. 1991). The average values obtained from 80 Yo of volunteers were 1.3 to 1.6, and the overall average of 1-47 was close to the value of 1.50 suggested as an acceptable value for the validity of a dietary survey of 14 d observations on 100 subjects (Black et al. 1991). The coefficient of variation between measured and calculated BMR for individuals (World Health Organization, 1985) is in the order of 10% and hence, when coupled with uncertain estimates of total energy expenditure to metabolic rate, the precision of this ratio for individual estimates of validity is low (Goldberg et al. 1991). There are also limits of precision of the urine N : dietary N ratio. Table 2 shows there was no association between these two variables in subjects with normal records, but a strong association in the overweight underreporters in the top quintile of the distribution in urine N: dietary N ratio
According to their records, underreporters in the top quintile of the distribution of dietary N from weighed records consumed significantly less milk than other subjects, and significantly less cakes, sugars, fats, and breakfast cereals (Table 5). As a result, differences in nutrient intake were not confined to protein but intakes of fat, sugars, starch and energy were also significantly lower, as were intakes of K, Ca and Fe (Table 5 ) . There were no discernible differences in bread, potatoes, meat or vegetable and fruit consumption between underreporters and other subjects, so that intakes of NSP, fibre, carotene and vitamin C were the same in all groups. The validity of this finding is supported by the fact that there were no significant differences between quintiles in the blood analytes erythrocyte folate and plasma vitamin C, of which the major dietary sources are fruit and vegetables (Table 2). Plasma levels of the carotenoids tended to be higher in the group as a whole than those of a national sample reported by Gregory et al. (1990; Table l), as were intakes of fruit and vegetables (Table 5 and Gregory et al. 1990). The differences in folate levels between the national group and this group are more likely to be attributable to difficulties with analytical methods than to differences in vegetable consumption. Methods for the analysis of carotenes were compatible, and as in the study of Gregory et al. (1990), dietary
p-
carotene equivalents correlated well with a-carotene (Table 8, r 0.62). However a single food, carrot, is the main dietary source of a-carotene. The correlations were less good with the major source in food, p-carotene ( r 0.48) which is derived from several foods.V A L I D A T I O N O F D I E T A R Y A S S E S S M E N T M E T H O D S 549 No values were obtained for plasma vitamin C in the national survey but in the present study dietary and plasma vitamin C levels were highly correlated, especially when dietary intakes were corrected for high intakes occurring as a result of supplements of vitamin C (Fig. 6). Serum cholesterol was lower, as was fat as a percentage of energy intake, 36%
energy in the present survey (Bingham et al. 1994), 38 % energy in the survey of Gregory et al. (1990). The poor relationship between dietary cholesterol and serum cholesterol seen in Table 8 is well known (Willett, 1990). Saturated fat would be expected to correlate to some degree with serum cholesterol, but only values for total fat were available for analysis in the present study. Stool frequency was related weakly to starch, NSP and fibre intake, but there was no relationship of stool frequency with fasting levels of breath H, and CH,. Subsequent studies have established that evening rather than early morning samples of breath H, and CH, are better predictors of dietary intake
of
fermentable carbohydrate (Le Marchand et al. 1992; McKeown, 1992).Vitamin C , N and K apart, the weak relationships between analytes and dietary intake would suggest that their scope in validating or even replacing dietary assessments is limited, although some are a useful adjunct to dietary records. This is despite the fact that the correlations between dietary and serum and urine analytes found here were in general somewhat greater than those found in the national sample of adults (Table 8) probably due to reduction of attenuation by a greater number of observations on each individual.
Overall, the use of biological markers, especially the 24 h urine N and K output, has been shown to be a useful adjunct to detailed weighed records kept by a relatively large sample of volunteers over one year. Simple comparisons between methods of dietary assessment are unlikely to show that results from one method agree with another (Bingham, 1987), but confidence in a particular method is forthcoming if the results from it agree with an external marker, in this case the 24 h urine N and K. Weighed records remain the most accurate measure of dietary intake, but for epidemiological and surveillance purposes it would seem that estimated food records are able to approach this accuracy.
The subjects who took part in the study are gratefully thanked for their assistance. Mrs E. Blackwell and undergraduate students from Coleraine, Surrey, and Wageningen Universities and Leeds Polytechnic were extensively involved in the collection and interpretation of the field work and laboratory analyses. The general practitioners who assisted in the recruitment of volunteers are also thanked. Additional support for this study was obtained from Beach Villas, J. Sainsbury, the Cancer Research Campaign, the Ministry of Agriculture, Fisheries and Food, and the Vegetarian Society.
R E F E R E N C E S
Bates, C. J. & Cowen, T. D. (1988). Effects of age and dietary vitamin C on the contents of ascorbic acid and acid-
soluble thiol in lens and aqueous humour of guinea pigs. Experimental Eye Research 46, 937-945.
Bingham, S. (1987). The dietary assessment of individuals; methods, accuracy, new techniques and
recommendations. Nutrition Abstracts and Reviews 57, 70S742.
Bingham, S. & Cummings, J. H. (1983). The use of 4-aminobenzoic acid as a marker to validate the completeness
of 24 h urine collections in man. Clinical Science 64, 629-635.
Bingham, S. & Cummings, J. H. (1985). Urine nitrogen as an independent validatory measure of dietary intake:
a study of nitrogen balance in individuals consuming their normal diet. American Journal of Clinical Nutrition
42, 12761289.
Bingham, S. A., Gill, C., Welch, A,, Day, K., Cassidy, A,, Khaw, K. T., Sneyd, M. J., Key, T. J. A., Roe, L. &Day,
N. E. (1994). Comparison of dietary assessment methods in nutritional epidemiology: weighed records v. 24 h
recalls, food-frequency questionnaires and estimated-diet records. British Journal of Nutrition 72, 61M43.
Bingham, S., Williams, D. R. R., Cole, T. J., Price, C. P. & Cummings, J. H. (1988). Reference values for analytes
550 S. A. BINGHAM A N D OTHERS
Black, A. E., Goldberg, G. R., Jebb, S. A., Livingstone, M. B. E., Cole, T. J. & Prentice, A. M. (1991). Critical evaluation of energy intake data using fundamental principles of energy physiology. 2. Evaluating the results of published surveys. European Journal of Clinical Nutrition 45, 583-599.
Black, A. E., Jebb, S. A., Bingham, S., Runswick, S. & Poppit, S. (1995). The validation of energy and protein intakes by doubly labelled water and 24 h urine N excretion in post obese subjects. Journal of Human Nutrition and Dietetics (In the Press).
Fuller, N. J., Bates, C. J. & Scott, K. J. (1983). A radioassay for folate in red cells. Clinica Chimica Acta 131,
Garrow, J. (1993). Composition of the body. In Human Nutrition and Dietetics, pp. 13-23 [J. Garrow and W. P. T. James, editors]. Edinburgh: Churchill Livingstone.
Gibson, G . R., Cummings, J. H., MacFarlane, G. T., Allison, C., Segal, I., Voster, H. H. & Walker, A. R. P.
(1990). Alternative pathways for hydrogen disposal during fermentation in the human colon. Gut 31,679-683.
Goldberg, G. R., Black, A. E., Jebb, S. A., Cole, T. J., Murgatroyd, P. R., Coward, W. A. & Prentice, A. M.
(1991). Critical evaluation of energy intake data using fundamental principles of energy physiology. 1.
Derivation of cut-off limits to identify under-recording. European Journal of Clinical Nutrition 45, 569-581,
Gregory, J., Foster, K., Tyler, H. & Wiseman, M. (1990). The Dietary and Nutritional Survey of British Adults. London: H.M. Stationery Office.
Hallfrisch, J. (1995). What do people really eat? In Proceedings of the Fgteenth International Congress OfNutrition, Adelaide (In the Press).
Isaksson, B. (1980). Urinary nitrogen output as a validity test in dietary surveys. American Journal of Clinical Nutrition 33, 4 5 .
Le Marchand, L., Wilkens, L. R., Harwood, P. & Cooney, R. V. (1992). Use of breath hydrogen and methane as markers of colonic fermentation in epidemiologic studies: Circadian patterns of excretion. Environmental Health Perspectives 98, 199-202.
Lichtman, S. W., Pisarska, K., Berman, E. R., Pestone, M., Dowling, H., Offenbacher, E., Weisel, H., Heshka,
S., Matthews, D. E. & Heymsfield, S. B. (1992). Discrepancy between self-reported and actual caloric intake and exercise in obese subjects. New England Journal of Medicine 327, 1893-1898.
Livingstone, M. B. E., Rentice, A. M., Strain, J. J., Coward, W. A., Black, A. E., Barker, M. E., McKenna, P. G. & Whitehead, R. G. (1990). Accuracy of weighed dietary records in studies of diet and health. British Medical Journal 300, 708-712.
McKeown, A. (1992). Hydrogen and methane production in man. Industrial Project Report, Coleraine University.
Margolis, S. A. & Davis, T.P. (1988). Stabilization of ascorbic acid in human plasma and its liquid- chromatographic measurement. Clinical Chemistry 34, 2217-2223.
Prentice, A. M., Coward, W. A,, Davies, H. L., Murgatroyd, P. R., Black, A. E., Goldberg, G. R., Ashford, J., Sawyer, M. & Whitehead, R. G. (1985). Unexpectedly low levels of energy expenditure in healthy women. Lancet i, 1419-1422.
343-348.
Schoeller, D. A. (1990). How accurate is self-reported dietary energy intake? Nutrition Reviews 49, 373-379.
Schofield, W. N., Schofield, C. & James, W. P. T. (1985). Basal metabolic rate. Human Nutrition: Clinical Nutrition 39C, Suppl. 1, 1-96.
Steen, B., Isaksson, B. & Svanborg, A. (1977). Intake of energy and nutrients and meal habits in 70-year-old males and females in Gothenburg, Sweden. A population study. Acta Medica Scandinavica 611, Suppl., 3F86.
Stunkard, A. J. & Messick, S. (1985). The three-factor eating questionnaire to measure dietary restraint, disinhibition and hunger. Journal of Psychosomatic Research 29, 71-81.
Thurnham, D. I., Smith, E. & Flora, P. S. (1988). Concurrent liquid chromatographic assay of retinol, a-
tocopherol, P-carotene, a-carotene, lycopene and P-cryptoxanthin in plasma with tocopherol acetate as internal standard. Clinical Chembtry 34, 377-381.
van Strien, T., Frijters, J. E. R., Bergers, G. P. A. & Defares, P. B. (1986). The Dutch eating behaviour questionnaire for assessment of restrained, emotional, and external eating behaviour. International Journal of Eating Disorders 5 , 295-315.
Willett, W. (1990). Nutritional Epidemiology. New York: Oxford University Press.
World Health Organization (1985). Energy and Protein Requirements. Technical Report Series no. 724. Geneva: WHO.