Scholarship@Western
Scholarship@Western
Electronic Thesis and Dissertation Repository
8-24-2017 12:00 AM
Triple Positive Microparticles as a “Liquid Biopsy” for Risk
Triple Positive Microparticles as a “Liquid Biopsy” for Risk
Stratification of Prostate Cancer
Stratification of Prostate Cancer
Harmenjit Singh BrarThe University of Western Ontario
Supervisor
Pautler, Dr. Stephen
The University of Western Ontario Co-Supervisor Power, Dr. Nicholas
The University of Western Ontario Co-Supervisor Leong, Dr. Hon
The University of Western Ontario Graduate Program in Surgery
A thesis submitted in partial fulfillment of the requirements for the degree in Master of Science © Harmenjit Singh Brar 2017
Follow this and additional works at: https://ir.lib.uwo.ca/etd
Part of the Surgery Commons, and the Urology Commons
Recommended Citation Recommended Citation
Brar, Harmenjit Singh, "Triple Positive Microparticles as a “Liquid Biopsy” for Risk Stratification of Prostate Cancer" (2017). Electronic Thesis and Dissertation Repository. 4933.
https://ir.lib.uwo.ca/etd/4933
This Dissertation/Thesis is brought to you for free and open access by Scholarship@Western. It has been accepted for inclusion in Electronic Thesis and Dissertation Repository by an authorized administrator of
ii
Abstract
Prostate cancer remains a substantial contributor to cancer-related mortality worldwide.
Current screening methods include obtaining a PSA blood test. However, controversy
surrounds its use as it is neither sensitive nor specific.
Nanoscale flow cytometry is a type of microfluidics-based technology that allows
enumeration of submicron tumor fragments known as microparticles (MPs). In this study,
prostate specific microparticles in patient plasma were targeted using fluorophore-conjugated
antibodies. Targeted cell surface antigens or biomarkers include: prostate specific membrane
antigen (PSMA), six-transmembrane epithelial antigen of the prostate-1 (STEAP1), ghrelin
receptor (GHSR1a) and CD151.
A statistically significant difference in the level of MP levels was measured with
PSMA+STEAP1+GHSR1a and PSMA+STEAP1+CD151 triple-expressing MPs when
comparing Gleason score (GS) 6 to GS3+4, GS4+3 and GS≥8 cohorts. In this pilot and
exploratory study, I show that MPs have the potential of becoming a “liquid biopsy” that can
assist in risk stratification prior to a prostate needle biopsy.
Keywords
Prostate Cancer, Prostate Neoplasm, Microparticles, Oncosomes, Prostasomes, Extracellular
Vesicles, Nanoscale Flow Cytometry, Prostate Specific Membrane Antigen,
iii
Co-Authorship Statement
Dr. Stephen Pautler: Interpreted data with clinical correlations and structure of written thesis.
Dr. Nicholas Power: Interpreted data with clinical correlations and structure of written thesis.
Dr. Hon Leong: Designed study and supervised day to day activities regarding the technical aspects of the project.
iv
Acknowledgments
I would like to express my deepest appreciation to a key number of people who helped
immensely in the completion of this thesis. Firstly, a special thanks to my graduate
committee. Dr. Stephen Pautler, you have been such an integral component in my development as a scientist and surgical resident. I cherish all the mentorship I’ve received
over the course of the year and will continue to build on the lessons you have taught. All
your feedback has been vital in my growth and I appreciate all the challenges you have put
forth to enhance my development. Dr. Nicholas Power, I cannot thank you enough for your
constant support through this entire process. Your words of encouragement and advice were
key to the success of this manuscript. Your continuous, timely feedback meant a great deal
and I thank you for the willingness to mentor me with your busy schedule. Dr. Hon Leong,
thank you for everything that you have done in developing me as a scientist. With your
support, I was able to achieve new reaches that I only once dreamt about. You were always
available when most needed and I appreciate you made sure I got the help I need.
Through this whole process, I have one member of the lab that was instrumental in the
completion of this manuscript. Dr. Fabrice Lucien, thank you so much for the day to day feedback and help with troubleshooting throughout this process. Your support and assistance
with data analysis meant a great deal.
Finally, I want to thank my family. Your constant support and love were integral in me
achieving my goals. Especially to my mother, words cannot express enough gratitude for all
your sacrifices and prayers that helped me become that man I am today. To my late father,
although our time together was cut short you remain a major role model and help drive me to
become something more. I want to thank my brother and sister for always being there for
me no matter what. Your words of encouragement and casual conversations on the phone
help bridge the gap of being away from home while I get to do what I love.
v
Table of Contents
Abstract ... ii
Co-Authorship Statement ... iii
Acknowledgments ... iv
Table of Contents ... v
List of Abbreviations ... viii
List of Tables ... x
List of Figures ... xi
List of Appendices ... xiv
Chapter 1 ... 1
1 Introduction ... 1
1.1 Epidemiology ... 1
1.2 Prostate Anatomy ... 2
1.3 Prostate Cancer and Risk Factors ... 4
1.4 Digital Rectal Exam ... 6
1.5 Prostate Specific Antigen (PSA) ... 6
1.6 Effect of Prostate Specific Antigen (PSA) on Clinical Practice ... 7
1.7 Prostate Specific Antigen (PSA) Permutations That Improve Detection of Prostate Cancer ... 8
1.8 Transrectal Ultrasound Guided (TRUS) Biopsy and Gleason Score ... 10
1.9 Gleason Score: Current Gold Standard of Prognosis ... 13
1.10 Staging of Prostate Cancer ... 14
1.11 Controversy Surrounding PSA Based-Screening ... 17
1.12 Biomarkers ... 18
1.13 Microparticles (MPs) ... 20
vi
1.15 Prostate Cancer Surface Markers ... 26
1.16 Prostate Specific Membrane Antigen (PSMA) ... 27
1.17 Six-transmembrane Epithelial Antigen of the Prostate-1 (STEAP1)... 28
1.18 Ghrelin Ligand and its Receptor (GHSR1a) ... 29
1.19 CD151 ... 30
1.20 Hypothesis ... 31
1.21 Research Objectives ... 31
Chapter 2 ... 33
2 Materials and Methods ... 33
2.1 Patient Sample Preparation, Blinding and Ethics ... 33
2.2 Antibody and Reagents ... 33
2.3 Immunolabeling of Prostate Cancer-derived Microparticles ... 34
2.4 Acquisition settings for nanoscale flow cytometry ... 34
2.5 Data analysis and Statistics ... 37
Chapter 3 ... 39
3 Results ... 39
3.1 Study Cohort ... 39
3.2 Optimization of Antibodies used in Detection of Prostate-derived Microparticles ... 41
3.3 Gating of Cytograms ... 44
3.4 Scatterplot data... 54
3.5 Assessment of Performance Characteristics ... 65
Chapter 4 ... 71
4 Discussion ... 71
4.1 General Discussion ... 71
vii
4.3 Measurement of Microparticles ... 73
4.4 Calculated Area Under the Curve (AUC) for Biomarkers... 77
4.5 Limitations ... 79
Chapter 5 ... 81
5 Conclusion ... 81
5.1 Conclusion ... 81
5.2 Future Directions ... 82
Bibliography ... 83
Appendices ... 97
viii
List of Abbreviations
AJCC American Joint Committee on Cancer
AS Active Surveillance
AUC Area Under the Curve
BPH Benign Prostatic Hypertrophy
CD Cluster of Differentiation
CM Confocal Microscopy
CSS Cancer-specific Survival
DRE Digital Rectal Exam
EM Electron Microscopy
EPIC European Prospective Investigation into Cancer and Nutrition
ERSPC European Randomized Trial of Prostate Cancer Screening
EV Extracellular Vesicle
FDA Food and Drug Administration
fPSA Free PSA
GHSR1a Ghrelin receptor or type 1a growth hormone secretagogue receptor
HG PIN High Grade Prostatic Intraepithelial Neoplasia
IGF-1 Insulin-like Growth Factor-1
LAPC-4 Los Angeles Prostate Cancer
LNCaP Lymph Node Carcinoma of the Prostate
MMP Metalloproteinases
MP Microparticles
MRI Magnetic Resonance Imaging
NK Natural Killer Cell
ix
PBS Phosphate Buffered Saline
PC3 Prostate Cancer Cell Line-3
PCA3 Prostate Cancer Antigen-3
PCIe Peripheral Component Interconnect Express
PCMPs Prostate Cancer Microparticles
PLA Proximity Ligation Assay
PLCO Prostate, Lung, Colon, and Ovary Trial
PMP Platelet Microparticles
PPV Positive Predictive Value
PSA Prostate Specific Antigen
PSAD Prostate Specific Antigen Density
PSA DT PSA Doubling Time
PSMA Prostate Specific Membrane Antigen
ROC Receiver Operating Curve
ROI Region of Interest
SELECT The Selenium and Vitamin E Cancer Prevention Trial
STEAP1 Six-transmembrane Epithelial Antigen of the Prostate-1
TCGA The Cancer Genome Atlas
TMA Tissue Microarray
TNM Tumor, Nodes, Metastasis Classification System
TRUS Transrectal Ultrasound Guided
TURP Transurethral Resection of the Prostate
x
List of Tables
Table 1. Prostate cancer stages according to AJCC, 2016 ... 16
Table 2. Clinical and pathological features of the patient cohort. Pathologic stage of six
patients is unknown... 40
Table 3. Distribution of the positive microparticles for each individual biomarker displayed
as events/μL. GS6 (n=15), GS3+4 (n=14), GS4+3 (n=15), and GS≥8 (n=15). ... 56
Table 4. Distribution of microparticles that are dual positive displayed in events/μL. GS6 (n=15), GS3+4 (n=14), GS4+3 (n=15), and GS≥8 (n=15). ... 61
Table 5. Distribution of microparticles that are triple positive displayed in events/μL. GS6 (n=15), GS3+4 (n=14), GS4+3 (n=15), and GS≥8 (n=15). ... 64
Table 6. AUC results for the all combinations of microparticles comparing GS6 to GS3+4. 70
Table 7. AUC results for the all combinations of microparticles comparing GS6 to GS4+3. 70
xi
List of Figures
Figure 1. Anatomy of the zones of the prostate. Image obtained from: Verze, P., Cai, T. &
Lorenzetti, S. (2016). The role of the prostate in male fertility, health and disease. Nature
Reviews Urology. 13, 379–386. ... 3
Figure 2. Portrayal of a routine TRUS biopsy. Image obtained from website:
https://perthurologyclinic.com.au/what-we-do/procedures/337-2/ (Accessed January 2017).11
Figure 3. Apogee, A-50M nanoscale flow cytometer (Apogee FlowSystems Inc., UK). ... 24
Figure 4. Depiction of light scatter detectors and the three fluorescent channels in the Apogee
A-50M nanoscale flow cytometer. Image obtained from website:
https://flowcytometry.med.ualberta.ca (Accessed January 2017). ... 25
Figure 5. An example of histograms portraying PSMA-PE isotype (A) and PSMA-PE
antibody (B). The x-axis represents sizing as long angle light scatter (LALS) and y-axis
represents degree of fluorescence represented by a log scale. Each dot represents one positive
event within the gate (displayed in red). ... 36
Figure 6. Example of a triple positive histogram (A, MPs that are positive for PSMA,
STEAP1 and GHSR1a). MPs within blue rectangle gate are recorded and represented as
events/μL. The x-axis represents sizing as long angle light scatter (LALS) and y-axis
represents degree of fluorescence represented by a log scale. This gate was created by
superimposing dual positive MPs (B, PSMA+STEAP1) with single positive MP gate (C,
GHSR1a). Each dot represents one positive event within the gate (displayed in red). ... 38
Figure 7. Titration curve for each antibody and their respective isotype using metastatic
prostate cancer patient plasma. For Prostate Specific Membrane Antigen clone 3E/7
conjugated with PE (PSMA 3E/7), 0.75 μg was selected as optimal mass for study (A). For
Six Transmembrane Antigen of Prostate-1 conjugated with Alexa Fluor 647 (STEAP1), 0.40
xii
or antibody used in micrograms and y-axis indicates percentage of positive events within the
region of interest (i.e. within the gate) ... 43
Figure 8. Cytograms displaying single positive microparticles within their respected gates:
isotype-matched controls (A) and antibodies (B) for STEAP1-Alexa647, isotype-matched
controls (C) and antibodies (D) for PSMA-PE, isotype-matched controls (E) and antibodies
(F) for GHSR1a-FITC, and isotype-matched controls (G) and antibodies (H) CD151-FITC.
The x-axis represents sizing as long angle light scatter (LALS) and y-axis represents degree
of fluorescence represented by a log scale. Each dot represents one positive event within the
gate (displayed in red). ... 47
Figure 9. Cytograms displaying dual positive microparticles with their respected gates:
matched controls (A) and antibodies (B) for PSMA-PE+STEAP1-Alexa647,
isotype-matched controls (C) and antibodies (D) for PSMA-PE+GHSR1a-FITC, isotype-isotype-matched
controls (E) and antibodies (F) for STEAP1-Alexa647+GHSR1a-FITC, isotype-matched
controls (G) and antibodies (H) for PSMA-PE+CD151-FITC, and isotype-matched controls
(I) and antibodies (J) for STEAP1-Alexa647+CD151-FITC. The x-axis represents sizing as
long angle light scatter (LALS) and y-axis represents degree of fluorescence represented by a
log scale. Each dot represents one positive event within the gate (displayed in red). ... 51
Figure 10. Cytograms displaying triple positive microparticles with their respected gates:
isotype-matched controls (A) and antibodies (B) for
PE+STEAP1-Alexa647+GHSR1a-FITC and isotype-matched controls (C) and antibodies (D) for
PSMA-PE+STEAP1-Alexa647+CD151-FITC. The x-axis represents sizing as long angle light
scatter (LALS) and y-axis represents degree of fluorescence represented by a log scale. Each
dot represents one positive event within the gate (displayed in red). ... 53
Figure 11. Scatterplots showing levels of PSMA (A), STEAP1 (B), GHSR1a (C), and CD151
(D) expressing MPs in patient plasmas for GS6 (n=15), GS3+4 (n=14), GS4+3 (n=15), and
GS≥8 (n=15). Bars represent the mean in events/μL and +/- s.e.m. (* p <0.05, ** p<0.01 in
one-way ANOVA test). ... 55
Figure 12. Scatterplots showing levels of PSMA+STEAP1 (A), PSMA+GHSR1a (B),
xiii
microparticles (MP) in patient plasmas for GS6 (n=15), GS3+4 (n=14), GS4+3 (n=15), and
GS≥8 (n=15). Bars represent the mean in events/μL and +/- s.e.m. (* p <0.05, ** p<0.01, ***
p<0.001 in one-way ANOVA test). ... 59
Figure 13. Scatterplots showing levels of PSMA+STEAP1+GHSR1a (A) and
PSMA+STEAP1+CD151 (B) triple-expressing MP in patient plasmas for GS6 (n=15), GS
3+4 (n=14), GS4+3 (n=15), and GS≥8 (n=15). Bars represent the mean in events/μL and +/-
s.e.m. (* p <0.05, ** p<0.01, *** p<0.001 in one-way ANOVA test). ... 63
Figure 14. ROC curves comparing GS6 to GS3+4 for various combinations of microparticles.
... 66
Figure 15. ROC curves comparing GS6 to GS4+3 for various combinations of microparticles.
... 67
Figure 16. ROC curve comparing GS6 to GS≥8 for various combinations of microparticles.
xiv
List of Appendices
Chapter 1
1
Introduction
1.1
Epidemiology
Prostate cancer continues to be the most common non-cutaneous neoplasm affecting
North American men (Howlander et al., 2017). In 2016, it is estimated that 21% percent
of all new diagnosed cancers in males will be from the prostate, making it the number
one diagnosed neoplasm in Canadian men (Canadian Cancer Society, 2017). It will
account for approximately 10% of all cancer deaths in Canadian males, ranking third,
after lung cancer and colorectal cancer (Canadian Cancer Society, 2017). Men over the
age of 60 have the greatest risk of developing prostate cancer. The incidence rate in
Canada peaked in 1993 and 2001, with a decline in the following years. These peaks
were believed to be attributed to intensified screening with the use of PSA (Canadian
Cancer Society, 2017). Since 2001, incidence rates have been declining roughly at 1.5%
rate per year and mortality rates have been declining at a rate of 3.3% per year. This
decline in mortality is likely attributed to improvements of treatment in radiation and use
of hormonal therapy especially in the setting of metastatic castrate resistant prostate
cancer (Cooperberg et al., 2003; Kupelian et al., 2003; Joelle et al., 2013).
In the United States, it is estimated that in 2016, 180,890 men will be diagnosed with
prostate cancer and 26,120 will die from the disease (Howlander et al., 2017). Similar to
Canada, 1 in 8 American men will develop prostate cancer in their lifetime. (Howlander
et al., 2017). The median age of diagnosis and death in 2016 are 66 and 80, respectively.
In 2012, estimated global incidence makes prostate cancer the second most common
cancer in men with over a million cases resulting in 307,000 deaths. Prostate cancer
incidence varies more than 25-fold worldwide (Globocan, 2012). High-income countries
who adopted PSA screening had the largest decline in mortality, such as, United States
(-3.5%), Canada (3.1%), England (-2.6%), and Australia (-1.7%) (Canadian Cancer
Sub-Sahara Africa (Globocan, 2012).
1.2
Prostate Anatomy
The prostate is part of the male reproductive system that works in tandem with the
seminal vesicles to produce and store seminal fluid that nurtures, protects, and facilitates
sperm transport for reproduction (Aumüller, 1979). Embryologically, the prostate is
distinct from the seminal vesicles as it arises from the urogenital sinus under the
hormonal influences of dihydrotestosterone, while the seminal vesicles develop from the
Wolffian ducts through testosterone stimulation. It is comprised of 70% glandular tissue
and 30% fibromuscular stroma. (Aumüller, 1979; Wein et al., 2016).
The prostate gland is divided into 4 zones: peripheral, central, transition and anterior
fibromuscular stroma zone (Figure 1). The peripheral zone is a sub-capsular region of
small round acini lined by simple columnar epithelium with clear cytoplasm and basal
nuclei (McNeal, 1969). Approximately, 70% of prostate cancers are contained in this
zone (Prostate Cancer Information, 2010). The central zone arises close to the ejaculatory
duct orifices and follows these ducts proximally, branching laterally near the prostate
base. Its lateral border fuses with the proximal peripheral zone border (McNeal, 1981).
Central zone accounts for 2.5% of prostate cancers (Cohen et al., 2008). The transition
zone surrounds the proximal urethra and is the site for benign prostatic hyperplasia
(McNeal, 1981). It also accounts for 10-20% of prostate cancers (Prostate Cancer
Information, 2010). The anterior fibromuscular stroma forms the entire anterior surface
of the prostate which is thick, nonglandular and typically not involved with prostate
1.3
Prostate Cancer and Risk Factors
The most common form of prostate cancer is adenocarcinoma which arises from the
prostate’s abundant secretary epithelial cells (Miller et al., 2003). In the post-PSA era,
average age for diagnosis and death is 65 and 77 years of age respectively. Prostate
cancer in its early stages often does not produce symptoms. However, advanced cases of
prostate cancer may give rise to: hematuria, urinary obstruction, sexual dysfunction
impacting erectile function, local invasion of surrounding structures, bony pain and spinal
compression (Miller et al., 2003). These advanced stages of disease are more commonly
seen in men with high preoperative PSA and high histological grade cancers (Miller et
al., 2003). Localized extra-capsular extension is most common in the posterolateral
prostate near the neurovascular bundle but can also involve the urethra, bladder and
rectum in advanced cases (Prostate cancer statistics, 2017). Common metastatic sites
include pelvic lymph nodes and bone while lung, liver, and brain are rare metastatic sites
(Prostate cancer statistics, 2017). Prostate cancer is incidentally reported in up to 10% of
men undergoing transurethral resection of the prostate (TURP) (Otto et al., 2014) and in
14-50% in men undergoing cystoprostatectomy for bladder cancer (Kaelberer et al.,
2016). Complete prostate gland analysis from cystoprostatectomy specimens have shown
the presence of clinically significant prostate cancer (Filter et al., 2017).
Risk factors strongly associated with prostate cancer include family history, genetic
variability, ethnicity and age. Epidemiology studies have shown that relative risk of
developing prostate cancer increases with number of affected family members, their
degree of relatedness, and the age at which they were diagnosed. A meta-analysis by
Zeegers et al., 2003, reported a relative risk (RR) of 2.17 if the father was affected, RR
3.37 if brother was affected, RR 3.34 if first degree relative was <65 years old at time of
diagnosis, and RR 5.08 if >2 first-degree relatives were affected. Over 100 alleles have
been identified that may increase one’s risk of prostate cancer (Amin et al., 2015). Tumor
suppressor genes, BRCA 1 and BRCA 2, have been linked to early on-set of prostate
cancer with evidence suggesting more aggressive prostate cancer in those with BRCA2
mutation (Amin et al., 2015; Siegel et al., 2016). Patients with hereditary prostate cancer
Association of Urology, 2016).
Ethnicity also impacts both incidence and mortality of prostate cancer. African
Americans and Jamaicans of African descent have the greatest risk. African Americans
are estimated to have mortality rates that are 2.4 times higher when compared to
Caucasians (Siegel et al., 2016). Hispanics are considered at intermediate risk as they
have similar incidence and mortality from prostate cancer as their Caucasian
counterparts. Finally, Asians are considered low risk as they have the lowest incidence
and mortality rates (Siegel et al., 2016; Globocan, 2012).
Age appears to be the most significant risk factor for developing prostate cancer. It is
estimated that men aged 45 to 54 years will comprise of <10% of the newly diagnosed
cases in 2016. On the other hand, men aged 55 to 64 years and men aged 65-74 years will
comprise of 32.9% and 37.6% of all newly diagnosed cases, respectively (Siegel et al.,
2016). The incidence of prostate cancer declines in men over 75 years of age which is
linked to decreased screening in this population, however, mortality rates continue to rise
with advancing age (Siegel et al., 2016).
Other risk factors that have been explored but have shown limited or conflicting data
include diet and environmental factors. The western diet is believed to be linked to an increased risk of prostate cancer. There is evidence suggesting high intake of red meat such as beef or pork, especially when it is cooked at a high temperature, may increase the
risk of developing prostate cancer (John et al., 2011). European Prospective Investigation
settle in the United States, but further prospective studies failed to show a dietary link (Muir et al., 1991; Wu et al., 2006). Nonetheless, diet may be a risk factor in developing prostate cancer but significant limitations impact our understanding due to the nutritional
variability of the western diet as well as patient genetic variability.
1.4
Digital Rectal Exam
In order to screen and diagnose prostate cancer, Urologists rely on history, physical
exam, PSA blood tests and tissue biopsies. As mentioned previously, family history is a
vital component of the history taking process. An individual’s risk significantly increases
with greater number of first-degree family members diagnosed, especially if at a younger
age. Physical exam incorporates the digital rectal exam (DRE) to help detect palpable
tumors in the prostate’s peripheral zone. The prostate lies about 4 cm from the anus
(Wein et al., 2016). DRE notes the size of the prostate, tender areas, irregularities within
the anal canal and any firm prostatic nodules. The examination is simple to complete.
Therefore, DRE is routinely performed regardless of PSA level. The positive predictive
value (PPV) of the DRE increases when used with prostate specific antigen (PSA)
(Schröder et al., 1998). PPV of a suspicious DRE for PSA ranges between 0 to 1.0 ng/mL
have been quoted at 5%, PSA 1.1 to 2.5 ng/mL PPV is 14%, PSA 2.6 to 4.0 ng/mL PPV
is 30%, and PSA level is 3.0 to 9.9 ng/mL the PPV is 33-83% (Schröder et al., 1998;
Carvalhal et al., 1999). Abnormal DRE is associated with an increased risk of higher Gleason score and is an indication for prostate biopsy.
1.5
Prostate Specific Antigen (PSA)
Prostatic specific antigen (PSA) was first identified in the 1979 and introduced for
clinical use a decade later (Rao et al., 2008). PSA is part of the kallikrein gene family,
also referred as the human kallikrein peptidase 3 (hK3) (Wein et al., 2016). It is secreted
primarily by the luminal epithelial cells within the prostate (Warade, 2014). This
protease’s function is to liquefy semen after ejaculation, aiding in freeing up sperm for
insemination.
tumor marker, however, it is not cancer specific as numerous causes can alter PSA serum
levels. PSA increases with factors such as age, introduction of androgens after puberty,
post-ejaculation, African ethnicity, urinary retention and urinary tract infection (Warade,
2014; Klein and Lowe, 1997). It also increases in prostate diseases such as benign
prostatic hyperplasia, prostatitis or prostate cancer and from transurethral prostatic
surgeries or prostatic biopsy (Warade, 2014; Klein and Lowe, 1997). PSA levels drop
with increasing BMI, men suffering from hypogonadism, use of 5-alpha reductase
inhibitors, post radical prostatectomy, post radiation therapy and hormonal medications
for prostate cancer (Warade, 2014; Baillargeon et al., 2005). PSA is highly concentrated
in semen and not present in the blood in healthy individuals. However, when prostate
specific diseases are present such as prostate cancer, it disrupts the prostate gland
architecture leading to greater release of PSA in the blood (Warade, 2014).
Unfortunately, PSA varies on a day to day basis. Therefore, serial tests are required in
order to interpret the results (Roehrborn et al., 1996). There is no agreed upon PSA threshold level that would trigger prostate biopsy for prostate cancer (Semjonow et al., 1996). PSA is a continuous parameter, with higher levels indicating a greater likelihood
of prostate cancer and advanced disease. Men may also harbour cancer despite having low serum PSA (Thompson et al., 2004). Traditionally, a PSA level of 4.0 ng/mL was defined as the upper limit of normal (Catalona et al., 1994). However, in a subgroup analysis of the Prostate Cancer Prevention Trial (PCPT), 2950 men who had PSA levels <4.0ng/mL and benign DRE underwent an end of study prostate biopsy. PCPT showed that 449 of these men (15.2%) had prostate cancer of which 67 (14.9%) had Gleason score (GS) 7 or greater (Thompson et al., 2004). This unexpected finding of higher risk disease unfortunately indicates that there is no safe cut off for PSA.
1.6
Effect of Prostate Specific Antigen (PSA) on Clinical
Practice
Since the introduction of PSA testing, prostate cancer mortality has decreased nearly 45%
along with a 75% reduction in the proportion of advanced-stage disease at diagnosis
and rates of metastases have declined from 20 to 40% in 1980s to less than 4% today
(National Cancer Institute, 2015; Newcomer et al., 1997). Therefore, evidence does
reveal that PSA serves an important marker in decreasing the mortality rates of prostate
cancer patients. However, widespread use of PSA screening and the long natural history
of prostate cancer has led to a stage migration to clinically localized disease (T1c)
(O'Donnell and Parker, 2008). In a study conducted by Cooperberg et al, 2004, 8,000
patients diagnosed with prostate cancer between 1989-2001 were examined. The findings
concluded that the proportion of cases with low-risk disease increased from 28% between
1989–1992 to 45.3% between 1999–2001. The proportion of T1c tumors (diagnosis made
from tissue biopsy for elevated PSA) increased from 15.2% to 61.7%, while the
proportion of T1a and T1b tumors fell (diagnosis made from TURP surgery).
Additionally, PSA can also be used to monitor prostate cancer treatment response (Klein
and Lowe, 1997). It is generally understood the fall of PSA post treatment to near zero
levels is prognostic for good overall survival outcomes. This is especially the case in
patients who have prostatic glands but receive radiation therapy or are on androgen
deprivation therapy.
1.7
Prostate Specific Antigen (PSA) Permutations That Improve
Detection of Prostate Cancer
Various manipulations of PSA have been explored to improve its use as a screening tool
in clinical practice. One thought was to increase the PSA threshold in order to improve
the specificity of clinically significant cancers. Increasing the PSA threshold increases the
PPV of detecting cancer but also increases the likelihood that these cancers will be
diagnosed in more advanced stages while missing those with clinically relevant cancer.
PSA lacks specificity at low PSA levels (Brawer, 1999). In order to improve the PPV of
the PSA test, many dynamic PSA tests have been studied. One such test is PSA velocity.
Carter et al, 1992, noted that if a man’s PSA rose at a rate greater than 0.75 ng/ml per
year, he was at increased risk of being diagnosed with prostate cancer (Carter et al. 1992).
Another dynamic test is PSA doubling time (PSA DT). Klotz et al, 2015, found that a
therapy when compared to those on active surveillance who had a PSA DT >3 years. This
supported PSA DT of <3 years is a good indicator for aggressive disease (Klotz et al.,
2015).
PSA density (PSAD) has been tested in hopes of improving PPV of PSA. PSAD is
calculated by dividing the PSA level with prostate volume. Each gram of prostate tissue
contributes to the PSA but cancer is believed to cause a higher PSA level and therefore
higher PSAD. Although there is conflicting data on the utility of PSAD (Brawer et al.,
1993), a PSAD >0.15 in men with PSA 4-10ng/mL has been recommended to undergo a
biopsy to assess for cancer (Bazinet et al., 1994). PSAD has been shown to have utility in
men with low risk prostate cancer on active surveillance (Bul et al., 2013).
Age-specific PSA levels have also been examined. Since PSA levels increase with age,
having a single PSA cut off value is not in the best interest of the patient. According to
Oesterling et al, a man <50 years of age should have a PSA <2.5 ng/ml. This is in
contrast to a man in his seventies who is capable of having a normal PSA between 0 and
6.5 ng/ml. They stated that:
“these age-specific reference ranges have the potential to make serum PSA a
more discriminating tumor marker for detecting clinically significant cancers in
older men (increasing specificity) and to find more potentially curable cancers in
younger men (increasing sensitivity) (Oesterling et al., 1993).”
Thus, physicians should place PSA levels in context according to the patient’s age.
Furthermore, in systemic circulation, PSA is present in both free form (fPSA) or
complexed states with protease inhibitors (Brawer, 1999). Alpha-1 antichymotrypsin and
2 macroglobulin are the most prevalent complexes present in serum. Unlike
alpha-2 macroglobulin complex, PSA that is complexed with alpha-1 antichymotrypsin has two
epitopes that can be detected with immunoassays. As a result, men with PSA levels
between 4-10 ng/mL who have a free to total (fPSA/PSA x 100%) percentage of <20%
Thus, PSA has revolutionized the management of prostate cancer in both early detection
and following patient’s post-treatment. Using the cut off value of 4 ng/mL, the sensitivity
and specificity for detecting any prostate cancer is 21% and 91% respectively (Aubry et
al., 2013). The sensitivity of detecting high risk disease (Gleason score >8) is 51%.
Unfortunately, PSA is not without its flaws and as of now there is no perfect model when
it comes to screening men for prostate cancer. The controversies of PSA based screening
will be explored in chapter 1.11.
1.8
Transrectal Ultrasound Guided (TRUS) Biopsy
and Gleason
Score
In order to identify and formally make the diagnosis for prostate cancer, a transrectal
ultrasound guided (TRUS) tissue biopsy is required. The procedure requires an
ultrasound probe to be inserted into the rectum and multiple core biopsies are taken using
a needle biopsy gun. It is common practice to acquire 12 core biopsies in a systematic
fashion which are then microscopically examined by a pathologist. A Gleason score (GS)
which reflects tumor cell differentiation is assigned if cancer is detected (Gleason, 1966).
An overall increase in cancer detection rates was seen when 10 to 12 core biopsy
protocols were used instead of the standard sextant biopsy protocol (Bjurlin et al., 2013).
Saturation biopsies, which consist of 20 cores or more, can also be considered in patients
who are undergoing a repeat biopsy after an initial biopsy was negative (Walz et al.,
2006). It is currently estimated that 1.3 million prostate biopsies are performed annually
in the United States (Aubry et al., 2013). Portrayal of a routine TRUS biopsy is seen in
Figure 2. Portrayal of a routine TRUS biopsy. Image obtained from website:
TRUS biopsy is an invasive procedure and 30% of clinically significant prostate cancer
cases continue to be missed (Bouye et al., 2009). Moreover, patient’s will incur side
effects such as post procedure pain, acute urinary retention, hematuria, hematospermia,
blood per rectum, transient fever, epididymitis, prostatitis, and a 4% risk of life
threatening sepsis (Hara et al. 2008; Nam et al., 2010). To minimize the risk of infection,
it is highly recommended that patients begin antibiotic prophylaxis 24 hours prior to
biopsy and continue for a total of 3 days (Wolf et al., 2012). Other modalities using MRI
and advancements in ultrasound are currently being investigated in order to improve
TRUS biopsy results (Stoianovici, 2012).
The Gleason score (GS) is a numerical grading system that was first developed by Dr.
Donald Gleason in the 1960s (Gleason and Mellinger, 1974). Traditionally, a Gleason
grade from a scale of 1 to 5 is assigned to each tissue core. Gleason grade of 1 represents
well differentiated tissue while a Gleason grade of 5 is the least differentiated and often
the most invasive. (Gleason, 1966). Biopsy cores are assigned to the two most common
GS patterns giving an accumulated score of 2 to 10. In 2005, the International Society of
Urological Pathology updated the original Gleason grading system to incorporate the new
changes to prostate cancer management with the advent of screening (Epstein et al.,
2005). Gleason grade scale now is graded from 3 to 5. Therefore, new scores now range
from 6 through 10 with 6 being classified as low risk cancer (also known as GS 3+3), GS
3+4=7 and GS 4+3=7 as intermediate risk cancer, and GS 8 to 10 (GS 4+4, 3+5, 5+3,
4+5, 5+4, 5+5) as high-risk cancer (Ghani et al., 2005). Higher GS is associated with
poor prognosis due to the propensity of the cancer to grow and metastasize (Canadian
Cancer Society, 2016). Other biopsy findings such as number of cores involved,
percentage of cores involved and potentially perineural invasion can provide prognostic
information (Bismar et al., 2003). Therefore, at this point in time, tissue is required to risk
stratify newly diagnosed cancer patients or those who have been previously diagnosed
1.9
Gleason Score: Current Gold Standard of Prognosis
Histological grade of prostatic carcinoma is a dominant predictor of clinical outcome.
Alberston et al, 1998 published a retrospective study designed to estimate long-term
survival based on age and GS at time of diagnosis in men with a life expectancy greater
than 10 years who did not receive treatment (i.e. surgery, external beam radiation, or
brachytherapy). 767 men aged 55 to 74 with clinically localized prostate cancer were
selected for the study (Alberston et al., 1998). Results showed that men with progressing
GS (6 versus 7 versus 8-10) had increasing rates of prostate cancer related death within
15 years of diagnosis independent of age at diagnosis. GS 8 to 10 was significantly
associated with poor prognosis with 60% to 87% of patients dying of prostate cancer.
Recent evidence has now revealed that GS6 (low risk) prostate cancer may no longer
need to be aggressively treated. In a large prospective cohort on patients with low and
intermediate risk disease while on active surveillance, outcomes for low-risk patients
were excellent: a metastasis-free survival rate of 97.2% and a 15-year cancer-specific
survival (CSS) rate of 94.3%. Only 28 men developed metastatic disease except two
patients who had GS 7 on biopsy (these two patients lacked surgical grading). Of note,
cancer specific survival did not differ between those younger or older than 70 years of
age. Furthermore, 25% of the patients in this study satisfied the D’Amico criteria for
intermediate risk (Klotz et al., 2015). With a high CSS rate, this study showed active
surveillance can be a viable option in those patients who have favorable intermediate risk
disease (GS 7).
Many older studies have grouped GS 7 as a single score without distinguishing 3+4
versus 4+3. However, there is significant evidence indicating prognostic differences
between these two scores. GS 4+3 at time of radical prostatectomy was associated with
increased risk of progression to metastasis independent of stage or margin status (Chan et
al., 2000). Sunnybrook Hospital in Toronto recently published an active surveillance
study comparing GS 6 to GS 7. They did a sub-group analysis comparing GS 3+4 to GS
6 and GS 4+3 to GS 6. Despite close monitoring and intervention for evidence of risk
progression, the hazard ratio for 15-year prostate cancer metastasis rate was 3.14 in the
3+4 versus GS 6 was 4.0 and Gleason 4+3 versus GS 6 was 10.5 (Musunuru et al., 2016;
Yamamoto et al., 2016). Overall, evidence supports that as GS progresses so does
adverse clinical outcomes. Tissue pathology is needed for diagnosis and prognosis of
prostate cancer, with any newly developed non-invasive biomarker to work in
conjunction with the Gleason Score.
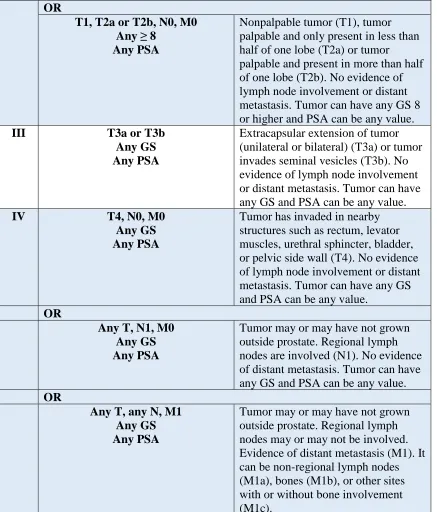
1.10
Staging of Prostate Cancer
After the diagnosis of prostate cancer is made using TRUS biopsy, it must be
appropriately staged. The most common system currently used is the Tumor, Nodes,
Metastasis (TNM) classification system by the American Joint Committee on Cancer
(AJCC) (American Cancer Society, 2016). It looks at the extent of the tumor (T),
whether or not there is lymph node involvement (N), and if there is evidence of
metastatic disease (M). The new staging system also incorporates PSA at time of
diagnosis as well as the Gleason score (American Cancer Society, 2016). Staging ranges
from I to IV with stage I having the best prognosis and stage IV having the worst
prognosis (Table 1). In order to complete the routine staging work up, urologists obtain computerized tomography (CT) scans or magnetic resonance imaging (MRI) of the
abdomen and pelvis to assess for lymph node metastasis and bone scans to assess for
bony metastasis (Hovels et al., 2008; Langsteger et al., 2012). Definitive treatment with
surgery or radiation with the intent to cure is only possible when there is no evidence of
Stage Stage Grouping Stage Description
I T1, N0, M0
GS 6 PSA <10
Nonpalpable tumor. No evidence of lymph node involvement (N0) or distant metastasis (M0). GS is 6 and PSA is less than 10.
OR
T2a, N0, M0 GS 6 PSA <10
Tumor palpable and only present in less than half of one lobe. No
evidence of lymph node involvement or distant metastasis. GS is 6 and PSA is less than 10.
IIA T1, N0, M0
GS 7 PSA <20
Nonpalpable tumor. No evidence of lymph node involvement or distant metastasis. GS is 7 and PSA is less than 20
OR
T1, N0, M0 GS 6 PSA 10-20
Nonpalpable tumor. No evidence of lymph node involvement or distant metastasis. GS of 6. PSA between 10 and 20.
OR
T2a or T2b, N0, M0 GS ≤7
PSA <20
Tumor palpable and only present in less than half of one lobe (T2a) or tumor palpable and present in more than half of one lobe (T2b). No evidence of lymph node involvement or distant metastasis. GS can be 6 or 7 and PSA is less than 20.
IIB T2c, N0, M0
Any GS Any PSA
Tumor palpable and present in up to both lobes (T2c). No evidence of lymph node involvement or distant metastasis. Tumor can have any GS and PSA can be any value.
T1, T2a or T2b, N0, M0 Any GS
Any >20
Nonpalpable tumor (T1), tumor palpable and only present in less than half of one lobe (T2a) or tumor
OR
T1, T2a or T2b, N0, M0 Any ≥ 8
Any PSA
Nonpalpable tumor (T1), tumor palpable and only present in less than half of one lobe (T2a) or tumor
palpable and present in more than half of one lobe (T2b). No evidence of lymph node involvement or distant metastasis. Tumor can have any GS 8 or higher and PSA can be any value.
III T3a or T3b
Any GS Any PSA
Extracapsular extension of tumor (unilateral or bilateral) (T3a) or tumor invades seminal vesicles (T3b). No evidence of lymph node involvement or distant metastasis. Tumor can have any GS and PSA can be any value.
IV T4, N0, M0
Any GS Any PSA
Tumor has invaded in nearby structures such as rectum, levator muscles, urethral sphincter, bladder, or pelvic side wall (T4). No evidence of lymph node involvement or distant metastasis. Tumor can have any GS and PSA can be any value.
OR
Any T, N1, M0 Any GS Any PSA
Tumor may or may have not grown outside prostate. Regional lymph nodes are involved (N1). No evidence of distant metastasis. Tumor can have any GS and PSA can be any value. OR
Any T, any N, M1 Any GS Any PSA
Tumor may or may have not grown outside prostate. Regional lymph nodes may or may not be involved. Evidence of distant metastasis (M1). It can be non-regional lymph nodes (M1a), bones (M1b), or other sites with or without bone involvement (M1c).
1.11
Controversy Surrounding PSA Based-Screening
As mentioned earlier, PSA is an organ specific marker that is highly sensitive and
specific in the post-treatment setting. However, it lacks sensitivity and specificity in the
screening of prostate cancer. The American Cancer Society systematically reviewed the
literature regarding PSA’s performance test characteristics. They estimated sensitivity
and specificity of a PSA cut-off of 4.0 ng/mL for detecting any prostate cancer was 21%
and 91%, respectively (Wolf et al., 2010). In 2012, the U.S. Preventive Services Task
Force (USPSTF) published a recommendation against the routine use of PSA screening at
any age (U.S. Preventive Services Task Force, 2012). This recommendation was dialed
back in 2017, stating that clinicians should only offer PSA screening after patients have
been informed about its risks and benefits. They still recommended against PSA-based
screening in men 70 years or older. (U.S. Preventive Services Task Force, 2017). In 2014,
the Canadian Task Force on Preventive Health Care also published guidelines no longer
recommending PSA-based screening for prostate cancer (Canadian Task Force on
Preventive Health Care, 2014). These recommendations were mainly based on two large
prospective studies looking at the role of PSA as a screening tool. The studies were the
European Randomized Trial of Prostate Cancer Screening (ERSPC) and the Prostate,
Lung, Colon, and Ovary (PLCO) Trial (de Koning et al., 2002; Auvinen et al., 1996). The
ERSPC trial is a collection of trials in different countries with different eligibility criteria,
randomization schemes, and strategies for screening and follow-up (Barry, 2009). In the
ERSPC trial, Schröder et al. reported that PSA screening without digital rectal
examination was associated with a 20% relative reduction in prostate cancer death at a
median follow-up of 9 years, with an absolute reduction of about 7 prostate cancer deaths
per 10,000 men screened. It is estimated that in order to prevent one prostate cancer
death, 781 men have to be screened and 27 additional cases of prostate cancer would
need to be treated (Schroder et al., 2014; Barry, 2009). Thus, the ERSPC provided the
rationale that PSA screening without the use of DRE was not an effective means of
reducing cancer related mortality and unnecessarily placed patients at risk of
overtreatment.
cancer in the screening arm were 12% higher than control arms (RR = 1.12, 95% CI =
1.07 to 1.17) (Andriole et al., 2012). However, the study concluded that there was no
difference in prostate cancer mortality between the screened and control arms at a median
follow-up of 13 years. The cumulative mortality rates from prostate cancer in the
intervention and control arms were 3.7 and 3.4 deaths per 10,000 person-years,
respectively, resulting in a non-statistically significant difference between the two arms
(RR = 1.09, 95% CI = 0.87 to 1.36). However, it should be noted that the PLCO study
has been criticized for high rates of contamination with more than half the participants in
the control arm undergoing PSA testing by year five (Barry, 2009). Overall, these trials
describe the potential for over-diagnosis and overtreatment of prostate cancer with
PSA-based screening, underscoring the concept that PSA is not an ideal screening marker.
1.12
Biomarkers
It is well known that PSA screening and tissue biopsy are prone to underestimating
cancer burden. Therefore, in order to meet the challenge of improving prognostication,
prostate cancer biomarkers are constantly being developed and studied since the advent
of PSA. In addition, a biomarker that could accurately risk stratify prostate cancer may
have a role in patients on active surveillance. Ideally, a biomarker that is more sensitive
and specific than PSA would improve current methods of risk stratification of prostate
cancer, thus, reducing the number of TRUS biopsies and side effects within this patient
population. Biomarkers could have a role in monitoring disease response after treatment.
The first clinical biomarker for prostate cancer was prostatic acid phosphatase (PAP)
described in 1940s (Taira et al., 2007). It went on to be replaced by PSA which
performed significantly better and allows clinicians to monitor treatment response.
Currently, there are a number of serum and urine base biomarkers being studied. In
addition to PSA, there are two FDA approved biomarkers available in clinical practice.
In 2012, the United States Federal Drug Administration (FDA) approved a test called the
Prostatic Health Index (PHI). PHI includes three biomarkers: [-2]proPSA, fPSA and
PSA. These biomarkers are combined into an equation, ([-2]proPSA/fPSA)xPSA1/2, that
Section 5. [-2]proPSA is a truncated PSA isoform that differentiate prostate cancer from
benign prostates. Two prospective studies showed that [-2]proPSA can more accurately
diagnose prostate cancer from benign tissue when compared to PSA and fPSA within
PSA ranges of 2.5-10ng/ml (Lazzeri et al., 2013; Le et al., 2010). Some evidence
suggests potential utility of [-2]proPSA and PHI in active surveillance. In a cohort of 167
men on active surveillance, [-2]proPSA and PHI provided greater predictive accuracy for
biopsy reclassification during follow-up than PSA and fPSA alone (Tosoian et al., 2012).
Another FDA approved biomarker available in screening for prostate cancer is known as
Prostate Cancer Antigen 3 (PCA3). This biomarker is unique as it is a urine based test. It
was first isolated in 1999 by Bussemakers and colleagues using differential display and
Northern blot analysis to compare normal and prostate cancer tissue in the same patients
(Bussemakers et al., 1999). They identified it as a noncoding RNA located on
chromosome 9q21-22 that is a very sensitive and specific prostate cancer biomarker.
Although its function is not known, it has been shown to be expressed very highly in
cancer tissue in comparison to benign tissue with an area under the curve (AUC) of the
receiver operating characteristic (ROC) curve of 0.88 (95% CI 0.78-0.97) (de Kok et al.,
2002). Currently there is a standardized transcription mediated RNA amplification assay
for urine samples that can reliably measure PCA3 mRNA levels in voided samples with
an AUC ~0.70 (Groskopf et al., 2006, Sokoll et al., 2008). In 2012, the FDA approved
the use of a commercial assay, Progensa PCA3 Test (Hologic), to aid clinicians in
decision making for men who have elevated PSAs and initial negative TRUS biopsy result. The assay involves performing a reverse transcription polymerase chain reaction on urine samples collected post-DRE. The mRNA of PCA3 and PSA is measured and a ratio (mRNA PCA3/ mRNA PSA) determines the PCA3 score (Wein et al., 2016). Currently there is no standardized cutoff value, however, a threshold of 25 was used in the FDA approval studies. A comparative effectiveness review by Bradley and colleagues showed that a threshold of 25 results in a sensitivity of 74% and specificity of 57% (false-positive rate of 43%) (Bradley et al., 2013).
It should be noted that are a number of non-FDA approved biomarker tests that are
Mi-Prostate score test, Oncotype DX test, ProMark test, ConfirmMDx test, Prolaris test,
Prostate Core Mitomic test, 4K score test, Prostarix test and Decipher test. There are
biomarkers that are early in their development which include: circulating tumor cells,
microRNA and exosomal biomarkers (Saini et al., 2016). This thesis will address
developing a “liquid biopsy” from patient plasma that enumerates putative prostate
cancer biomarkers on the surface of circulating tumor cell fragments that are known as
“prostate cancer microparticles” (PCMPs).
1.13
Microparticles (MPs)
Patients with prostate cancer have shown to have higher levels of microparticles
compared with control patients (Tavoosidana et al., 2011) MPs are able to affect
neighboring cells in various ways, such as inducing intracellular signaling or by
transferring different molecules such as proteins, mRNAs, or microRNAs to cells. They
have been suggested to contribute to cancer cell survival, invasiveness, and metastases
(Al-Nedawi et al., 2009). MPs may provide a novel method to risk stratify prostate
cancer, monitor cancer progression and follow treatment response after surgery, radiation
or hormonal therapy.
Extracellular vesicle (EV) is an umbrella term used to describe exosomes, microparticles
(MP) and apoptotic bodies. They are distinguished by their size, biogenesis and
mechanism of release. Exosomes range 20-100 nm in size and are released from the cells
through inward budding of endosomal membranes to form large multivescular bodies.
The multivesicular bodies then fuse with the plasma membrane of the cell releasing
multiple exosomes from the multivesicular body. Exosomes often contain endocytic
markers, such as tetraspanins and heat shock protein 73 (HSP73) (Mathivanan and
Simpson, 2010; Chaput et al., 2004).
Microparticles range between 100 nm to 1000 nm and are often released concomitantly
making differentiation of microparticles and exosomes difficult (Heijnen et al., 1999).
The majority of microparticles express phosphatidylserine (PS) on their surface whereas
PS is usually absent on the surface of exosomes (Thery et al., 2002). Other names for
prostasomes (Ronquist et al., 2012).
Apoptotic bodies measure 1000-5000 nm (Huang-Doran et al., 2017) and are generated
during the programmed cell death mechanism known as apoptosis. These apoptotic
bodies are then phagocytosed by neighbouring cells and degraded by phagolysosomes.
Microparticles and apoptotic bodies are released via direct outward budding from the
surface of cells. Contents within EV range from membrane-bound proteins, lipids,
metabolites, DNA, and RNAs (mRNA, miRNA, and other small regulatory RNAs)
protected in a lipid bilayer (Huang-Doran et al., 2017). Since EV are products of cells,
their cargo is often remnants of parent cells. Major sources of EVs in the blood are from
platelets, leukocytes and endothelial cells (Yuana et al., 2013). In this thesis, the focus
will be on microparticles and their role in prostate cancer identification.
The discovery of microparticles initially stemmed from the observation in 1946, where
Erwin Chargaff and Randolph West discovered that platelet-free plasma exhibited
clotting properties. This contradicted the major dogma of preceding times, that platelets
served necessarily as the blood coagulation contributor (Chargaff and West, 1946).
However, microparticles were not formally described until 1976, when Peter Wolf noted
vesicular fragments rich in phospholipids originating from activated platelets, which he
termed “platelet dust.” This was subsequently replaced with term microparticle (Wolf,
1971). Platelet microparticles (PMP) are by far the most abundant and account for 70% to
90% of circulating microparticles in the bloodstream (Xu et al., 2011). It is now accepted
that PMPs play a significant role in modulating normal physiological processes such as
coagulation. Coagulation is expressed by way of multifunctional cellular signaling
proteins such as tissue factor (Brett et al., 2015), plasminogen activator inhibitor-1 and
vitronectin (Podor et al., 2002). In terms of prostate cancer, PMP firmly adhere to
prostate cancer cells and significantly increase their adhesion to endothelial cells (Varon
et al., 2012). In vitro studies have shown that PMPs promote tumor cell invasive
properties through increases in metalloproteinases (MMP-2) synthesis and secretion
(Dashevsky et al., 2009). In vivo mouse studies have also shown that platelet
microparticles enhance prostate cancer cell accumulation and yield more neoplastic foci
MPs associated with the prostate were first discovered in 1977 by Ronquist and
Hedstrom (Ronquist and Hedstrom, 1977). These EVs were secreted by acinar cells of
the prostate and later termed prostasomes (Brody et al., 1983). Studies on semen have
shown that their role in protecting sperm from the female innate immune system is by
way of suppressing natural killer cell (NK) activation. This is done through CD48 ligand
on the prostasomes interacting with NK-activating receptor CD244 (Tarazona et al.,
2011). Compared to exosomes, they are enriched with cholesterol, sphingomyelin, Ca2+,
guanosine diphosphate, and many transmembrane proteins (CD13, CD46, CD55, and
CD59) (Duijvesz et al., 2011; Sandvig and Llorente, 2012).
Prostasomes are emerging as rich reservoirs of tumor-specific proteins and biomarkers
for cancer detection and progression. They can be isolated from prostatic secretions,
seminal fluid, tissue, urine or blood. Structurally, they are distinct in size, membrane
composition and specific prostate protein content, potentially providing a novel isolatable
source of biomarkers (Drake and Kislinger, 2014; Brett et al., 2015). Tavoosidana et al,
developed a proximity ligation assay (PLA) to detect these microparticles in blood
plasma from patients with prostate cancer and control subjects. The assay identified
microparticles to be significantly higher in men with prostate cancer when compared to
the controls and was able to successfully distinguish prostate cancers with low Gleason
scores from those with medium and high Gleason scores, reflecting disease severity (GS
8/9 and GS 7 from GS 6) (Tavoosidana et al., 2011).
In addition, PCA3 and TMPRSS2-ERG RNA transcripts have been detected in
prostasomes isolated from urine of prostate cancer patients. It was revealed that elevated
levels were associated with cancer (Nilsson et al., 2009). Biggs CN, Siddiqui KM et al,
have enumerated prostate cancer microparticles of patients with various Gleason grades
using prostate specific membrane antigen (PSMA) and nanoscale flow cytometry. Their
study highlighted the ability of PCMPs to risk stratify GS≥8, high risk prostate cancer,
from healthy volunteer plasma. Plasma containing the MPs was collected prior to and
after radical prostatectomy and GS was obtained from final surgical pathology.
Interestingly, they were able to show that these microparticles significantly decreased
treatment response during clinical follow-up (Biggs et al., 2016).
Elucidating MP composition and functional activity is hampered by the complexity of the
biological fluids where MPs are present and the small size of MPs (van der Pol et al.,
2010). Visualization techniques such as electron microscopy (EM) and confocal
microscopy (CM) with MPs stained with fluorescent antibodies provides good
morphological characterization of microparticles but cannot serve as quantitative assays
in a high throughput manner. With enhancements in technology, microparticles are able
to be enumerated with greater accuracy allowing new avenues of research to study their
clinical utility (Leong et al., 2011). One such advancement is flow cytometry which
utilizes both fluorescence probes and light scattering. Quantification by flow cytometry
shows good correlation with the relative light scattering intensities determined by
dynamic light scattering (Xu et al., 2011). However, conventional flow cytometry light
scattering has size limitations and usually not able to detect MP with diameters smaller
than 300–400 nm as a separate fraction (van der Pol et al., 2010; Zwicker, 2010;
Barteneva et al., 2013). Next generation instruments such as nanoscale flow cytometry
are able to readily analyze events 100-1000 nm for analysis of multiple biomarkers on
MPs such as those from the prostate in a high-throughput and multi-parametric manner
(van der Pol et al. 2014; Biggs et al., 2016).
1.14
Nanoscale Flow Cytometry
Our lab utilizes an Apogee A-50Micro nanoscale flow cytometer to enumerate EVs
smaller than 1000 nm. This specialized instrument analyzes EVs in a high-throughput,
multi-parametric manner. The equipment is manufactured by Apogee FlowSystems Inc.,
in Hertfordshire, UK (Figure 3). This machine has three lasers installed; the laser
wavelengths are 405 nm, 488 nm and 635 nm (Figure 4). The multiple light scattering
and fluorescence detectors help increase the detection limit to 100 nm and increase the
resolution to <10 nm. This machine is equipped with Peripheral Component Interconnect
Express (PCIe) high-speed computer software used for data acquisition at a speed of up
Conventional flow cytometers on the market today resolve up to 200 nm diameter latex
beads by light scatter but will fall close to the instrument’s sensitivity limit. Also, latex is
far more refractive (refractive index ~1.59) than biological particles (refractive index
~1.40). For example, a 400 nm biological particle may scatter about the same as a 200
nm latex bead. Conventional flow cytometers are therefore not suitable for measuring
light scattered by biological particles less than about 400 nm diameter. The Apogee
A-50M can measure particles which scatter 1000 times less than 200 nm latex beads making
it the ideal instrument to accurately enumerating EVs of various sizes (Apogee Flow
systems, 2017).
1.15
Prostate Cancer Surface Markers
To characterize the cellular origin of MPs in peripheral blood, the most common
approach is to stain MPs with fluorescently-labeled antibodies directed against antigens
of parental cells. For example, antibodies against CD41, CD61 and platelet activation
marker CD62 may be used to identify MPs from platelets, glycophorin for erythrocyte
MPs; CD45 for lymphocyte MPs; CD14 for monocyte MPs, and so on (Barteneva et al.,
2013). In this study, a combination of three different antibodies targeting distinct antigens
will be used to characterize the origins of the MPs from prostate cancer plasma samples
from those of control samples. All antibodies were conjugated to a fluorophore that the
nanoscale flow cytometer can detect through laser light excitation. Specifically, these
antigens are divided into two broad categories, namely prostate tissue specific antigens
and cancer specific antigens. The tissue specific antigens include prostate specific
membrane antigen (PSMA) and six-transmembrane epithelial antigen of prostate 1
(STEAP1). The prostate cancer specific antigens include ghrelin receptor (GHSR1a), and
CD151. The combination of PSMA, STEAP1 and one of the cancer specific antigens will
be used to enumerate triple-positive MPs. The hypothesis is these combinations can allow
differentiation prostate cancer plasma samples from control group plasma samples
(benign prostatic hypertrophy (BPH) or healthy volunteers). A further hypothesis is the
Gleason grade for prostate cancer can be accurately determined when analyzed using the
1.16
Prostate Specific Membrane Antigen (PSMA)
PSMA is a type II transmembrane protein. It has a unique 3-part structure: a
19-amino-acid internal portion, a 24-amino-19-amino-acid transmembrane portion, and a 707-amino-19-amino-acid
external portion (Israeli et al., 1993; Chang, 2004). PSMA has known enzymatic
activities and acts as a glutamate-preferring carboxypeptidase. The impact of these
enzymatic functions on prostatic tissue remains unclear (Pinto et al., 1996). PSMA does
have an internalization signal that allows the surface protein to enter into the cell as an
endosome (Rajasekaran et al., 2003).
The original monoclonal antibody developed for PSMA was a mAb 7E11 used on the
prostate cancer cell line LNCaP. It binds to a PSMA intracellular or cytoplasmic epitope
(Troyer et al., 1997). The US Food and Drug Administration has also approved
radiographic testing using mAb 7E11 known as ProstaScint, by linking it to 111
indium-capromab pendetide to produce a radio-diagnostic marker (Petronis et al., 1998; Hinkle et
al., 1998). The next-generation of antibodies now bind to the extracellular portion of
PSMA and can also be internalized by PSMA expressing cells (Liu et al., 1998).
Furthermore, they are now either fully human or humanized as opposed to murine
antibodies, thus making them even more likely to be diagnostically and therapeutically
effective without possible antimouse reactions (Chang, 2004).
Studies have shown that PSMA is present on all types of prostatic tissue and expression
increases in the presence of prostate cancer. Bostwick and colleagues described PSMA
immunohistochemical expression in 184 prostate specimens examined. All specimens
showed PSMA expression with the degree of expression correlating with the grade of
cancer. There was an increase in the percentage of PSMA staining from benign epithelial
tissue (69.5%) to HG PIN (77.9%) to malignant cells (80.2%) (Bostwick et al. 1998).
Using antibodies compatible with nanoscale flow cytometry, Biggs CN and Siddiqui KM
et al, showed that microparticles positive for PSMA could be enumerated in patients with
prostate cancer. PSMA 3E7 antibodies can accurately differentiate high-grade prostate
cancer (GS 8 or higher) from lower grade prostate cancer and benign prostatic disease