Kinematical Analysis of Under-Arm Throwing
Techniques in Cricket at 45
0Throwing Angle with
112
0and 45
0Approach of 10 Meter Distance
MOHD ARSHAD BARI IKRAM HUSSAIN
Department of Physical Education Aligarh Muslim University Aligarh, India
Abstract:
For the purpose of the study ten male intervarsity cricket players were selected as the subjects. The purpose of this study is to analyze the kinematic variables of underarm throwing technique in cricket (ball velocity, accuracy, and segmental angular variables). Thrower performed under-arm throwing technique with 1120 and 450 approach angle at 450 throwing angle of 10m distance. The mean age, height and body weight of the subjects were reported as 20.60 ± 2.91 years, 170.80 ± 4.02 cm and 60.80 ± 5.14 kg respectively. Canon Legria SF-10 Camcorders were used to record throwing movement, functioning at 120 Hz. The Silicon Coach Pro7 motion analysis software was used to analyze the identified clips. The result of study revealed that there is insignificant difference between ball velocity and accuracy.
Key words: kinematics, approach angle, wind-up, late-cocking and acceleration
Introduction
to identify important variables and characteristics of throwing performance. To facilitate analysis and understanding, many researchers have divided the throwing action into specific phases, each with its own biomechanical function (Elliott et al. 1990). Assessment of throwing technique in cricket has been the basis for previous studies across a range of sports; these have served to identify important variables and characteristics of throwing performance to facilitate analysis and understanding, many researchers having divided the throwing action into specific phases, each with its own biomechanical function (Elliott et al. 1990). Although the throw can be divided into specific phases, this does not infer a discontinuous action but serves only to aid subsequent analysis (Elliott et al. 1990).
The throwing motion can be broken down into several key temporal parameters based on distinct motions involved in every throw. Different studies use different temporal parameters based on the needs of the study: Werner et al. (2001) broke down the throwing motion into three phases: stride foot contact to the instant of maximum shoulder external rotation (cocking phase), maximum external rotation to the instant of ball release (acceleration phase), and from ball release until 500 milliseconds after the ball has been released (follow-through phase). Subdivision of the throwing technique has enabled important variables of performance to be identified within each phase, in addition to an overview of technique in which the whole body can be seen to work in a coordinated fashion to achieve its goal.
The main aim of this study is find out best mechanical variation in under arm throwing technique with 1120 and 450
approach angle at 450 throwing angle of 10m distance in
respect to ball velocity and accuracy.
Methodology:
Methodology: Ten male cricket players from the University level offered to take part as subjects in this study. They executed underarm throws at maximum velocity toward 450 target/stump situated at a distance of 10 meters with 1120
were: 20.60 ± 2.91 years, 170.80 ± 4.02 cm and 60.80 ± 5.14 kg respectively. Two Canon Legaria SF-10 cameras set at a frame rate of 60 frames per second were used to record kinematics data of entire throwing movement.
The throwing arm between their respective optical axes of the camera was almost as giving a 900 mediolateral axis (camera optical axes perpendicular on the sagittal plane) and in the sagittal plane it was erected in parallel. The camera was set-up on a rigid tripod and secured to the floor in the location at a distance of 10 meter from the point of throw. The camera was positioned perpendicular to the sagittal plane and parallel to the mediolateral axis (camera optical axes perpendicular on the sagittal plane) as their throwing arm giving approximately a 900 between their respective optical axes. The photographic camera was set at 95 cms height from the surface and tilted down in order to get the image of the subject as large as possible while all points of interested were kept within a frame. The recorded throwing data were downloaded on personal computer, cut and edited with the help of STHVCD55 software. Digitization and data analysis were completed by the Silicon Coach Pro7 motion analysis software. The delimitation of the kinematic variables of this study were angles, displacement, time, speed, velocity and number of frames. Acquired data were subjected to statistical analysis. An independent t-test was used for the comparison of the kinematic parameters between under arm throws performed with two different approach angles, at 1120 and 450. All
statistical procedures were conducted using the SPSS 18.0 software at 0.05 level of confidant.
Results:
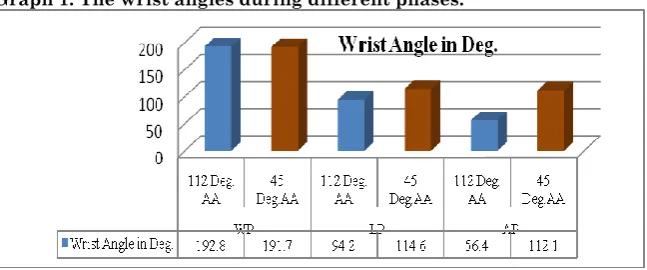
Table 1. Wrist joints angle differences between under-arm throwing
at 1120 and 450 approach angles at 450 throwing of 10 meter distance.
Variabl
es Phases AA No. Mean SD (±) df Mean Difference Calculated t
Wrist Angle
WP 1124500 10 10 192.80 12.51 191.70 14.56 18 1.10 0.18
LP 1124500 10 10 94.20 114.60 21.19 15.49 18 20.40 2.46*
Tab t.0.05 (18) =2.10 *Significance at 0.05 levels.
WP=Wind-Up Phase; LP= Late Cocking Phase; AP= Acceleration Phase; AA=
Approach Angle
The analysis of data in Table 1 shows that there is a significant difference of wrist joint angles between under-arm throwing at 1120 and 450 approach angles at 450 throwing of 10 meter
distance in their late-cocking and acceleration phase as the obtained ‘t’ ratio is greater than the required ‘t’ value of 2.10, whereas there are insignificant differences of wrist joints angle between under-arm throwing at 1120 and 450 approach angles
at 450 throwing of 10 meter distance in their wind-up phase.
Graph 1. The wrist angles during different phases.
SA=Side-Arm; OH= Over-Head; WP=Wind-Up Phase; LP= Late Cocking Phase; AP= Acceleration Phase
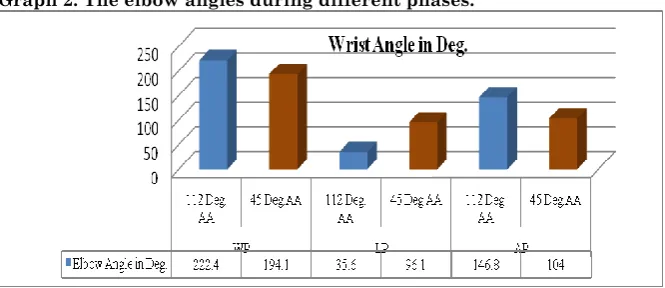
Table 2. Elbow joints angle differences between under-arm throwing
at 1120 and 450 approach angle at 450 throwing of 10 meter distance.
Variables Phases AA No. Mean SD (±) df Mean Difference Calculated t
Elbow Angle
WP 1120 10 222.40 13.28 18 28.30 3.23* 450 10 194.10 24.24
LP 1124500 10 10 35.60 96.10 9.81 18.90 18 60.50 8.98*
AP 1124500 10 10 146.80 104.00 15.85 25.56 18 42.80 4.50* Tab t.0.05 (18) =2.10 *Significance at 0.05 levels.
1120 and 450 approach angles at 450 throwing of 10 meter
distance in their wind-up, late-cocking and acceleration phase as obtained ‘t’ ratio is greater than the required ‘t’ value of 2.10.
Graph 2. The elbow angles during different phases.
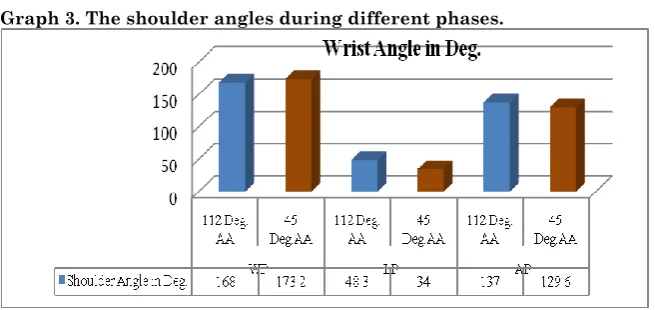
Table 3. Shoulder joints angle differences between under-arm
throwing at 1120 and 450 approach angle at 450 throwing of 10 meter
distance.
Variables Phases AA No. Mean SD (±) df Mean Difference
Calculat ed t
Shoulder Angle
WP 1124500 10 10 168.00 11.05 173.20 12.52 18 5.20 0.98
LP 1120 10 48.30 15.84 18 14.30 2.55* 450 10 34.00 7.96
AP 1120 10 137.00 12.27 18 7.40 0.67 450 10 129.60 33.00
Tab t.0.05 (18) =2.10 *Significance at 0.05 levels.
The analysis of data in Table 3 shows that there is a significant difference of shoulder joints angle between under-arm throwing at 1120 and 450 approach angles at 450 throwing of 10 meter
distance in their late-cocking as obtained ‘t’ ratio is greater than the required ‘t’ value of 2.10 whereas there are insignificance differences of shoulder joints angle between under-arm throwing at 1120 and 450 approach angles at 450
Graph 3. The shoulder angles during different phases.
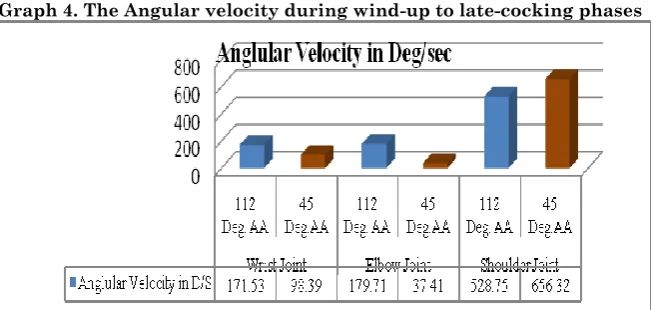
Table 4. Angular kinematics differences between under-arm
throwing at 1120 and 450 approach angles at 450 throwing of 10 meter
distance during wind-up to late-cocking phase.
Variables AA No. Mean SD (±) df Mean Difference Calculated t wrist
joint 1120 10 171.53 125.11 18 73.14 1.64
450 10 98.39 64.97
Elbow joint
1120 10 179.71 78.85
18 142.30 5.41*
450 10 37.41 26.51
Shoulder joint
1120 10 528.75 103.18
18 127.58 1.94
450 10 656.32 180.54
Tab t.0.05 (18) =2.10 *Significance at 0.05 levels.
The analysis of data in Table 4 shows that there are significant differences between under-arm throwing at 1120 and 450
approach angles at 450 throwing of 10 meter distance during
Graph 4. The Angular velocity during wind-up to late-cocking phases
WJ=Wrist Joint EJ=Elbow joint SJ= Shoulder Joint
Table 5. Angular kinematics differences between under-arm
throwing at 1120 and 450 approach angles at 450 throwing of 10 meter
distance during late-cocking phase to acceleration phase.
Variables AA No. Mean SD (±) df Mean Difference
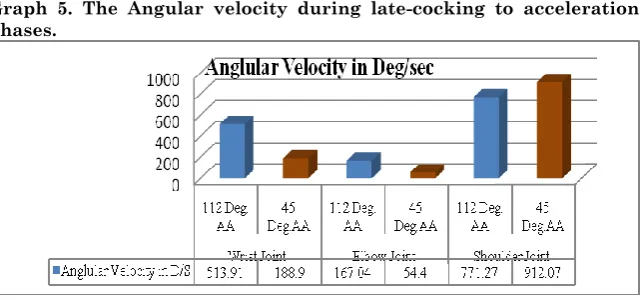
Calc ulat ed t wrist joint 1120 10 513.91 190.77
18 325.01 3.78
* 450 10 188.90 194.17
Elbow joint 112
0 10 167.04 118.84
18 112.64 2.90
* 450 10 54.40 30.77
Shoulder joint
1120 10 771.27 194.28
18 140.80 1.45
450 10 912.07 238.68
Tab t.0.05 (18) =2.10 *Significance at 0.05 levels.
The analysis of data in Table 5 show that there are significant differences between under-arm throwing at 1120 and 450
approach angles at 450 throwing of 10 meter distance during
Graph 5. The Angular velocity during late-cocking to acceleration phases.
Table 6. Ball velocity and accuracy differences between under-arm
throwing at 1120 and 450 approach angles at 450 throwing of 10 meter
distance.
Variables AA No. Mean SD (±) df Mean Difference Calculated t Ball
Velocity 1120 10 14.89 3.39 18 1.28 0.95
450 10 13.61 2.58
Ball
Accuracy 1120 10 0.30 0.48 18 0.00 0.00
450 10 0.30 0.48
Tab t.0.05 (18) =2.10 *Significance at 0.05 levels.
The analysis of data in Table 6 show that there are insignificant differences between under-arm throwing at 1120
and 450 approach angles at 450 throwing of 10 meter distance in
their ball velocity and accuracy of cricket ball throwing as obtained ‘t’ ratio is less than the required ‘t’ value of 2.10.
Graph 6. The ball velocity and accuracy under-arm throwing at 1120
Discussion:
One of the purposes of this study has been to compare the under arm throwing techniques with two different approach angle. Throwing approach determines if there are any significant differences or not. The second purpose of this study has been to find out the best throwing mechanics of under arm throws at different approaches in view of achieving the highest accuracy and velocity. Putnam (1993) noted that the way segments move in sequence and the way their motions are timed may vary across skills, suggesting as possible causes the different task demands of speed and accuracy.
The result shows that the ball velocity and accuracy of underarm throws with 450 throwing angle at 1120 and 450
approach angles of 10 m distances differ insignificantly when the ball velocity was analyzed in term of joint angles of under arm throws at wind-up, late-cocking and acceleration phase with 1120 and 450 approach angle at 450 throwing angles of 10
distances. At the wind up phase or ball contact phase, the wrist and shoulder joint show no difference in their mechanics due to the same throwing angle at a same preferred distance.
acceleration (Hussain et al. 2011; Felter et al. 1986). At the acceleration phase, wrist and elbow joints angle have significant mean differences except shoulder joint angle. The changes at wrist and elbow joint may be due to changes of body position. Throwing arm comes to the final phase of throwing from late cocking phase at different angle of approach 1120 and
450 , this probably being the main reason why the results of the
study show significant mean differences.
There are insignificant differences between under-arm throwing at 1120 and 450 approach angles at 450 throwing of 10
meter distance in their angular velocity of elbow joints during first phase and shoulder joint during the second phase of performing the throws.
The present study showed that angular velocity of elbow joint during first phase and shoulder joints during second phase of throwing are different at 1120 and 450 approach angle at 450
throwing angle of 10m distance. Dun et al. (2007) investigated that ball velocity and body segment velocity variables showed no significant differences between the two groups. The angular velocities of elbow and shoulder joints are a factor to cause variation in the ball velocity as well as differences in approach angle for under arm throwing techniques.
Conclusion:
The 1120 approach angle at 450 throwing angles of 10m
distance; the under arm throw was an answerable factor to achieving greater ball velocity as compared to 450 approach
angle.
In the case of 1120 and 450 approach angle at 450 throwing
BIBLIOGRAPHY
Altham, H. S. 1962. A History of Cricket. George Allen & Unwin.
Atwater, A. E. 1979. “Biomechanics of over arm throwing and of throwing injuries.” Exercise and Sports Science Reviews 7: 43-85.
Best, R. J., R. M. Bartlett, and C. J. Morriss. 1993. “A three-dimensional analysis of javelin throwing technique.” Journal of Sports Sciences 11: 315-328.
Bowen, R. 1970. Cricket: A History of its Growth and Development. Eyre & Spottiswoode.
Elliott, B., and G. Anderson. 1990. “Age-related differences in high performance over arm throwing patterns.” Journal of Human Movement Studies 18: 1-24.
Feltner, M., and J. Dapena. 1986. “Dynamics of the shoulder and elbow joints of the throwing arm during a baseball pitch.” International Journal of Sport Biomechanics 2(4): 235-260.
Hussain, I., and M. A. Bari. 2011. “Biomechanical Analysis of Cricket Ball Throwing Techniques.” Journal of Education and Practice 2(3): 29-35.
_________________________. 2011. “Biomechanical Analysis of Overhead Throwing in Cricket.” International Journal of Sports Science and Engineering 5(3): 163-168.
Hussain, I., M. A. Bari, A. Khan, and A. Ahmad A. Mohammad. 2011. “Accuracy-Velocity Relationship and Physical Characteristics in Cricket Ball Throwing.”
International Journal of Sports Science and Engineering 5(1):
43-48.