Scholarship@Western
Scholarship@Western
Electronic Thesis and Dissertation Repository
4-21-2015 12:00 AM
Multivariate Analysis of MR Images in Temporal Lobe Epilepsy
Multivariate Analysis of MR Images in Temporal Lobe Epilepsy
Diego H. Cantor-Rivera
The University of Western Ontario
Supervisor
Dr. Terry M. Peters
The University of Western Ontario
Graduate Program in Biomedical Engineering
A thesis submitted in partial fulfillment of the requirements for the degree in Doctor of Philosophy
© Diego H. Cantor-Rivera 2015
Follow this and additional works at: https://ir.lib.uwo.ca/etd
Part of the Biomedical Engineering and Bioengineering Commons
Recommended Citation Recommended Citation
Cantor-Rivera, Diego H., "Multivariate Analysis of MR Images in Temporal Lobe Epilepsy" (2015). Electronic Thesis and Dissertation Repository. 2823.
https://ir.lib.uwo.ca/etd/2823
This Dissertation/Thesis is brought to you for free and open access by Scholarship@Western. It has been accepted for inclusion in Electronic Thesis and Dissertation Repository by an authorized administrator of
EPILEPSY
(Thesis format: Integrated Article)
by
Diego Hernando Cantor Rivera
Graduate Program in Graduate Program in Biomedical Engineering
A thesis submitted in partial fulfillment
of the requirements for the degree of
Doctor of Philosophy
The School of Graduate and Postdoctoral Studies
The University of Western Ontario
London, Ontario, Canada
c
Epilepsy stands aside from other neurological diseases because clinical patterns of progression
are unknown: The etiology of each epilepsy case is unique and so it is the individual prognosis.
Temporal lobe epilepsy (TLE) is the most frequent type of focal epilepsy and the surgical
excision of the hippocampus and the surrounding tissue is an accepted treatment in refractory
cases, especially when seizures become frequent increasingly affecting the performance of
daily tasks and significantly decreasing the quality of life of the patient. The sensitivity of
clinical imaging is poor for patients with no hippocampal involvement and invasive procedures
such as the Wada test and intracranial EEG are required to detect and lateralize epileptogenic
tissue.
This thesis develops image processing techniques using quantitative relaxometry and
dif-fusion tensor imaging aiming to complement current MRI-based diagnosis by providing
addi-tional diagnostic clues. Chapter 2 develops the concept of individual feature maps on regions
of interest. A laterality score on these maps correctly distinguished left TLE from right TLE
in 12 out of 15 patients. Chapter 3 explores machine learning models to detect TLE, obtaining
perfect classification for patients with left TLE, and 88.9% accuracy for patients with right
TLE. Chapter 4 focuses on temporal lobe asymmetry developing a voxel-based method for
assessing asymmetry and verifying its applicability to individual predictions (92% accuracy)
and group-wise statistical analyses. Informative ROI and voxel-based informative features are
described for each experiment, demonstrating the relative importance of mean diffusivity over
other MR imaging alternatives in identification and lateralization of TLE patients. Finally, the
conclusion chapter discusses contributions, main limitations and outlining options for future
research.
Keywords: TLE, Q-MRI, DTI, FA, MD, T1, T2, DESPOT1, DESPOT2, asymmetry,
Kolmogorov-Smirnov test, single-subject t-test, epilepsy, SVM, machine learning, feature
se-lection, support vector machines, diffusion tensor imaging, quantitative relaxometry,
quantita-tive imaging
First and foremost I would like to thank Dr. Terry Peters for having welcomed me to be a part
of his team. Throughout these years he has been a mentor and has taught me to be patient,
dedicated and to think outside the box. He has infinite patience and he is always been available
for his students, even when away on conferences. Terry allowed me to take time offto write a
book, even when that meant losing a student for a year. He recognized the importance of this
project and its significance in my professional career, and I owe it to him. I can proudly say
that I am a better professional and a better person thanks to him.
I would also like to offer my special thanks to Dr. Ali Khan. Ali came along at a moment
when the epilepsy project was hitting a logistical end of the road, and he single-handedly turned
it around and made it into the project that it is today in which effective clinical collaboration
occurs and students have access to clinicians. This had a tremendous impact on our group
and directly on my research. Ali has taught me to be critical of my own work and to not lock
myself into a single perspective. He is true to the spirit of science, and I admire that in him.
He has been directly involved on the day to day of my project and his structured approach and
oversight have resulted in great work quality in which I take pride.
I wish to acknowledge the help provided by Dr. Sandrine de Ribaupierre, Dr. Seyed
Mirsattari, and Dr. Robert Bartha in my advisory committee. Thank you for reviewing my
manuscripts, for evaluating my knowledge on the different epilepsy topics, and for giving me
your professional insight and guidance. Similarly, I want to thank Dr. Jonathan Lau, for his
help, his comments on my manuscripts and for his friendship. Similarly, I want to thank Dr.
Jorge Burneo and Dr. David Steven for participating in our 7 a.m. Friday meetings! and for
their support and contributions to our epilepsy research project.
I am particularly grateful for the assistance given by Diana Timmermans and Christine
Ellwood from the Biomedical Engineering program at Western, and by Anna Pimentel, Sherri
Couto and Janette Wallace at Robarts. These people have helped me tremendously during all
these years with innumerable administrative tasks: guys, you go the extra-mile for the students.
To my friends, Danielle Pace and Chris Russ, I profoundly admire your dedication,
Special thanks to John Baxter, I really, really have enjoyed having you as a lab-neighbour.
All our conversations have been tremendously enriching for me. I have learned a lot from you,
you inspire me and challenge me to be a better engineer. Thank you very much for taking
the time to review my manuscripts and being always willing to have academic discussions.
Anyone who has the opportunity of working with you is very lucky and I am fortunate to be
one of them.
Golafsoun Ameri, thank you so much for being my friend. You have given me strength
throughout all this process. I admire you, you are a great engineer and a fantastic person.
To all my friends and labmates at Robarts. Sadly I cannot mention you all but you know
who you are. Thank you for sharing the ride and for being a lighthouse when the sea is stormy.
Marcela Hernandez-Hoyos, Marcela, I would not be here without you. You have had a
tremendous impact in my life and I am grateful to have had you as a mentor and now as a
colleague.
To my mentors who have enriched my academic life and have taught me so much: Maciej
Orkisz and Oscar Acosta in France, Olivier Salvado in Australia and Sergio Rojas, Rubby
Casallas, and Jorge Villalobos in Colombia. I am grateful for having had the opportunity to
work and learn from you.
Finally I want to tank my family for their patience and support. Jose my partner, thank you
so much for your being there for me every step of the way. There are no words in English or
Spanish to describe my gratitude for your infinite love, patience and support. It does not matter
that the night is cold as long as I have you by my side. To my mom Cecy, and my brothers
Jonathan and Fredy, you are the reason. And lastly to my dad, Hernando Cantor, I know you
would have been so immensely proud of me. I miss you.
Abstract ii
Acknowledgements iv
List of Figures xii
List of Tables xv
List of Appendices xvi
List of Abbreviations, Symbols, and Nomenclature xvii
1 An introduction to the analysis of temporal lobe epilepsy with magnetic
reso-nance imaging 1
1.1 Temporal Lobe Epilepsy: clinical overview . . . 2
1.1.1 Seizures . . . 4
Localization of temporal lobe seizures . . . 5
1.1.2 Role of Electroencephalography . . . 6
Intracranial EEG . . . 8
1.1.3 Role of Imaging . . . 9
Structural MRI . . . 9
Functional MRI . . . 11
PET, SPECT and MRS . . . 12
1.1.4 Surgery: clinical challenges and current techniques . . . 14
1.2 MRI research in Temporal Lobe Epilepsy . . . 15
T1- and T2-weighted images . . . 15
Obtaining quantitative T1 and T2 maps . . . 16
Accelerated methods for T1 and T2 measurement . . . 17
1.2.2 Diffusion tensor imaging . . . 19
Imaging principle: diffusion weighted imaging . . . 19
The diffusion tensor . . . 20
Technical considerations . . . 21
Mean Diffusivity and Fractional Anisotropy . . . 21
MD and FA in the study of TLE . . . 22
1.3 Imaging Analysis Techniques . . . 23
1.3.1 Region-of-interest techniques (ROI) . . . 23
1.3.2 Voxel-based statistical techniques . . . 23
Voxel-based morphometry (VBM) . . . 24
Voxel-based relaxometry (VBR) . . . 26
Voxel-based statistics of DTI-derived maps (VBS) . . . 28
1.3.3 Structural analysis of white matter . . . 29
Tract-based spatial statistics (TBSS) . . . 29
White matter tractography and tractometry . . . 30
1.4 Machine Learning . . . 32
1.4.1 Feature selection . . . 33
Curse of dimensionality . . . 33
Supervised feature selection . . . 34
Unsupervised feature selection . . . 35
1.4.2 Support Vector Machines . . . 36
Principle . . . 36
Kernels and the kernel trick . . . 38
Soft margins . . . 39
Measurements of classification performance . . . 41
1.4.3 Support vector machines in neuroimaging studies of TLE . . . 42
Multivariate pattern analysis . . . 43
1.5 Thesis objectives and scope . . . 44
1.5.1 Thesis overview . . . 44
Chapter 2: Characterization of TLE through individual patient studies . 45 Chapter 3: TLE detection using support vector machines in multi-parametric quantitative MR imaging . . . 45
Chapter 4: Classification of temporal lobe epilepsy patients using voxel-based asymmetry . . . 46
Chapter 5: Conclusions . . . 46
1.6 Co-authorship Statement . . . 47
2 Characterization of TLE through individual patient studies 61 2.1 Introduction . . . 61
2.2 Method . . . 62
2.2.1 Participants and Imaging Protocol . . . 62
2.2.2 Image Preprocessing . . . 64
2.2.3 Segmentation of regions of interest (ROI) . . . 64
2.2.4 Feature quantification . . . 65
Measuring asymmetry in ROI intensities . . . 66
2.2.5 Single-subject statistical tests . . . 69
2.2.6 Individual Feature Maps . . . 70
2.2.7 Patient lateralization based on temporal lobe asymmetry . . . 71
2.2.8 Group analysis . . . 71
2.3 Results . . . 72
2.3.1 Individual feature maps for a MTS patient . . . 74
2.3.2 Individual feature maps for a non-MTS patient . . . 74
Ia - Intensity abnormalities across regions of interest . . . 77
Ib - Intensity abnormalities by image type . . . 78
IIa - Volume asymmetry by region of interest . . . 79
IIb - Ipsilateral/contralateral volume reduction . . . 81
Group-wise comparison of hippocampal volumes . . . 81
2.4 Discussion . . . 82
2.4.1 Study design considerations and limitations of this work . . . 82
2.4.2 On the role of single-subject statistics . . . 83
2.4.3 Comparison with similar studies . . . 84
2.4.4 Clinical Relevance . . . 85
2.5 Conclusion . . . 86
3 TLE detection using support vector machines in multi-parametric quantitative MR imaging 93 3.1 Introduction . . . 93
3.2 Methods . . . 94
3.2.1 Overview . . . 94
3.2.2 Participants . . . 96
3.2.3 Imaging Protocol and Preprocessing . . . 96
3.2.4 Feature Extraction . . . 97
3.2.5 Support Vector Machines . . . 98
3.2.6 Experiments . . . 99
3.2.7 Classification Models . . . 100
3.2.8 Feature Selection . . . 101
Training Set Subsampling . . . 101
Correlation-Based Feature Selection . . . 102
ANOVA-Based Feature Selection . . . 104
Voting Strategy . . . 105
3.2.10 SVM selection and parameter optimization . . . 106
3.3 Results . . . 107
3.3.1 Detection of TLE patients . . . 108
3.3.2 Detection of L-TLE patients . . . 112
3.3.3 Detection of R-TLE patients . . . 113
3.3.4 Evaluation of feature selection methods . . . 115
3.3.5 Informative features for TLE detection . . . 117
3.3.6 Effect of the sample size on the reliability of the results . . . 118
3.4 Discussion . . . 119
3.4.1 Analysis of informative features . . . 119
3.4.2 Criteria for the selection of the feature set cardinality . . . 121
3.4.3 Criteria for the selection of a classification model . . . 123
3.4.4 Comparison with similar studies . . . 124
3.4.5 Limitations of this work . . . 125
3.5 Conclusion . . . 126
4 Classification of temporal lobe epilepsy patients using voxel-based asymmetry 132 4.1 Introduction . . . 132
4.2 Methods and Materials . . . 133
4.2.1 Participants . . . 133
4.2.2 Data acquisition and preprocessing . . . 134
4.2.3 Measuring Voxel-based asymmetry . . . 136
Defining homologous voxel neighbourhoods . . . 136
Measuring voxel-based asymmetry . . . 137
4.2.4 Statistical analysis of temporal lobe asymmetry . . . 140
4.2.5 TLE patient identification using Support Vector Machines . . . 141
Feature selection . . . 142
Robust features and informative features . . . 143
4.3 Results . . . 144
4.3.1 Differences in temporal lobe asymmetry between patients and con trols 144 4.3.2 TLE patient identification using SVM on voxel-based asymmetry features145 4.3.3 Analysis of informative features . . . 146
Informative features in the mesial temporal region (MSL) . . . 149
Informative features in the lateral temporal region (NEO) . . . 150
Informative features in the anterior temporal lobe (ATL) . . . 151
4.4 Discussion . . . 152
4.4.1 Comparison to multi-voxel pattern analysis methods . . . 153
4.4.2 Comparison to similar multi-parametric classification studies . . . 153
4.4.3 Feature selection trade-offs . . . 154
4.4.4 Criteria for the selection of K . . . 155
4.4.5 Limitations . . . 156
4.5 Conclusion . . . 157
5 Conclusions 163 5.1 Contributions . . . 163
5.2 Limitations . . . 165
5.3 Future Research . . . 166
A Individual Feature Maps 171 A.1 IFM for a MTS patient . . . 171
A.2 IFM for a non-MTS patient . . . 175
B Research Ethics Board Approval 179
Curriculum Vitae 181
1.1 Anatomy of the temporal lobe . . . 2
1.2 Neurotransmission . . . 4
1.3 Hypothesis of multiple independent generators in TLE . . . 5
1.4 EEG principle . . . 7
1.5 10-20 electrode array . . . 8
1.6 Temporal lobe seizure . . . 9
1.7 Structural imaging in TLE . . . 10
1.8 PET-FDG . . . 13
1.9 Temporal lobe surgery . . . 14
1.10 Quantitative Relaxometry . . . 18
1.11 Measuring diffusion . . . 20
1.12 MD and FA . . . 22
1.13 Voxel-based statistical techniques . . . 24
1.14 VBM and VBR comparison . . . 27
1.15 Tractography . . . 30
1.16 Supervised feature selection . . . 35
1.17 Support Vector Machines . . . 37
2.1 Kolmogorov-Smirnov test . . . 66
2.2 Intensity distribution asymmetry . . . 67
2.3 Measuring intensity asymmetry . . . 68
2.4 Statistical tests . . . 69
2.5 IFM for a L-TLE patient with MTS . . . 75
2.7 Intensity abnormalities by group . . . 78
2.8 Intensity abnormalities by image type . . . 79
2.9 Comparison of volume asymmetry abnormalities between groups . . . 80
2.10 Volume asymmetry (contralateral vs. ipsilateral) . . . 81
3.1 Overview of the method . . . 95
3.2 Image preprocessing and feature extraction steps . . . 98
3.3 Linear vs. non-linear SVMs . . . 99
3.4 Feature selection . . . 102
3.5 Grid search for RBF SVM parameter selection . . . 107
3.6 Parameter selection . . . 108
3.7 Stable ROI selected based on left/right mean intensity . . . 110
3.8 Stable ROI selected based on asymmetry . . . 111
3.9 Feature space projection . . . 111
3.10 Feature stability . . . 116
3.11 Similarity between feature selection methods . . . 117
3.12 SVM reliability index . . . 119
3.13 Relevant features by kind . . . 120
3.14 Classification accuracy vs. number of features . . . 122
3.15 Computational performance . . . 124
4.1 Method overview . . . 134
4.2 Establishing hemispheric correspondence . . . 136
4.3 Evaluation of voxel-based asymmetry . . . 138
4.4 Construction of voxel-based asymmetry maps (VBA maps) . . . 139
4.5 Visual inspection of asymmetry maps . . . 140
4.6 Temporal lobe regions . . . 141
4.7 Feature selection . . . 143
4.9 SVM classification . . . 147
4.10 Classification accuracy as a function of feature set cardinality . . . 149
4.11 Analysis of informative temporal lobe features . . . 151
5.1 Subject-to-boundary correlation . . . 167
5.2 voxel-based asymmetry patterns . . . 168
1.1 Examples of kernel functions . . . 39
2.1 Clinical summary . . . 63
2.2 IFM results . . . 73
3.1 TLE detection results . . . 109
3.2 L-TLE detection results . . . 112
3.3 R-TLE detection results . . . 114
3.4 Summary of ROI identified by informative features . . . 121
3.5 Estimation of K using a L1-penalized logistic regression model . . . 122
4.1 Clinical summary and patient demographics . . . 135
4.2 Descriptive statistics . . . 144
4.3 Multivariate test results . . . 145
4.4 Patient identification using SVMs . . . 148
4.5 Analysis of informative features . . . 150
Appendix A Individual Feature Maps . . . 171
Appendix B Research Ethics Board Approval . . . 179
AEDantiepileptic drug.
CSFcerebrospinal fluid.
ECDFempirical cumulative distribution function.
EEGelectroencephalography.
FAfractional anisotropy.
FCDfocal cortical dysplasia.
FLAIRfluid attenuation inversion recovery.
GMgray matter.
ICAindependent component analysis.
ILAEInternational League Against Epilepsy.
KSKolmogorov-Smirnov test.
L-TLEleft TLE.
MDmean diffusivity.
MRSmagnetic resonance spectroscopy.
MTLmesial temporal lobe.
MTSmesial temporal sclerosis.
MTS+group of patients with mesial temporal sclerosis.
MTS-group of patients without mesial temporal sclerosi.
MVPAmulti-voxel pattern analysis.
PCAprincipal component analysis.
PETpositron emision tomography.
R-TLEright TLE.
SPGRspoiled gradient recalled echo.
SVMsupport vector machine.
TLEtemporal lobe epilepsy.
VBAvoxel-based asymmetry.
VBMvoxel-based morphometry.
VBRvoxel-based relaxometry.
WMwhite matter.
An introduction to the analysis of
temporal lobe epilepsy with magnetic
resonance imaging
Overview This chapter provides an introduction to TLE with a clinical overview where
elec-troencephalography and neuroimaging are introduced as the main diagnostic tools. This offers
the context for the discussion of current MRI research in TLE, motivating the use of the two
techniques in this work: quantitative relaxometry and diffusion tensor imaging. Subsequently,
a brief description of image analysis, and machine learning techniques relevant to this thesis
are included. The chapter concludes with a description of the goals and scope of this work and
a summary of each chapter.
1.1
Temporal Lobe Epilepsy: clinical overview
Temporal lobe epilepsy (TLE) is the most common type of focal epilepsy, accounting for up to
60% of all adult epilepsy cases [1]. TLE is characterized by seizures originated in the temporal
lobe (Figure 1.1).
parahippocampal gyrusentorhinal cortex collateral sulcus subthalamic nucleus lateral ventricle optic tract thalamic nuclei: anteroprincipal ventrolateral medial dorsal hippcampus dentate gyrus inferior temporal: sulcus gyrus middle temporal gyrus superior temporal: gyrus sulcus lateral sulcus putamen globus pallidus: external internal
Figure 1.1:Anatomy of the temporal lobe. This schematic shows temporal lobe structures in bold, in relationship with limbic and extra-temporal structures.1
According to the International League Against Epilepsy (ILAE) having a seizure is not a
sufficient condition for an epilepsy diagnosis. The seizures must be “frequent, and unprovoked by any immediate identified cause” [1]. According to the ILAE classification of seizures from 1981, focal seizures can be: partial simple (no loss of consciousness), or partial complex (loss
of consciousness) [2]. However, this classification has been debated by experts around the
world, due to the lack of agreement in the embodiment of the word consciousness. After all,
what does it mean to be conscious? With this philosophical dilemma at hand, the ILAE task
force shifted the emphasis of the classification from consciousness tocognition, encompassing five categories [3]:
1Adapted with permission fromhttp://www.brains.rad.msu.edu, andhttp://brainmuseum.org, supported
• perception: the symbolic conception of sensory information
• attention: the appropriate selection of a principal perception or task
• emotion: the appropriate affective significance of a perception
• memory: the ability to store and retrieve percepts or concepts, and
• executive function: the process of anticipation, selection, monitoring of consequences, and initiation of motor activity including praxis, and speech.
With this definition, the ambiguity of the termloss of consciousnesscould be replaced with the more practicalloss of cognitive ability or, in other words, partial complex seizures could be replaced by partialdyscognitiveseizures, as long as two or more cognitive categories were deemed impaired during the seizure [4]. Nonetheless, this classification of partial seizures
has been heavily criticized [5], as there is no consensus that cognition is more inclusive or even more useful than consciousness. Under these circumstances, the ILAE’s stance is that of continuity with the original 1981 classification, suggesting an additional characterization of
focal seizures on a case-by-case basis [5, 6].
The multiplicity of taxonomies and the lack of a consistent ontology are not caused only
by scientific stances or clinical disagreements. There is an undeniable reality: temporal lobe
epilepsy is indeed aheterogeneous disease, with multiple etiologies and abnormal physiologi-cal processes that we do not fully understand. Electroencephalography (EEG) and
neuroimag-ing are the main tools that have allowed us to better understand TLE, and among imagneuroimag-ing
modalities, structural MRI is the most commonly used. Both EEG and MRI have sensitivity
and specificity issues and patient evaluation is performed using both: agreement between EEG
and MRI translates into optimal clinical outcomes; disagreement, into long-term or invasive
EEG monitoring, and palliative care. Thus, the goal of any TLE diagnostic technique is to
1.1.1
Seizures
Aseizure(from the Latinsacire -to take possession of) is the clinical manifestation of an ab-normal, excessive, hyper-synchronous discharge of a population of cortical neurons [7]. Such
discharges are caused by either excessive excitation or loss of inhibition in neuronal synapses
(Figure 1.2).
Figure 1.2:Neurotransmission. Neurotransmission occurs by the interaction of neurotransmitter chem-icals with ion channels in the neuronal synapses2.
When the action potential (electrical impulse) reaches the axon terminal, voltage-gated ion
channels open, allowing the influx of Na+ ions. These ions cause the release of chemicals
known as neurotransmitters into the synapses. Neurotransmitters bind to receptors present in
the post-synaptic neuron, causing a change of permeability and opening (excitatory action) or
closing (inhibitory action) the post-synaptic neuron ion channels (Na+, K+, Cl−, Ca2). A new
action potential can be induced or inhibited in the post-synaptic neuron depending on the type
and the relative concentration of ions between the pre-synaptic and the post-synaptic neuron.
After accomplishing their task, neurotransmitters are broken down by enzymes in the synaptic
cleft. The induced action potential is “all-or-none”: the post-synaptic neuron must reach a
threshold in order to fire and propagate the message.
In this context, seizures are associated with malfunction of the ion channels modulated by
the excess (or the lack of) neurotransmitters, in particular: glutamate (excitatory
neurotransmit-ter) and GABA (inhibitory neurotransmitneurotransmit-ter). It has been shown in animal models that
gluta-mate agonists (substance capable of activating glutagluta-mate receptors) can induce seizures [8, 9],
whereas GABA agonists such as benzodiazepines and barbiturates are the base for antiepileptic
drugs (AEDs) [10].
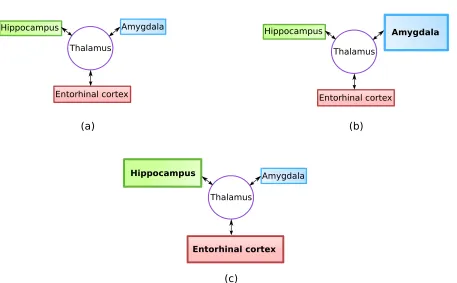
Localization of temporal lobe seizures
Thalamus
Hippocampus Amygdala
Entorhinal cortex
(a) (b)
Thalamus
Hippocampus Amygdala
Entorhinal cortex
(c)
Thalamus
Hippocampus Amygdala
Entorhinal cortex
Figure 1.3: Hypothesis of multiple independent generators in TLE. a) a situation where all three structures contribute equally to the seizure. b) Theoretical amygdala-dominant seizure. c) A seizure in which the amygdala would play a little role in relation to the other structures.3
There are several pathologies in the temporal lobe that can be responsible for seizures.
These include tumours, vascular and developmental malformations, cortical dysplasia, tubers,
3Adapted from Epilepsy & Behavior 14 (2009), Bertram, Edward H.,Temporal lobe epilepsy: Where do the
trauma, infections, genetic syndromes, and metabolic disorders. It is presumed that the seizure
onset will vary according to the location of the pathology [11]. On the other hand, in the
absence of an established aetiology, it has been theorized that seizures originate as the result
of the interaction of multiple regions and that in reality there is no single seizure onset focus
(Figure 1.3).
There has also been some speculation about the function of subcortical structuresin ictal discharges (during seizures). For example, experiments in animal models have been conducted
showing that the thalamus can play a role in the regulation of temporal lobe seizures [11]. The
origin of seizures has also been studied using post-surgical resections and inpost-mortemcases pointing to hippocampal sclerosis (cellular loss, atrophy and proliferation of glial cells in the
hippocampus) as the most common TLE pathology. Other regions where abnormal changes
have been found are the amygdala and entorhinal cortex.
The detection of seizuresin vivois a clinical challenge that is currently being addressed by two important technologies: electroencephalography and neuroimaging.
1.1.2
Role of Electroencephalography
Encephalography is a technique that measures the electrical activity in the cortex using
elec-trodes placed on the scalp. EEG cannot record electrical activity from individual neurons for
two reasons: neurons are very small, and their signal is very faint. However, electrical
record-ings are still possible due to the fact that pyramidal neurons (one of the largest type∼20µm) are physically aligned, have the same polarity and many fire in synchrony (Figure 1.4).
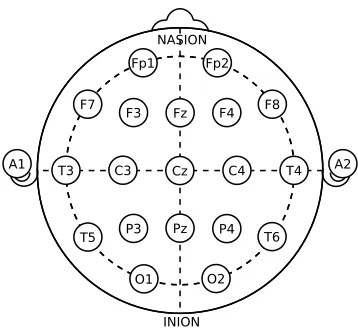
Electrodes are organized in an array covering the scalp, with the most common array being
the international 10-20 system (Figure 1.5). This array can be configured to measure voltage
differentials between electrode pairs (bipolar) or between each electrode and a common ground
(common reference). The interpretation of the results vary according to this configuration.
EEG plays an important role in the diagnosis of epilepsy. First, the presence of seizures
can be confirmed. It is estimated that between 4% and 10% of patients have psychogenic 4
-+ -+ + +
+ + +
-
- - -
-pial surface
EEG
electrode
Figure 1.4: EEG principle. The electrical field generated by similarly oriented pyramidal neurons can be detected by a scalp electrode. Pyramidal neurons possess a pyramidal-shaped soma and two distinct dendritic trees: apical and basal.
disorders instead of epilepsy [12], thus EEG can discriminate a psychogenic seizure from an
epileptic seizure by establishing a correspondence between the clinical semiology 5 and the
recorded EEG signals. Second, EEG can determine if seizures are generalized or focal, and it
can also help investigate whether the patient has a specific epilepsy related syndrome. These
findings can help determine a clinical course of action including specifying the type of AEDs
and determining whether the patient is a candidate for surgery.
Nevertheless, EEG has several limitations. During ictal periods, EEG readings are marred,
and signals from the scalp muscle, motion and electrode artifacts can limit interpretation [4].
Moreover, EEG has a low sensitivity for the detection of inter-ictal6epileptogenic discharges
(IED) in temporal lobe areas (between 29% and 58%) [12–14]. To increase the yield, more
Cz C4 T4 C3
T3
Pz Fz
T6
O2 T5
F7 F8
O1
Fp1 Fp2
F4 F3
P3 P4
A1 A2
INION NASION
Figure 1.5: 10-20 electrode array. T: temporal, F:frontal, Fp: frontal polar, C:central reference, O:occipital, P:parietal, z:midline; even numbers: right hemisphere, odd numbers: left hemisphere; na-sion: between the eyes above the bridge of the nose, inion: lowest point of the skull on the back of the head. Nasion and inion are landmarks for positioning of the array.
electrodes over the temporal region, also known as Silverman electrodes [15], can be added
to the standard 10-20 system. Another approach is long term monitoring, where waking and
sleeping inter-ictal readings are combined, increasing sensitivity to 80% [12].
Intracranial EEG
The implantation of subdural or deep electrodes is indicated when a patient is being considered
for surgery, and the readings of scalp EEG have been inconclusive. While scalp electrodes
capture small signals in the microvolt range, subdural electrodes record signals with a larger
amplitude between 10 mV to 20 mV, thus being more sensitive. Additionally, subdural
elec-trodes are less sensitive to muscle and motion artifacts, have a good temporal resolution and can
be placed in zones near the mesial temporal region to obtain more precise measurements
(Fig-ure 1.6). Despite being invasive, the recordings obtained with subdural electrodes are more
detailed and better localize seizures. Also, subdural readings can provide insight into cases
where scalp electrodes report bilateral ictal or inter-ictal abnormalities, or where the seizure
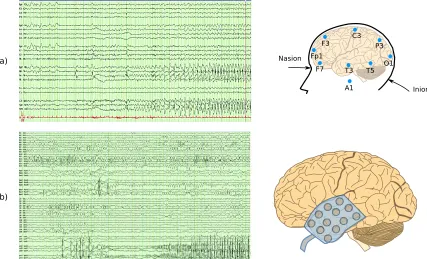
(a)
(b)
Fp1
F3 C3 P3
O1 T5 T3 F7
A1 Nasion
Inion
Figure 1.6:Temporal lobe seizure captured with EEG. a) seizure recorded using the traditional 10-20 system b) seizure recorded using subdural electrodes (24 channels per lobe). Subdural channels have better localization power but surgical implantation is required.7
1.1.3
Role of Imaging
Structural MRI
MRI measures how protons contained in tissue interact with external electromagnetic fields.
Such interaction is determined by the proton density (ρ), and the T1 and T2 magnetic properties
of tissue. Defined according to the orientation of the main magnetic fieldB0in the MR scanner,
T1 measures magnetic recovery along B0 (regrowth of longitudinal magnetization), while T2
measures magnetic relaxation orthogonal toB0(loss of transverse magnetization).
The type of imaging sequence and the particular set of acquisition parameters determine
the relative contribution of T1 and T2 to the image, generating T1-weighted, T2-weighted, or
proton density weighted images.
In the study of TLE, structural MR images allow for the identification of [16]:
7Adapted under the Creative Commons Attribution License from Epilepsy Research and Treatment 2012,
• Tumours: meningiomas, gangliomas (more common in children), low-grade astrocy-tomas, dysembrioplastic neuroepithelial tumours (DNET), and cavernomas.
• Hippocampal sclerosis: also known as mesial temporal sclerosis (mesial temporal scle-rosis (MTS)). The most common finding in patients undergoing surgery and also the
most common cause of partial complex seizures. MTS is characterized by apoptosis of
pyramidal neurons in the hippocampus (cornu ammonis and dentate gyrus), hippocampal
reorganization and changes in energy metabolism [17].
• Malformations of cortical development: focal cortical dysplasia (FCD) is one of the most common cortical developmental malformations. These correspond to groups of neurons
that failed to migrate to the proper formation in utero. Another cortical development malformation is tuberous sclerosis, a genetic condition causing benign tumoural growth.
(a)
(b)
hippocampus
ITG STG
MTG FG
PHG
Figure 1.7: Structural imaging in TLEThis figure shows a preoperative MR study for a patient with left mesial temporal sclerosis (indicated by yellow arrow). STG: superior temporal gyrus, MTG: middle temporal gyrus, ITG: inferior temporal gyrus, FG: fusiform gyrus, PHG: parahippocampal gyrus. a) Coronal T2-weighted image; b) FLAIR image.8
Fluid attenuation inversion recovery (FLAIR) is a sequence used to diagnose TLE. In
FLAIR images, cerebrospinal fluid (CSF) is nulled by selecting an inversion time, TI, such
8Adapted under the Creative Commons Attribution License from Epilepsy Research and Treatment 2012,
that T I = ln(T1CS F). This improves the detection of lesions in the boundary between gray matter and CSF(Figure 1.7).
The identification of lesions with structural MRI can determine the clinical course of
ac-tion: FCD and MTS patients frequently become drug-resistant, and these lesions are usually
removable with surgery. In contrast, neoplasms (tumours) usually respond well to AEDs [17]
and surgery is not always required. Likewise, the localization, extension, and type of lesion
determine whether or not it can be surgically removed.
In cases where MRI lesions are absent (also known as MR negative, or non-lesional)
neurol-ogists turn to subdural EEG, to confirm epileptogenicity. Placing subdural and deep electrodes
is invasive, has potential risks, and needs to be done with precision. Hence, MRI is used to
guide positioning, and to validate the anatomical distribution of electrodes.
MRI can also be a valuable post-surgical resource, to determine the reasons for operative
failure or complications, and to monitor the recurrence of lesions such as tumours.
Functional MRI
Functional MRI tracks local changes in blood flow in response to external stimuli (i.e. visual, auditory, verbal), and is used pre-surgically to identify eloquent regions in the cortex.9 This
is particularly important as language and memory areas commonly overlap with TLE lesions,
and during surgery these regions must be avoided to minimize cognitive deficits.
Traditionally, the localization of eloquent areas has been performed with the Wada test,
which consists of injecting sodium amobarbital into the carotid arteries, one hemisphere at
a time. This sedative has the effect of diminishing language and memory functions in the
hemisphere were is injected. During the test, the patient is engaged in a series of tasks to assess
memory and language functions, thus assessing these functions in the hemisphere that is not
anesthetized. This test is invasive with possible complications including stroke and death [18].
Though there has been a good agreement between Wada and fMRI studies, the
applicabil-ity of fMRI to language and memory mapping is an area of active research. For instance, it
9Theeloquent cortexrefers to regions in the cortex that, if removed, will result in loss of sensory perception,
has been speculated that neurological disorders, such as TLE, can modify networks that are
commonly activated in the healthy population therefore making current stimuli paradigms less
effective in the presence of such disorders [18, 19].
PET, SPECT and MRS
In addition to structural and functional findings, neuroimaging provides valuable diagnostic
information regarding abnormal brain metabolism and chemical composition. In this section
three imaging techniques are presented. Similar to structural and functional MRI, these
tech-niques have been used in the characterization and lateralization of lesions, being used
indepen-dently or jointly by clinicians to validate EEG and MRI findings. A good level of agreement
among techniques is usually correlated to better surgical outcomes. These techniques are: PET,
SPECT and MRS.
Positron emision tomography (PET) is a technique that generates images of metabolic
pro-cesses in the body, by employing positron-emitting radioisotopes attached to biologically active
molecules, also known asradiotracers.
A common radiotracer used in studying TLE is fluorodeoxyglucose (FDG)10which allows
the visualization of glucose metabolism. Reduced FDG uptake (glucose hypometabolism) has
been observed during inter-ictal periods in patients with TLE (Figure 1.8) [20, 21]. PET-FDG
is generally used in MR negative patients, or to analyze the spread of seizure patterns
pro-viding additional information for the placement of subdural electrodes. Moreover, PET has
a high specificity for MTS, as MTS is associated with hypometabolism in the hippocampus,
amygdala, entorhinal cortex and temporal pole [22]. Though not routinely employed, ictal PET
provides evidence of hypermetabolism in the epileptogenic zone with suppression of
metabol-ically activity in the surrounding areas [22, 23].
Single-photon emission computed tomography (SPECT) is similar to PET in that
radio-tracers are used to localize metabolic activity. Unlike PET, gamma photons are emitted
di-rectly by the radiotracer; therefore SPECT detects “single”-photons. SPECT radiotracers are
(a) (b)
Figure 1.8: PET-FDG. Visual assessment of the mean images of normalized FDG-PET across (a) healthy volunteers and (b) TLE patients, in Nelissen et al. study showing a striking hypometabolism in the fronto-parietal lobes in patients compared to control subjects.11
longer-lived and easier to manufacture which makes SPECT a more economical alternative
than PET. However, SPECT images have a much coarser resolution than PET.
Technetium-99m-hexamethylpropylene-amine-oxime (99mTc-HMPAO) [20, 24] is a SPECT radiotracer
used for measuring cerebral blood flow (perfusion). This radiotracer visualizes ictal
hyperper-fusion that remains some time post-ictally [23]. Thus, its injection right after a seizure can
help identify epileptogenic zones. The sensitivity of this method is increased by comparing
ictal against inter-ictal perfusion images [22].
Magnetic resonance spectroscopy (MRS) enables chemical composition analyses through
the study of MR spectra. In TLE, MRS is used to measure levels of N-acetylaspartate (NAA)
which is a marker of metabolic active neurons. Reduced NAA indicates neuronal loss and/or
metabolic dysfunction [17]. In contrast, creatinine (Cr) and choline (Cho) are present at higher
levels within glial cells in TLE patients. Nevertheless, MRS is not commonly used due to its
technical challenges and lack of widespread availability [22].
11Adapted from NeuroImage, 32 (2006), N. Nelissen et al.,Correlation of inter-ictal FDG-PET metabolism
and ictal SPECT perfusion changes in human temporal lobe epilepsy with hippocampal sclerosis, 648-695, c
1.1.4
Surgery: clinical challenges and current techniques
(a)
(b)
Figure 1.9: Temporal lobe surgerya) anterior temporal lobectomy (ATL); b) selective amygdalohip-pocampectomy (SAH). The first row shows the craniotomy, the second and third rows show the target tissue.12
EEG and imaging information are necessary for planning the surgical approach in those
patients that require it: between 15% and 30% of patients with focal epilepsy become drug
re-sistant [17] suffering uncontrolled seizures that diminish their quality of life. For them, surgery
is an option only if the epileptogenic focus has been clearly identified. Otherwise, invasive
sub-dural and/or deep electrodes are necessary to localize seizures. Nevertheless, when intracranial
EEG reveals multiple epileptic foci or provides insufficient information, temporal lobe surgery
cannot be performed, and in some cases sectioning the corpus callosum (corpus callosotomy)
is the only palliative measure available [17].
When surgery is viable, anterior temporal lobectomy (ATL) or selective
amygdalohip-pocampectomy (SAH) are performed, with the former being the most common. In ATL, the
12Reproduced under the Creative Commons Attribution License from Epilepsy Research and Treatment 2012,
anterior portion of the temporal lobe (including mesial structures) is resecteden-bloc, whereas in SAH, only the mesial structures (amygdala, hippocampus) are removed (Figure 1.9). SAH
can only be used when the seizure onset zone has been identified in the mesial temporal
re-gion only. Some risks associated with temporal lobe surgeries are motor, visual, language and
memory deficits, and an increased risk of depression and suicide [22]. However, success rate
is good, with low morbidity (about 11%) [22].
1.2
MRI research in Temporal Lobe Epilepsy
1.2.1
Quantitative Relaxometry
Quantitative relaxometry (Q-MRI) refers to the measurement of biophysical properties through
decoupling of the different contrast mechanisms that contribute to the overall MR signal [25].
T1- and T2-weighted images
Prior to delving into the acquisition of quantitative T1 and T2 maps, we will take a look at how
voxel intensities are determined in MRI. In spin echo sequences, the voxel intensity,S, can be characterized as:
S ∝ρ(1−exp [−T R/T1]) exp [−T E/T2] (1.1)
with the acquisition parameters, TR and TE, being the repetition and echo times respectively.
Short TR and short TE generate images where the intensity contribution from T1 is larger
(T1-weighted), whereas long TR and long TE produce images governed by the T2 parameter
(T2-weighted). On the other hand, the estimation of proton density weighted images (ρ) is
obtained by setting a long TR and a short TE. In Equation 1.1 a long TR makes the term
1−exp [−T R/T1] close to 1, and with a short TE, the term exp [−T E/T2] close to 1 as well, therefore making the signal proportional to proton density.
Acquisition parameter values are selected on the basis of improving radiological
abnor-malities. Thus, voxel intensities have meaning only with reference to other voxels and to the
amount of contrast they provide for visual inspection.
Obtaining quantitative T1 and T2 maps
T1 and T2 can be estimated by approximating the MR signal with exponential equations for
very long TRs (repetition times). For T1, after applying a 180◦inversion pulseand a long TR, thelongitudinal magnetization recovery Mzcan be modeled as:
Mz(t)= M0
1−2 exp
− t
T1
(1.2)
which can be linearized as:
ln "
1
2 1−
Mz(t)
M0
!#
=− t
T1 (1.3)
hence, T1 can be estimated as the the inverse of the logarithmic slope in Equation 1.3. As for
T2, after a 90◦RF pulse, and a long TR, thetransverse magnetic decay Mxycan be approximated as:
Mxy(t)= M0exp
− t
T2
(1.4)
and after algebraic manipulation presented as a liner form:
ln "
Mxy(t)
M0
#
=− t
T2 (1.5)
To obtain a line, a minimum of two measurements are needed. In terms of the MR sequence,
this means scanning for at least two echo times (TE). Though simple, these methods are not
widely used in clinical settings due to the lengthy scanning times: T1 mapping requires an
spin echo sequences13. Nevertheless, the opportunity of studying pathologies in terms of T1
and T2 properties has spurred interest to the development of time-efficient sequences.
Accelerated methods for T1 and T2 measurement
Possibly one of the most common methods to accelerate the acquisition of T1 maps is the
Lock and Locker method [26]. This method also requires an inversion pulse (180◦). After this
pulse, the recovery of longitudinal magnetization is measured with a train of very small-angle
RF pulses that disturb minimally the magnetization recovery along B0, making possible the
estimation of the magnetization recovery curve with only one inversion pulse [25, 27]. Another
method is the Driven Equilibrium Single Pulse Observation of T1 (DESPOT1) [28]. This
method uses a spoiled gradient recalled echo (SPGR) sequence to acquire images at several
small flip angles (α). The SPGR signal (SS PGR) can be written as:
SS PGR
sinα =
SS PGR tanα exp
−T R
T1
+ρ(1−exp
−T R
T1
) (1.6)
from which T1 can be calculated as a function of α. Thus, this method requires at least two
distinct flip angles (two SPGR images). An immediate consequence of this approach is that
the estimation will be only as good as the certainty of the assumed flip angle, meaning that
the uniformity of the RF field (B1) is a relevant factor. In this work we use the High-speed
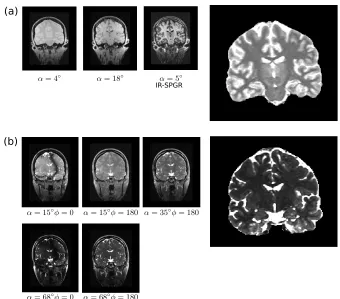
Incorporation of RF Field Inhomogeneities DESPOT1 or DESPOT1-HIFI, which adds an extra
sequence, a inversion recovery SPGR (IR-SPGR) used to improve the estimation of T1 and to
compensate for B1 inhomogeneities (Figure 1.10a). DESPOT1-HIFI allows a whole brain to
be scanned with a voxel size of 1mm3 in around 10 minutes [29].
Similar to the idea of a variable flip angle for the estimation of T1, a variable flip angle
fully balanced Steady State Free Precession (bSSFP) [30] can be used for the fast acquisition
of T2 maps. Like SPGR, SSFP is also a gradient echo sequence with small flip angles. Unlike
13In spin echo sequences measurable signals or,echos, are generated by refocusing the transversal
(b) (a)
IR-SPGR
Figure 1.10:Quantitative Relaxometry. a) Estimation of a T1 map using DESPOT1-HIFI; b) Estima-tion of a T2 map using DESPOT2-FM.
SPGR however, the repetition times in SSFP are very short, and there is no spoiling14because
we are actually interested in the transversal magnetization. With a very short TR (<10ms), the
RF pulses are close together and the MR signal will never completely decay, thus maintaining
phase coherence in the transverse plane. Collecting SSFP images over a range of flip angles
produces a signal curve that is function of both T1 and T2 [31]. Having obtained the T1 map
with any of the aforementioned methods, the estimation of the T2 map follows. This is the basis
for the DESPOT2 technique which is used in this work to estimate T2 maps (Figure 1.10b).
Ad-ditional methods to generate T2 maps using fast spin echo (FSE) and magnetization-prepared
sequences have also been reported in the literature [25].
Q-MRI has proven to be a sensitive imaging technique for the detection of TLE related
pathologies. T1 and T2 values appear increased in the temporal lobe, particularly in the
hemi-sphere containing the seizure focus. Additionally, a correlation between T2 hippocampal
perintensities and the presence of mesial temporal sclerosis (MTS) has been established [32–
35].
1.2.2
Di
ff
usion tensor imaging
Diffusion tensor imaging (DTI) enables the examination of morphological integrity in the brain
by analyzing how water molecules diffuse in tissue. This is particularly relevant for imaging
white matter where diffusion is restricted due to the myelin sheath around neuronal axons.
Imaging principle: diffusion weighted imaging
Water diffusion in tissue is measured using a modified spin echo sequence that is sensitive to
the Brownian motion of water, followed by a fast readout (echo-planar imaging). This kind of
imaging sequences are known asdiffusion weighted imaging(DWI).
In a spin echo sequence, spins are tipped onto the transverse plane using a RF pulse. After
the RF pulse is removed, spins start de-phasing and a refocusing RF pulse and gradient are applied to reverse this process and to obtain a signal during the readout time (echo time, TE).
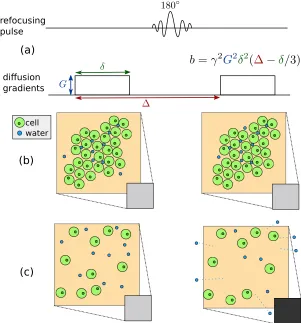
A pair of identical gradients, known asdiffusion gradients, can be added to the sequence: one immediately before the refocusing pulse and the other right after it (Figure 1.11a). The
pre-refocusing gradient changes the phase of spins in each voxel, and if there is no diffusion, the
post-refocusing gradient reverses this phase, canceling the effect of the first gradient. Thus,
during the readout, no net effect is recorded (Figure 1.11b). However, if there are free water
molecules in a voxel, these can leave the voxel at any time generating a measurable net effect in
phase when the post-refocusing gradient is applied. This effect is proportional to the free
mo-tion of these water molecules, or in other words to their diffusion (Figure 1.11c). The b-factor
controls the amount of contrast in DWI. The higher the b-value, the higher the contrast due to
diffusion. The b-factor depends of the shape and timing of the diffusion gradients employed as
(a)
(b)
diffusion
gradients refocusing pulse (c) cell water
Figure 1.11: Measuring diffusion. a) diffusion gradients. Theb-factor characterizes a diffusion se-quence and relates to the shape and spacing of the diffusion gradients; b) low diffusion: Brownian motion of water molecules is restricted and the net effect of the diffusion weighing is minimal; c) high diffusion: there is a drop in signal due to the free motion of water molecules outside of the voxel, which changes the net effect of the diffusion gradients.
The diffusion tensor
A robust three dimensional characterization of the diffusion process in every voxel can be
achieved by combining the information provided by the individual diffusion weighted images.
Each DWI describes the magnitude of the diffusion process in a particularspatial orientation
given by the gradients employed. This information can be encoded in thediffusion tensor:
D=
Dxx Dxy Dxz
Dyx Dyy Dyz
Due to the symmetry of the diffusion tensor (Di j = Dji) a minimum of 6 orientations (6 DWI) must be acquired. As more orientations are recorded, the estimation accuracy will
increase accordingly.
Technical considerations
Obtaining optimal diffusion weighted images greatly depends on the ability to generate strong,
rapid gradient pulses. However, when diffusion gradients are switched on and off, the resulting
time-varying magnetic field induces eddy currents in the scanner hardware [36] resulting in shift and shear distortions in the images. Thus, eddy-current correction must be addressed in
these images prior to the estimation of the respective diffusion tensors. Eddy-current
correc-tion may be implemented with a first-order affine transform to an undistorted, non-diffusion
weighted, reference volume of the same subject. Similarly, EPI-related artifacts can be
mini-mized with parallel acquisition techniques, and non-linear registration alternatives [36–38].
Mean Diffusivity and Fractional Anisotropy
An eigenanalysis of the diffusion tensor provides information on the three-dimensional diff
u-sion process occurring on each voxel level. The rate at which diffusion occurs is represented
by the mean diffusivity (MD), and it is defined as:
MD=(λ1+λ2+λ3)/3 (1.8)
whereλ1, λ2, λ3 correspond to the three eigenvalues of the diffusion tensor. High MD values
reflect regions where diffusion is unrestricted such as the ventricles. In contrast, the MD in
white matter is lower (Figure 1.12).
Another measurement of interest is the fractional anisotropy (FA) which indicates spatial
restriction in the diffusion process, ranging from 0 (isotropic diffusion) to 1 (ideal linear diff
a
b a b
MD FA
Figure 1.12: Mean diffusivity (MD) and fractional anisotropy (FA). a) water diffusion in the ven-tricles is unrestricted, thus MD is high and FA is low. b) water diffusion in the corticospinal tract is restricted by the myelin sheath covering the axon bundles, so the diffusion is highly anisotropic (high FA), while the MD image indicates that the overall diffusion is low.
FA=
r 3 2
s
(λ1− MD)2+(λ2−MD)2+(λ3−MD)2
λ2 1+λ
2 2+λ
2 3
(1.9)
White matter is characterized by its high FA, whereas diffusion is more isotropic in regions
containing CSF (Figure 1.12).
In the study of TLE, it has been shown that there is a pattern of ipsilateral FA loss in the
temporal white matter (uncinate fasciculus, arcuate fasciculus, inferior longitudinal fasciculus)
accompanied by MD increase in the hippocampus and temporal gray matter [39, 40] though
minor contralateral FA decline has also been reported [41].
MD and FA in the study of TLE
Similarly to Q-MRI studies, comparisons of DTI abnormalities between MTS and non-MTS
patients, have shown differences in morphological change patterns with MTS patients having
an increased ipsilateral MD signal in the hippocampus, parahippocampal gyrus and
frontopari-etal regions, while no MD alterations were found in non-lesional subjects [39, 42]. Similar
results have been obtained in FA analyses, where white matter abnormalities are more
1.3
Imaging Analysis Techniques
1.3.1
Region-of-interest techniques (ROI)
The analysis of regions of interest (ROI) in MRI images is one of the first computational
ap-proaches available for the study of TLE. These techniques rely on the expertise of a user to
perform manual or interactive segmentation [45–47], or in algorithms that employ anatomical
atlases to guide the segmentation [48–52].
Given that patients with MTS generally present loss of hippocampal gray matter, and often
loss of internal architecture ipsilateral to the lesional side, ROI techniques have focused on
assessing hippocampal volume [53], shape and pose [46, 54]. ROI methods have identified
volume reductions that are not detectable by visual inspection, thus increasing the detection
of hippocampal sclerosis in about 28% of patients [52]. Similarly, salient ipsilateral volume
reductions in the putamen, thalamus, amygdala, entorhinal and perirhinal cortices have also
been reported in TLE patients [45, 50, 55].
ROI techniques also examine regional mean intensities. T2 signal loss has been described
in the hippocampus, amygdala and thalamus and other temporal structures, mainly ipsilateral to
the seizure onset [34]. Likewise, ROI analyses of DTI-derived images, show bilateral reduction
of the FA signal in the hippocampus, parahippocampal, temporal white matter, frontal lobe
white matter, internal capsule, corpus callosum and brain stem ROIs, with predominance of
changes in mesial temporal lobe patients, particularly in the left MTS group [47, 50].
1.3.2
Voxel-based statistical techniques
The premise of voxel-based techniques is to establish a voxel-to-voxel correspondence among
subjects through non-linear image registration to a standard brain template. Once all images
are co-registered, differences can be obtained by performing voxel-wise statistical tests. The
majority of these techniques employ group-wise designs, with statistics revealing differences
among two subject groups. In the case of TLE, these groups are usually patients and controls;
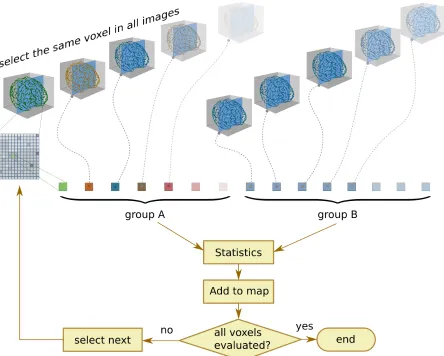
Figure 1.13:Voxel-based statistical techniques. These techniques rely on a good spatial normalization to compare groups of images at the voxel scale. A statistical map is obtained by performing voxel-wise statistics. A correction for multiple comparisons is usually implemented.
vs. patients with no MTS. Individual analyses are attainable by comparing one subject against
a group of healthy controls but these designs are limited as we will discussed in this section.
Voxel-based morphometry (VBM)
Voxel-based morphometry (VBM) [56] is a technique that detects local tissue differences in a
population by performing voxel-wise comparisons using T1-weighted images. In particular,
VBM detects changes in gray matter (GM), white matter (WM) and CSF. The standard VBM
method involves four steps: (i) spatial normalization to an anatomical template; (ii)
individual gyral anatomy; and (iv) statistical analysis [57].
An optimized VBM method has been proposed by Good et al. [58]. In this variation of
the technique, optimized spatial normalization parameters are acquired as follows: (i) the
orig-inal image is affine-registered to the anatomical template, and GM and WM segmentations
are obtained; (ii) The GM and WM segmentations are registered to the template generating
optimal normalization parameters which are then applied to the original image. The
ratio-nale behind this optimization is that in the original technique, scalp fat, dural venous sinuses
and other structures can be misidentified as gray matter voxels, hence, a registration driven by
pre-segmented GM and WM regions can be more accurate.
An additional step known as modulation is often included in optimized VBM. This step multiplies GM voxels by the Jacobian determinants which are estimated during spatial
normal-ization. This is to adjust GM volumes according to the spatial deformation undergone to match
the anatomical template. To illustrate, if one subject’s hippocampus has half of the volume of
that of the template, then its volume will be doubled during spatial normalization, consequently
doubling the number of voxels labelled as gray matter. Similarly, if another cortical structure is
twice the size of the respective structure in the anatomical template, then the number of voxels
will be halved after registration. Multiplying the registered volume by the Jacobian
determi-nant has the effect of preserving the total amount of gray matter, thus enabling the statistical
comparison of gray matter volumes.
Optimized VBM has been compared with standard VBM in the study of temporal lobe
epilepsy. It has been shown that optimized VBM delivers complimentary volume reductions
(modulated results) that match tissue concentration reductions (unmodulated results) identified
with the standard technique [59] and that it may reveal subtle changes in gray matter volume
that are not otherwise captured [60].
The most common TLE-related finding in VBM studies is the loss of gray matter in the
hippocampus ipsilateral to seizure onset, and in some cases contralaterally [53, 57] in MTS
patients. Other structures such as the thalamus, amygdala, parahippocampal gyrus
temporal gyrus, temporal pole and fornix have shown asymmetric changes with a predominant
GM loss ipsilaterally [57]. Gray matter loss has been more commonly found in MTS patients
than non-MTS patients [59]. Analogously, evidence of WM loss adjacent to mesial temporal
lobe (MTL) structures ipsilateral to seizure onset (and in some cases contralaterally) has been
reported in the literature [53].
VBM has also been used to detect focal cortical dysplasia on individual patients, in FLAIR
images [61], and in T1- and T2-weighted images [62]. In these studies, patient images are
compared individually against a group of healthy individuals, and the resulting statistical maps
are able to pinpoint the location of the FCD in most cases. Nevertheless, there is evidence
for not using VBM for individual patient assesments. VBM is not sufficiently sensitive to
detect focal pathology in individuals with relatively subtle brain changes [57], such as cortical
neuronal loss and hippocampal sclerosis [63] and, beyond the realm of TLE, it has been shown
that VBM is not an adequate stand-alone technique for detecting focal lesions [64].
Voxel-based relaxometry (VBR)
The idea of performing voxel-wise comparisons in a population has been extended to
quantita-tive relaxometry. This technique, known also as voxel-based relaxometry (VBR) [33], follows
a similar processing pipeline to the standard VBM technique, with the exception that there is
no segmentation. Instead, images are: (i) spatially normalized to a template; (ii) smoothed
us-ing a Gaussian kernel; and (iii) statistically analyzed. In VBR, spatial normalization occurs by
proxy of a T1-weighted or T2-weighted image: The transformation parameters obtained from
registering such an image to the anatomical template are applied to the quantitative maps. VBR
results are reported in terms of relaxation times(T1, T2), but it is also common to find stud-ies referring to relaxation rates(R1= 1/T1, R2= 1/T2). This distinction is relevant because depending on the convention employed, similar studies could appear contradictory.
VBR studies of TLE have shown significant T2 increases in the hippocampus,
amyg-dala, parahippocampal gyrus, anterior temporal white matter typically ipsilateral to seizure
(a)
(b)
Figure 1.14:VBM vs. VBR comparison. a) univariate analyses including: VBM on gray matter (VBM-GM), white matter (VBM-WM), and VBR; b) Joint multivariate analysis with Hotelling’sT2 statistic. It can be seen in (a) that VBR shows widespread changes, particularly in the temporal white matter, whereas changes in gray matter are observed in the hippocampus and thalamus among other regions with VBM. Notice also, the correspondence among the regions highlighted as univariate overlaps in (a) and the results of the joint multivariate analysis in (b).15
patients compared to non-MTS patients [34]. Unlike VBM, VBR results are not
tissue-specific: In VBR images are not segmented into tissue classes, and in this respect it might have
an advantage over VBM, where misclassification of voxels into tissue classes (scalp to
neocor-tex, or partial volumes in tissue boundaries) can affect subsequent statistical analysis. However,
VBM and VBR results can be complimentary. Particularly, in the study of patients with mesial
temporal sclerosis, VBM + VBR has produced regions where volumetric reductions are
no-ticeable (VBM), regions with characteristic hyperintensities (VBR), and regions where both
15Adapted from NeuroImage, 39 (2008), G. Pell et al., Composite voxel-based analysis of volume and T2
occur simultaneously, particularly in the hippocampus, amygdala and temporal white matter
(Figure 1.14) [35].
Voxel-based statistics of DTI-derived maps (VBS)
Approaches similar to VBR have been followed to compare DTI-derived images, such as FA
and MD maps. These studies are referred in the literature as voxel-based statistics (VBS),
VBS-type analysis, or voxel-based DTI, to make the distinction that the images being analyzed
do not describe magnetic relaxation processes. In my opinion, a more descriptive term such
as VBDA (voxel-based diffusion analysis) could be employed. However, in this section I refer
to these studies as VBS, for simplicity and to maintain the tradition of employing three-letter
acronyms.
Similar to VBR, spatial normalization in VBS occurs by proxy. In this case, the
non-diffusion weighted image (b-value=0) is used for registration to the anatomical template (or
the non-diffusion weighted average image in case of having acquired more than one). Then,
the calculated registration parameters are applied to the FA and MD images. After that, the
smoothing step is similar to VBM and VBR, with isotropic Gaussian kernel filters between
4mm [65] and 8mm [39, 42] full-width-at-half-maximum (FWHM).
VBS studies of TLE generally show a pattern of changes characterized by FA loss and
MD increase. More specifically, VBS has shown ipsilateral increase of MD in temporal and
extratemporal areas including the hippocampus, parahippocampal and frontoparietal regions;
and extensive temporal white matter changes in MTS patients (primarily in left TLE (L-TLE)
patients) [39, 42]. By comparison, no involvement of the mesial temporal structures was
iden-tified in non-MTS patients, but rather, an increase in thalamic MD has been reported [65]. In
addition, substantially decreased FA in temporal white matter has been reported, mainly
ipsilat-erally to the seizure onset but with some contralateral findings, and FA loss has been evidenced
in the thalamus for both MTS and non-MTS groups [39, 65].
Regarding comparison of voxel-based to ROI-based techniques, it has been shown that each
can be used in tandem to have a more comprehensive view of the pathological process under
examination [66, 67].
1.3.3
Structural analysis of white matter
Tract-based spatial statistics (TBSS)
Tract-based spatial statistics (TBSS) [12] is a method that aims to improve the two main
limita-tions of VBS analyses of FA: proper spatial normalization, and sensitivity to amount of spatial
smoothing. On the one hand, the spatial normalization employed by VBS does not guarantee
a perfect alignment of white matter fibers. For example, it has been shown that VBS studies
may report residual registration misalignments as FA reductions, particularly when there are
variations in ventricular sizes [68]. On the other hand, it has been shown that VBS-FA results
depend strongly on the amount of smoothing [69].
Briefly, TBSS has four steps: (i) registration of all subjects’ FA images to a common
tem-plate using non-linear registration. At this stage perfect alignment is not expected; (ii) creation
of a FA average image and extraction of a skeleton by removing non-maximal values, per-pendicularly to the local structure. Areas of low FA and/or high inter-subject variability are
removed also; (iii) projection of each subject’s aligned FA image onto the skeleton; and (iv)
voxel-wise statistics across subjects on the skeletonized versions of the respective FA maps.
Using the same method, it is also possible to project white matter MD maps onto the skeleton
for statistical analysis.
TBSS studies of temporal lobe epilepsy have shown general FA reduction in the corpus
callosum, thalamus, internal/external capsule, temporooccipital and fronto temporal
connec-tions [70]. Changes in the uncinate fasciculi are more prevalent in MTS patients compared to
non-MTS patients [44]. MD increases have been also been detected with TBSS in clusters of
temporal white matter predominantly ipsilateral to seizure onset [39, 70].
TBSS results have been compared to those obtained from VBS analyses showing that TBSS