Current results of the NOvA experiment
LiudmilaKolupaeva1,2, on behalf of the NOvA Collaboration
1Joint Institute for Nuclear Research
2Moscow State University
Abstract.NOvA is a long baseline neutrino oscillation experiment at Fermi National Ac-celerator Laboratory, USA. It is one of the so-called “off-beam-axis” experiments with two highly active detectors separated by 810 km of Earth’s crust. Both detectors are iden-tical and consist of PVC cells filled with a liquid scintillator. The NOvA collaboration has already published its first results for muon neutrino disappearance [1] and electron neutrino appearance [2] mode with data collected between July 2013 and March 2015. This talk is devoted to a discussion on NOvA’s first results.
1 Introduction
NOvA (NuMI Off-Axisνe-Appearance) is a long baseline neutrino oscillation experiment consisting of two functionally identical detectors, which have been placed 14 mrad off-axis. The NuMI (Neu-trinos at the Main Injector) facility at the Fermi National Accelerator Laboratory (USA) provides a muon (anti-)neutrino beam for the experiment. The neutrino beam, with a peak energy of 2 GeV, travels 810 km through the Earth’s crust to the Far Detector at Ash River (Minnesota). Muon neutri-nos may oscillate to electron or tau neutrineutri-nos as they propagate. The NOvA detectors can measure the transition probabilitiesP(νμ → νe) andP(νμ → νμ). From these measurements NOvA is able to extract oscillation parameters:Δm2
32, mixing angleθ23, CP violating phaseδCPand neutrino mass
hierarchy.
NOvA published its first results [1], [2] this year. These results are based on data collected between July 2013 and March 2015. More data and results will be presented at the Neutrino 2016 summer conference.
2 The NOvA experiment
Neutrinos are created by colliding 120 GeV protons with a carbon target. Theπ and K mesons produced will decay into a neutrino and an associated lepton. The 4.2m×4.2m×15m near detector is located at a distance of about 1km from the target and has mass about 300 t. It is used for measuring the neutrino flux composition before oscillations. The far detector is located at a distance 810 km. It has dimensions of 15.6m×15.6m×60m with a mass of 14 kt. It is responsible for measuring neutrino oscillations. Both detectors are placed 14 mrad offof the neutrino beam axis. Such a scheme helps to obtain narrow energy spectra near the first oscillation maximum and suppresses the high energy tail.
The NOvA detectors are huge tracking calorimeters with excellent segmentation. They consist of many PVC cells (6 cm×4 cm) filled with mineral oil liquid scintillator with 5% admixture of pseudocumene. These cells are constructed in alternate planes, thus NOvA can measure the vertical and horizontal position of an event. The number of cells in the far and near detector are 344 054 and 21 192 respectively. Each cell contains a wavelength-shifting fiber loop with 32-pixel avalanche photodiods used for readout.
The NOvA detectors were under construction during the first analysis data taking period, from July 2013 to March 2015. During this period 3.45×10²⁰ POT were delivered to the carbon target.
Because the NOvA Far detector size was not constant during this period the NOvA data should be matched to 2.74×10²⁰POT-14-ton-equivalent.
3 The
ν
μDisappearance Results
TheνμDisappearance mode is sensitive toθ23andΔm223 measurements. During the first analysis
pe-riod NOvA detected 33νμCC events instead of the 211.8±12.5 events expected under non-oscillation hypothesis. It is a clear observation of muon neutrino oscillations. The oscillation parameter extrac-tion procedure is based on measured spectra in both detectors. Spectra from the Near Detector (Figure 1) is extrapolated to the Far detector and this prediction is compared with far detector measurements. The extrapolation procedure is discribed in Figure 2. Figure 3 shows the final measured far detector neutrino spectra.
Expected background events for the NOvA disappearance analysis are 2 neutral current and 1.4 cosmic ray events. Main systematic contributions are due to Calorimetric Energy Calibration, Muon Energy Scale etc. Total systematic uncertainty for sin2θ23is 6.8 % andΔm232is 3.7 %.
The best fit oscillation parameters are:
Δm2
23=2.52+0−0..2018×10−3eV2 0.38<sin2θ23<0.65 (68% CL) (for normal hierarchy) Δm2
23=−2.56±0.19×10⁻³eV2 0.37<sin2θ23<0.64 (68% CL) (for inverted hierarchy)
Allowed regions for oscillation parameters in comparison with other experiments measurement are shown in the Figure 4.
4 The
ν
eAppearance Results
Reconstructed Neutrino Energy (GeV)
0 1 2 3 4 5
)
3
Events (x10
0 20 40 60 80 100
Simulated Selected Events Simulated Background Data
POT
20
10
×
ND, 1.66
Figure 1.Near Detector spectra, which is used in extrapolation and prediction spectra in Far Detector.
Figure 2. Extrapolation procedure with measured near detector spectra. Measured near detector spectra con-verted to true energy is multiplied by far-to-near detector ratio and oscillation probability. Calculated far detector true energy spectra are converted to reconstructed energy spectrum.
References
[1] P. Adamsonet al.[NOvA Collaboration], Phys. Rev. D93, no. 5, 051104 (2016) [2] P. Adamsonet al.[NOvA Collaboration], Phys. Rev. Lett.116, no. 15, 151806 (2016) [3] P. Adamasonet al., Phys. Rev. Lett. 112, 191801 (2014)
[4] K. Abeet al., Phys. Rev. D 91, 072010 (2015) [5] F. P. Anet al., Phys. Rev. Lett.115, 111802 (2015) [6] Y. Abeet al., JHEP141086 (2014)
Reconstructed Neutrino Energy (GeV)
0 1 2 3 4 5
Events / 0.25 GeV
0 10 20 30 40 50 Data Unoscillated prediction Best fit prediction (no systs)
syst. range σ Expected 1-Best fit prediction (systs) Backgrounds Normal Hierarchy POT-equiv. 20 10 × 2.74 =19.0/16 dof /N 2 χ Best fit
Figure 3.This figure shows the Far Detectorνμenergy
spectra. The green line represents the non-oscillated energy spectra with an expected 211.8 events. NOvA observed 33νμ
CC events.
23
θ
2
sin
0.3 0.4 0.5 0.6 0.7
) 2 eV -3 (10 32 2 m Δ 2.0 2.5 3.0 3.5
Normal Hierarchy, 90% CL A
ν
NO T2K 2014 MINOS 2014
Figure 4.90% C.L. contour for normal hierarchy on the surface sin2θ
23andΔm232
along with MINOS [3] and T2K [4] results. This plot shows good agreement.
POT 20 10 × 200 300 400 500 A Preliminary ν NO LID ND Data
(Flux + stat. uncert.) Total MC e ν MC Beam MC NC CC μ ν MC
Figure 5.Near Detector LID spectra used forνe
Calorimetric energy (GeV)
1 1.5 2 2.5 3
Events / 0.25 GeV
0 0.5 1 1.5 2 POT-equiv. 20 10 ×
2.74 FD data
Signal prediction
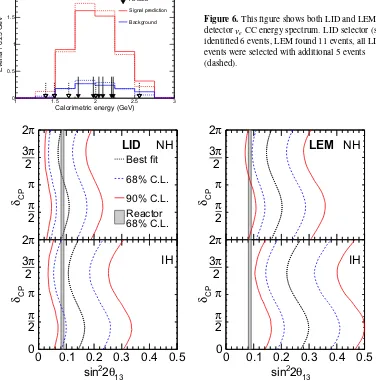
Background Figure 6.This figure shows both LID and LEM far detectorνeCC energy spectrum. LID selector (solid)
identified 6 events, LEM found 11 events, all LID events were selected with additional 5 events (dashed).
0
0.1 0.2 0.3
0.4 0.5
CP
δ
CPδ
13θ
2
2sin
0
2
π
π
2
π
3
π
2
2
π
π
2
π
3
π
2
LID
Best fit 68% C.L. 90% C.L. 68% C.L. ReactorNH
IH
0
0.1 0.2 0.3
0.4 0.5
CP
δ
CPδ
13θ
2
2sin
0
2
π
π
2
π
3
π
2
2
π
π
2
π
3
π
2
LEM
NH
IH
Figure 7.68% and 90% C.L. regions for LID and LEM selectors in sin22θ13andδCPsurface in comparison with
rector neutrino experiment data. The top panel is normal and the bottom is inverted hierarchy. sin2θ
23 =0.5
CP δ
Significance
0 π/2 π 3π/2 2π
0
σ
1
σ
2
σ
3
σ
4
σ
5
90%
NH LID NH LEM IH LID IH LEM
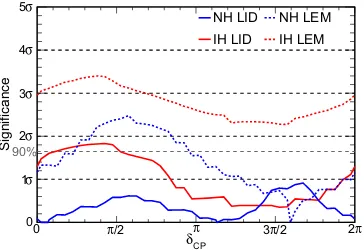
Figure 8.Significance for normal (blue) and inverted (red) neutrino mass hierarchy for all values ofδCP. Both
LEM and LID selectors are represented.
Table 1.Expected background forνeanalysis

![Figure 4. 90% C.L. contour for normalhierarchy on the surface sin2 θ23 and Δm232along with MINOS [3] and T2K [4] results.This plot shows good agreement.](https://thumb-us.123doks.com/thumbv2/123dok_us/8155331.1360272/4.482.41.241.293.599/figure-contour-normalhierarchy-surface-minos-results-shows-agreement.webp)