RECENT AND FUTURE EFFICIENCY OF THE NEW
SUEZ CANAL PORTS PROJECT USING
DEA-MODELS
Dr. Elsayed Ayman
1
Associate Professor of Harbors Engineering and Marine Structures
Faculty of Engineering, Ain-Shams University
ABSTRACT
The main aim in this research is to transform the corridor of the new Suez canal hub to be a pioneer zone in maritime transport industry in the world and to make it a kernel for a future industrial zone around the Suez passage. The vision is for Egypt to play a more important role in the global trade system and in supply chain management. The seaborne trade constitutes 80-90% of global trade volumes and 70-80% of global trade value. Such huge shares of world trade volumes and values are considered alone a major asset in developing the region.
This was done by applying Data Envelopment Analysis (DEA) method in measuring and analyzing the efficiencies of the New Suez canal ports projects. DEA window analysis is used to determine the recent and the future efficiency of the ports and to observe the possibility of changes in the port efficiency over time.
The research was conducted to evaluate the efficiencies of ports on the territory of Egypt in order to identify the sources of inefficiencies and formulate proposals for improving the services of those ports and their operations through a four-year window analysis with port efficiency trends and average efficiencies. The progress is made in the measurement of port efficiency in relation to port productive activities - total area of ware-houses, quay lengths and port throughput, for the developed new Suez canal ports..
Keywords: New Suez canal ports, total area of warehouses, quay lengths, port throughput, port
efficiency, DEA window analysis
I. INTRODUCTION
Maritime transport was and currently is the backbone of development for many countries, (Banker, R. D.,
Charnes, A. and Cooper, W. W. ) [1]. It related the knowledge of the old era with the newest knowledge of the
modern world. Water transportation played a key role in human life since ancient times when mankind inspired
with instinct developed different devices in this domain starting with piloting boats manually and ending with
Fig.1.1:The Suez canal six ports project
II.
PORT PRODUCTION MEASUREMENT
2.1 Importance efficiency measurement of ports
The weaknesses in management of ports authority are the lack of efficiency measurement methodology that
likely retards port adoption of new methods and cost excesses. Efficiency measurement an important aspect for
ports to evaluate their actual objectives against predefined goals and to make sure that the ports are doing well in
the competitive environment. Nevertheless, efficiency measurement is not without any disadvantages.
Efficiency measurement enables managers to make decisions based on facts rather than on assumptions and
faith [2]. Therefore efficiency measurement has become an integral part of planning and controlling ports. For
competitive maritime transport, there is a critical need for management actions to continuously improve the
port's efficiency. In the long term, success of both individual seaport and the maritime transport overall will
depend on improving efficiency by continually acquiring and applying new knowledge. Measurement aims at
comparing the efficiency of port relative to each other, allowing this port to recognize their weaknesses and
strengths compared to the industry. Measurement aids in the identification of leaders who exhibit superior
efficiency measurement as a result of using best maritime transport practices. By finding examples of superior
performance, ports can adjust their policies and practices to improve their own efficiency and become more
similar to efficiency leaders in the maritime transport [3]. Efficiency measurement assists managers in staff
allocation based on activities' level and determines where excess resources are being utilized.
2.2 The Master plan of the recent and the future planned ports
The new Suez canal Hub possesses six ports, for every port there is the recent plan and the future developed
2.2.1The east Port said port
Fig.2.1 The water area of East Port said port Fig.2.2 The land area of East Port said port
2.2.2 The west Port said port
2.2.3 The Adabia port
Fig.2.5 The water area of Adabia port Fig.2.6 The detailed elements of Adabia port
2.2.4 The Sokhna port
2.2.5 The Alarish port
Fig.2.9 The recent master plan of Alarish port Fig.2.10 The future master plan of Alarish port
2.2.6 The TUR port
III. RESEARCH METHODOLOGY
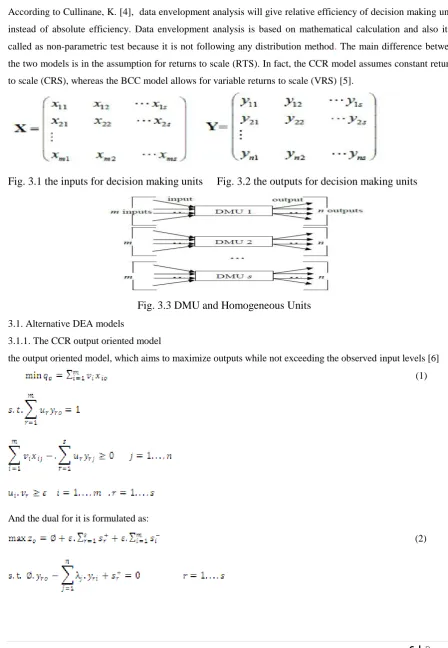
This conversion is based on the inputs and outputs for its decision making units (DMU) as show in Fig. III.1.
According to Cullinane, K. [4], data envelopment analysis will give relative efficiency of decision making units
instead of absolute efficiency. Data envelopment analysis is based on mathematical calculation and also it is
called as non-parametric test because it is not following any distribution method. The main difference between
the two models is in the assumption for returns to scale (RTS). In fact, the CCR model assumes constant returns
to scale (CRS), whereas the BCC model allows for variable returns to scale (VRS) [5].
Fig. 3.1 the inputs for decision making units Fig. 3.2 the outputs for decision making units
Fig. 3.3 DMU and Homogeneous Units
3.1. Alternative DEA models
3.1.1. The CCR output oriented model
the output oriented model, which aims to maximize outputs while not exceeding the observed input levels [6]
(1)
And the dual for it is formulated as:
Fig.3.4 DEA - CCR-output model Fig.3.5 DEA - BCC-output model
3.1.2.
BCC output oriented modelThe objective in BCC-O is to maximize the output production while not exceeding the actual input level[7].
(3)
3.2. Returns to Scale Evaluation and Scale Efficiency
Total technical efficiency (TTE) = Xj / Xd
Pure technical efficiency (PTE) = Xw / Xd
Fig.3.6 Constant, variable, non-increasing returns to scale, Technical and Scale Efficiency
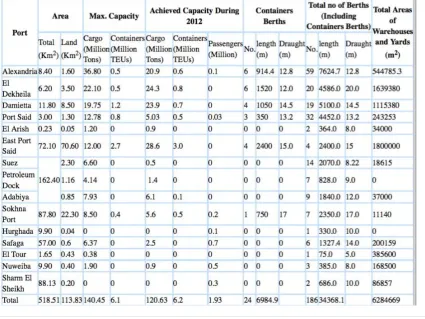
IV. PREPARING THE CROSS SECTION DATA FOR THE EFFICIENCY ANALYSIS
The data collection process is an integral part of the research design and it aims to collect accurate and reliable
data using different sources, such as interviews and observations, six sources for data collection using a case
study strategy. These are documentation, archival records, interviews, direct observation and participant
observation. The Maritime transport sector, the Red sea ports authorities and the Port said port authorities
provided to the research statistical data available for the containers and cargo handling for all the developed six
ports under research as shown in the following table 4.1 for 2012 as an model for the cross section input data
used.
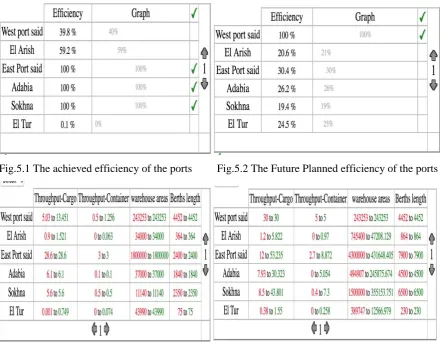
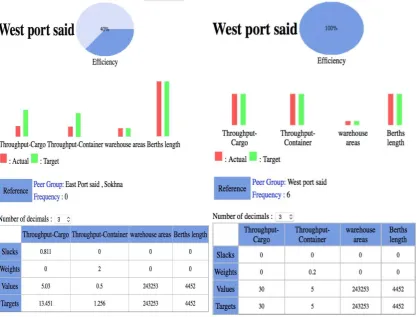
V. THE EFFICIENCY ANALYSIS OF THE SIX PORTS USING DEA- MODELS
Based on the results from the software used, open source DEA for researches and operational research folks.
The first case is the achieved efficiency case, the average efficiency of the six ports for general cargo and
containers, according to the models of DEA-CCR (average efficiency value) are 40, 59, 100,100,100 and 0 %,
represented the efficiency in terms of the usage of input resources thus indicating that they would need to
improve their usage of input resources. The efficiency score of the West Port said , El Arish, and El Tur ports
is less than 1 or 100% , it reflects that this ports is inefficiency. The efficiency score of the other ports, the East
Port said, the Adabia and the Sokhna is efficient ports and can be all represent as a frontier for the other ports.
The second case is the developed future plan of the six ports, the average efficiency of the six ports for general
cargo and containers, according to the models of DEA-CCR (average efficiency value) are 100, 21, 30, 26,19
and 25 %, represented the efficiency in terms of the usage of input resources thus indicating that they would
need to improve the output by increasing the throughput to be efficient in the future. The efficiency score of the
El Arish, the East Port said, the Adabia, the Sokhna and El Tur ports is less than 1 or 100% , it reflects that this
ports are inefficiency. The efficiency score of the East Port said is 100% or 1 and it will be the frontier for the
other ports in the future case.
Fig.5.1 The achieved efficiency of the ports Fig.5.2 The Future Planned efficiency of the ports
Table 5.5 The achieved efficiency of the ports Table 5.6 The Future Planned efficiency of the ports
table 5.7 The achieved efficiency of the ports Table 5.8 The Future Planned efficiency of the ports
VI. CONCLUSIONS AND RECOMMENDATIONS
Measuring the relative efficiency of the new Suez canal ports, data envelopment analysis has been used. The
research had applied radial - output oriented (DEA-CCR) for measuring the relative efficiency of the new Suez
terminal area, storage , length of berths and output variables are considered in this study is containers and
Cargos throughput.
Based on the analysis results, In the first case (the recent achieved efficiency) the highest efficiency from the
East Port said, the Adabia and the Sokhna ports had achieved , so efficiency curves for this ports takes as
frontier curves for the other ports, and thus for the recent time the other ports must be increased its throughput.
In the second case (the future planned of the six ports ) only the West port said port is the efficeint one, and will
be the forntier of the others. This is clear as the other five ports had a big input resourses in the future than it,
then it must be increased the throughput of this five ports to be efficeint ones too.
REFERENCES
[1] Banker, R. D., Charnes, A. and Cooper, W. W. (1984). Some models for estimating technical and scale
inefficiencies in data envelopment analysis, Management science, 30(9), 1078-1092.
[2] Cooper, W. W., Seiford, L. M. and Tone, K. (2007). Data Envelopment Analysis, A Comprehensive Text
with Models, Applications, References and DEA-Solver Software, Second Edition, Springer, ISBN,
387452818, 490.
[3] Cullinane, K., Fei, W. T. and Cullinane, S. (2004). Container Terminal Development in Mainland China
and Its Impact on the Competitiveness of the Port of Hong Kong, Transport Reviews, 24(1), 33-56.
[4] Roll Y. and Hayuth, Y. (1993). Port performance comparison applying data envelopment analysis (DEA),
Maritime Policy and Management, 20(2), 153-161.
[5] Valentine, V.F. and Gray, R. 2001. The Measurement of Port Efficiency Using Data Envelopment
Analysis, Proceedings of the 9th World Conference on Transport Research.
[6] Yun, L., Ji, C., Li, Q. and Li, D. (2011). Comprehensive efficiency measurement of port logistics—study
based on DEA two-stage relative evaluation, Journal of System and Management Sciences, 1(4), 1-18. 177
22-27 July, Seoul, South Korea.
[7] Al-Eraqi, A, S., Mustafa, A., Khader, A, T., and Barros, C, P.: Efficiency of middle Eastern and East
African seaports: application of DEA using Window analysis, European Journal of Scientific Research,