Research on Primary Shielding Calculation Source Generation
Codes
Zheng Zheng1,*, Qiliang Mei1, Hui Li1, Danhua Shangguan2, Guangchun Zhang2
1
Shanghai Nuclear Engineering Research and Design Institute Hongcao Road No. 29, Shanghai, China 2
Institute of Applied Physics and Computational Mathematics Fenghao East Road No. 2, Beijing, China
Abstract. Primary Shielding Calculation (PSC) plays an important role in reactor shielding design and analysis. In order to facilitate PSC, a source generation code is developed to generate cumulative distribution functions (CDF) for the source particle sample code of the J Monte Carlo Transport (JMCT) code, and a source particle sample code is deveoped to sample source particle directions, types, coordinates, energy and weights from the CDFs. A source generation code is developed to transform three dimensional (3D) power distributions in xyz geometry to source distributions in r z geometry for the J Discrete Ordinate Transport (JSNT) code. Validation on PSC model of Qinshan No.1 nuclear power plant (NPP), CAP1400 and CAP1700 reactors are performed. Numerical results show that the theoretical model and the codes are both correct.
1 Introduction
Primary shielding is composed of in-core internals surrounding the core (including baffle and barrel), water (including water between baffle and barrel, and water between barrel and Reactor Pressure Vessel (RPV)), and RPV and concrete surrounding RPV. PSC plays an important role in evaluating the radiation dose of personnel, insuring the safety of RPV and reactor internals during the whole lifetime, and preventing the concrete shielding as well as the outer components and structures from an excess of activation. PSC mainly consists of the following steps: (1) determine the core neutron and photon sources, (2) perform neutron and photon transport calculations, (3) derive the dose rate, heating rate and displacements per atom (DPA) etc. by multiplying response functions with fluence rates.
Both the Monte Carlo method and the Discrete Ordinate method are usually adopted to perform neutron and photon transport calculations. JMCT[1] is a 3D neutron-photon transport Monte Carlo code developed by Institute of Applied Physics and Computational Mathematics (IAPCM). JMCT provides a source particle sample code for user to define space, energy, direction and weight for source particles. JSNT[2] is a 3D neutron-photon transport Discrete Ordinate code developed by IAPCM.
In order to facilitate PSC, we develop a source generation code and a source sample code for JMCT, as well as a source generation code for JSNT. Both the CDFs of source particles for JMCT and 3D source distributions of each mesh for JSNT are calculated using 3D power distribution, fission fraction, fission spectrum, number of particles and energy released per fission etc. We apply the source codes on PSC model of Qinshan
No.1 NPP, CAP1400 and CAP1700 reactors, with the aim to validate the source codes, and analyse the effects of the variations of fuel assembly burnup and enrichment on the fluence rates.
2 Theoretical Model
2.1 JMCT source generation and sample methods
Firstly, the probability density functions (PDF) and CDF of source particles are calculated using 3D power distribution, fission fraction, fission spectrum, number of particles and energy released per fission etc. Secondly, source particle directions, types, coordinates, energy and weights are sampled from the CDFs.
2.1.1 Cumulative distribution functions calculation
The energy PDF of the mth assembly is:
'
1
( ) '
1 1
'( , ', )
'( , ) ( , ) ( , ', ) ( ', )
'( , ) ( , ) ( , , ) ( , )
N
n
G p N
n g
m g p
f m n n p n g p T g p
f m n n p n g p T g p
(1)
Where , 'g g is energy index, m is assembly index, n is the fission nuclide index, p is the particle type index, p=1 is neutron, p=2 is photon,N' is the number of nuclides, '( , ', )m g p is the PDF of particle p, group
'
particles released per fission for particle p and nuclide
n, particles/s, ( , , )n g p is the probability of particle p, group g and nuclide n, G p( ) is the number of groups for particle p, T g p( , ) is the energy bias factor for particle p and group g.
The energy CDF of the mth assembly is:
'' ( ) ' 1
1
'( , ', )
( , '', ) , '' 1,..., ( )
'( , , )
g G p g
g
m g p
E m g p g G p
m g p
(2)
Where E m g p( , '', ) is the CDF of particle p, group ''
g and assembly m.
The space PDF of the qth mesh is:
( ) ' 1 1 ( , , , ) ' '( ) ( , , ) '( ) '( , ) ( , ) ( , , ) ( , ) G p N n gS i j k p C B m P i j k
K m
f m n n p n g p T g p
(3)
Where S i j k p( , , , ) is the source of particle p and mesh ( , , )i j k , particles/(cm3·s), P i j k( , , ) is the power of mesh ( , , )i j k , W/cm3, C' is unit conversion factor, 6.241508×10¹²MeV/(s·W), B m'( ) is the space bias factor of assembly m, K m'( ) is the energy released per fission of assembly m, MeV.
'( , )
f m n and K m'( ) can be calculated by
interpolation from library by assembly burnup and enrichment. The library includes fission fraction and energy released per fission of 6 fission nuclides (U-235, U-238, Pu-239, Pu-240, Pu-241 and Pu-242) with 25 burnups and 5 enrichments.
The space CDF of the qth mesh is:
' 1 '' 1
'( ', ) '( ')
( , ) , 1,...,
'( '', ) '( '')
q Q q
q
S q p V q
D q p q Q
S q p V q
(4)
Where D q p( , ) is the CDF of particle p and mesh q,
'( ', )
S q p is the source of particle p and mesh q' , particles/(cm3·s), V q'( ') is the volume of mesh 'q , cm3,
Q is the number of mesh.
The number of the pth particle is:
, ,
( ) i j k ( , , , ) '( , , ) ( )
N p
S i j k p V i j k R p (5) Where N p( ) is the number of particle p,V i j k'( , , )is the volume of mesh ( , , )i j k , cm3, R p( ) is the particle type bias factor of particle p.
The particle type CDF of the pth particle is:
' 1 '' 1
( ')
( ) , 1,...,
( '') p P p p N p
F p p P
N p
(6)
Where F p( ) is the particle type CDF of particle p,
P is the number of particle types.
Directions of neutrons and photons released in fission are isotropic, which can be determined using isotropic sample subroutine.
Before the biased PDFs and CDFs are calculated, the bias factors should be normalized as follows:
( ) ( ) 1 ' 1 '( , ) ( , ) ( ), ( , ) ( ) '( ', ) G p G p g g
T g p
T g p G p T g p G p
T g p
(7) 1 1 ''( ) '( ) , '( ) ''( ) M M m m B m
B m M B m M
B m
(8) 1 1 '( ) ( ) , ( ) '( ) P P p p R pR p P R p P
R p
(9)
Where T g p'( , ) is the un-normalized energy bias factor for particle p and group g , B m''( ) is the un-normalized space bias factor of assembly m, R p'( ) is the un-normalized particle type bias factor of particle p,
M is the number of assembly.
2.1.2 Source particle sample method
Considering the dependent relationship of variables, the source particle sample sequence is the reverse of the CDF calculation sequence, which is: direction, particle type, space and energy.
Directions are determined by isotropic sample. For particle type, select random numberp(0,1], determine index p which satisfiesF p( 1) pF p( ).
For space, select random number q (0,1] ,
determine index q which satisfies
( 1, ) q ( , )
D q p D q p . Select random number
1, 2, 3 (0,1]
q q q
, calculate particle coordinates as
follows:
1 2 1
1
1 2 1
2
1 2 1
3
( )
( )
( )
q q q q q q q q q q q q
x x x x
y y y y
z z z z
(10)
Where x y z, , are particle coordinates, cm, x x1q, 2q are
lower and upper boundary of mesh q along axis x, cm,
1 2
,
q q
y y are lower and upper boundary of mesh q along axis y, cm, 1 2
,
q q
z z are lower and upper boundary of mesh
q along axis z, cm.
For energy, select random number g(0,1] ,
determine index g which satisfies
( 1, , ) g ( , , )
E g q p E g q p . Select random number
1 (0,1]
g
, calculate particle energy as follows:
1 2 1
1
' g g ( g g)
E E E E (11)
Where E' is particle energy, MeV, 1 2
,
g g
E E are lower and upper boundary of group g, MeV.
†
'
( ) '( ) ( , ) ''
w N
w
R p B m T g p N
(12)
Where w' is biased weight, w is unbiased weight, †
N is the number of biased particles, N'' is the number of unbiased particles.
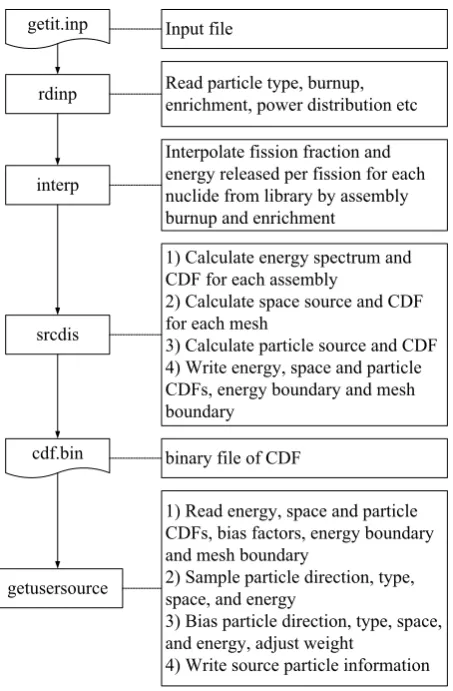
Based on the CDF calculation method and source particle sample method above, a source generation code and a source sample code for JMCT are developed. Fig. 1 shows the flowchart of the source codes.
rdinp getit.inp
interp
Read particle type, burnup, enrichment, power distribution etc Input file
Interpolate fission fraction and energy released per fission for each nuclide from library by assembly burnup and enrichment
srcdis
1) Calculate energy spectrum and CDF for each assembly
2) Calculate space source and CDF for each mesh
3) Calculate particle source and CDF 4) Write energy, space and particle CDFs, energy boundary and mesh boundary
cdf.bin binary file of CDF
getusersource
1) Read energy, space and particle CDFs, bias factors, energy boundary and mesh boundary
2) Sample particle direction, type, space, and energy
3) Bias particle direction, type, space, and energy, adjust weight
4) Write source particle information
Fig. 1. Flowchart of CDF calculation and source particle sample for JMCT
2.2 JSNT source generation method
Firstly, the pin mesh source is calculated using 3D power distribution, fission fraction, fission spectrum, number of particles and energy released per fission. Secondly, the geometry mesh source is calculated using the pin mesh source by the area or volume weighted method.
The pin mesh source is calculated as follows:
†
'
1
''( , , , ) ( , , ) ( , )
' '( )
( , , ) '( , ) ( ) ''( , )
'( )
N
n
S i j k g P i j k C m g C B m
P i j k f m n n n g
K m
(13)
Where S i j k g''( , , , ) is the source of group g and pin
mesh ( , , )i j k , particles/(cm3·s), C m g†( , )is power to
source transform factor, particles/s/MW, ''( , )n g is the probability of group g and nuclide n.
The geometry mesh source is calculated as follows:
(a) axial mesh
(b) radial mesh
Fig. 2. Geometry transformation sketch map
rdinp getit.inp
interp
Read particle type, burnup, enrichment, power distribution etc Input file
Interpolate fission fraction and energy released per fission for each nuclide from library by assembly burnup and enrichment
powsrc Calculate power to source transform
factor for each group and assembly
src.bin binary file of 3D source distribution srctrans
1. Calculate pin mesh source and work mesh source for each group 2. Calculate geometry mesh source for each group
1) Define a group of r z work mesh, for each work mesh, set the source of the work mesh equals to the source of pin mesh if the center of the work mesh lies in the pin mesh.
2) As Fig. 2 and Formula (14) show, calculate the source of each geometry mesh by the area or volume weighted method.
' '
( ', ) ( , ) '( ) '( )
q q q q
S q g S q g V q V q
(14)
Where S q g( ', ) is the source of group g and
geometry mesh 'q , particles/(cm3·s), S q g( , ) is the source of group g and work mesh q, particles/(cm3·s).
Fig. 3 shows the flowchart of the source generation code for JSNT.
3 Numerical Results
We perform validation on PSC model of Qinshan No.1 Reactor, and apply theses codes on CAP1400 and CAP1700 reactors.
3.1 Qinshan No.1 reactor surveillance capsule Fast Neutron Fluence Rate (FNFR) calculation
Qinshan No.1 Reactor is a 966MW (thermal power) pressurized light-water reactor (PWR) designed by Shanghai Nuclear Engineering Research and Design Institute (SNERDI) of China and placed in operation in December of 1991. It is owned by China National Nuclear Corporation Company (CNNCC) and operated by Qinshan Nuclear Power Limited Company (QNPLC). The core of the Qinshan No.1 Reactor consists of 121 assemblies and is surrounded by the core baffle, barrel, pressure vessel, and biological shield. According to the requirement of RPV material radiation surveillance program, Qinshan NPP shutdowns the reactor on June 6 of 2014 (end of the 15thfuel cycle), and removes the 6th radiation surveillance capsule (8 in total). The FNFR of this capsule is important for the RPV radiation evaluation. China Institute of Atomic Energy (CIAE) extracts samples from dose box of surveillance capsule, measures the activation, and calculates the neutron fluence rate for energy greater than 0.1MeV, 0.5MeV and 1.0MeV by using a neutron spectrum calculation code. SNERDI calculates the FNFR by using JMCT and JSNT codes with newly developed source codes.
The geometry models of Qinshan are shown schematically in Fig. 4, which also show the locations of the capsule. Both radial and axial core power distributions are processed as follows:
1 1
( ) ( ) ( ) ( )
N N
n n
P N P n T n T n
(15)
Where P N( ) is the average relative power from
cycle 1 to cycle N, P n( ) is relative power for cycle n,
( )
T n is the effective full power day (EFPD) for cycle n,
days.
In JMCT calculation, 2E+9 neutrons are simulated. Geometry splitting with Russian Roulette and space bias
factors are used to improve the efficiency. Point detectors are used to tally the FNFRs. In JSNT calculation, the number of meshes is about 200 million
for 1/8 r z geometry, multi-group library is
BUGLE-96[3] library with 47 group neutron and 20 group photon,
the order of the Legendre expansion of the scattering cross-section is 3, the order of the fully symmetric
angular quadrature set is S8, and the point-wise flux
convergence criterion is 0.001. The source energy spectrum is taken as U-235 fission spectrum.
(a) xy model
(b) xz model
Fig. 4.Geometry model of Qinshan reactor
Table 1 gives FNFRs of Qinshan reactor for nominal power. As Table 1 shows, the relative errors are within 10% and 30% for the middle plane and upper weld, respectively. The measurement uncertainty is about 15%, which comes from target nuclides weights of detector samples, nuclear cross-sections, and core power etc. The calculation uncertainties are about 10% and 20% for the middle plane and upper weld, respectively, which come from power distribution, geometry and material etc. Considering the uncertainties above, the results of JMCT and JSNT are comparable with measurements.
Table 1.FNFRs of Qinshan reactor
Position Energy
(MeV) Codes
FNFR (n·cm-2·s-1)
(%)
Middle plane
≥0.1
Measure 1.404E+11
-JMCT 1.449E+11 3.24
JSNT 1.545E+11 10.05
≥0.5
Measure 9.725E+10
-JMCT 1.007E+11 3.56
JSNT 1.068E+11 9.85
≥1.0
Measure 6.552E+10
-JMCT 6.696E+10 2.21
JSNT 7.179E+10 9.58
Upper weld
≥0.1
Measure 1.594E+10
-JMCT 1.133E+10 -28.90
JSNT 1.216E+10 -23.68
≥0.5
Measure 1.103E+10
-JMCT 8.040E+09 -27.08
JSNT 8.722E+09 -20.89
≥1.0
Measure 7.415E+09
-JMCT 5.662E+09 -23.63
JSNT 6.098E+09 -17.75
3.2 CAP1400 reactor RPV neutron and photon fluence rate calculation
CAP1400 is an advanced passive generation III PWR designed by SNERDI of State Power Technology Corporation (SNPTC) of China, which is belonged to State Power Investment Corporation (SPIC). The thermal power of CAP1400 is 4040MW with 193 assemblies and a low-leakage refueling sheme. Different from previous reactors, the core shroud of CAP1400 is a highly heterogeneous structure composed of baffle and 6 half ring segments. Since it is subject to high neutron and photon fluence rates, both thermal stresses and iron DPA become determining parameters for its sizing. The present work aims to calculate neutron and photon fluence rates from barrel to RPV, which can be used to derive heat generation rate and DPA for the core shroud.
Fig. 5. Geometry model of CAP1400
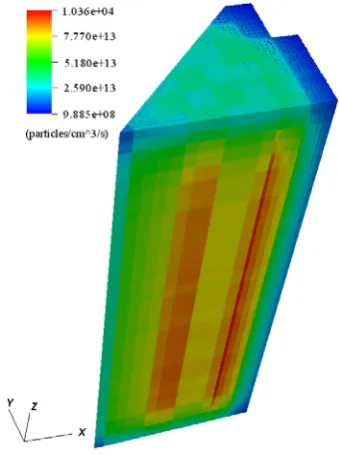
Fig. 5 shows the geometry model of CAP1400. The cycle-average power distribution of equilibrium cycle (Cycle 6) is used to determine the core source. Fig. 6 and
Fig. 7 are the radial and 3D neutron and photon source distributions of JMCT and JSNT, respectively. In JMCT calculation, number of particles (NPS) is 5E+9, superimposed mesh tallys are used to give fluence rate distributions. In JSNT calculation, almost the same parameters are used as in the previous JSNT calculation for Qinshan No.1 reactor surveillance capsule FNFR
calculation. The source energy spectrum of each
assembly is a mixed fission spectrum determined by the fission fractions of U and Pu.
Fig. 6. Radial neutron and photon source of JMCT
Fig. 7. 3D neutron and photon source of JSNT
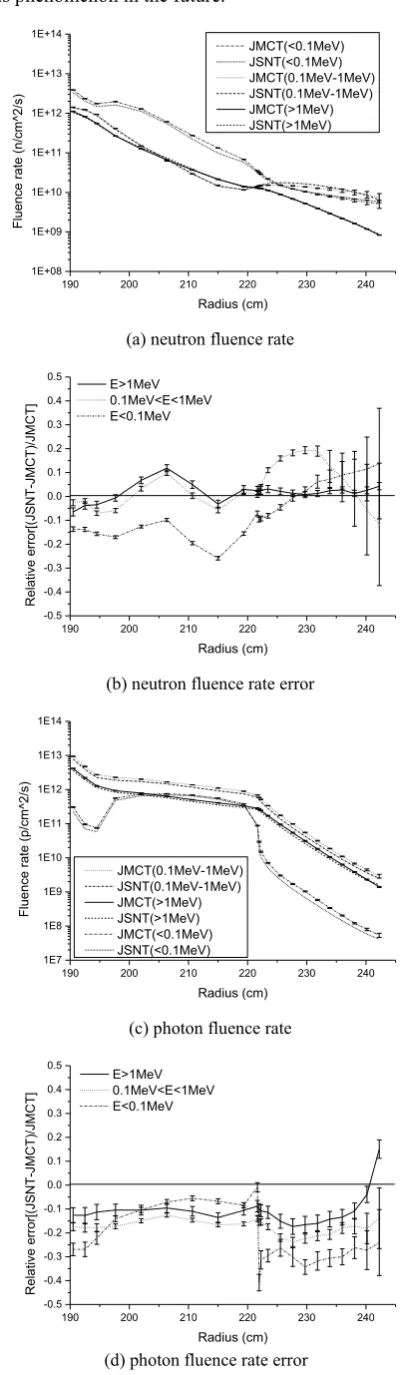
Fig. 8 gives the radial neutron and photon fluence rates and error distributions from barrel to RPV. As Fig. 8 shows, most of the relative errors of neutron fluence rates of JMCT and JSNT are within 20%, which satisfy the requirements for different radiation shielding calculation methods of U.S. Nuclear Regulatory
Commission (NRC) RG 1.190[4]. While most of the
40%. This is probably attributed to the difference from multigroup and continuous libraries. We will investigate this phenomenon in the future.
190 200 210 220 230 240
1E+08 1E+09 1E+10 1E+11 1E+12 1E+13 1E+14
Fluence rate (n/cm^2/s)
Radius (cm)
JMCT(<0.1MeV) JSNT(<0.1MeV) JMCT(0.1MeV-1MeV) JSNT(0.1MeV-1MeV) JMCT(>1MeV) JSNT(>1MeV)
(a) neutron fluence rate
190 200 210 220 230 240
-0.5 -0.4 -0.3 -0.2 -0.1 0.0 0.1 0.2 0.3 0.4 0.5
E>1MeV 0.1MeV<E<1MeV E<0.1MeV
Relative error[(JSNT-JMCT)/JMCT]
Radius (cm)
(b) neutron fluence rate error
190 200 210 220 230 240
1E7 1E8 1E9 1E10 1E11 1E12 1E13 1E14
Fluence rate (p/cm^2/s)
Radius (cm) JMCT(0.1MeV-1MeV) JSNT(0.1MeV-1MeV) JMCT(>1MeV) JSNT(>1MeV) JMCT(<0.1MeV) JSNT(<0.1MeV)
(c) photon fluence rate
190 200 210 220 230 240
-0.5 -0.4 -0.3 -0.2 -0.1 0.0 0.1 0.2 0.3 0.4 0.5
E>1MeV 0.1MeV<E<1MeV E<0.1MeV
Relative error[(JSNT-JMCT)/JMCT]
Radius (cm)
(d) photon fluence rate error
3.3 CAP1700 reactor RPV FNFR calculation
CAP1700 is a conceptual innovation advanced passive generation III PWR designed by SNERDI, which is aimed to improve the safety and economics of PWRs. Compared with CAP1400, CAP1700 has a new-style baffle with width increasing from 3cm to greater than 10cm, leading to a lower FNFR on RPV. The objective of this work is to analyse the effects of the fuel assembly burnup and enrichment variations on the FNFR of RPV.
Fig. 9 shows the geometry model of CAP1700. Table 2 gives the maximum FNFR (greater than 1.0MeV) on the inner surface of RPV. As Table 2 shows, the FNFR using U an Pu mixed spectrum is greater than that using U spectrum by 10% to 15%. Compared with U, Pu releases more neutrons and energy for each fission, and the fission spectrum is harder. These factors result in the increase of the FNFR using U and Pu mixed spectrum. Since Pu builds up with the increase of burnup, this effect should be considered in core source determination.
(a) xy model
(b) xz model
Codes Fission spectrum
FNFR (n·cm-2·s-1)
Relative error
(%)
JMCT U-235 1.07E+08
-JMCT U and Pu 1.20E+08 11.68
JSNT U-235 1.09E+08 1.78
JSNT U and Pu 1.23E+08 15.33
4 Conclusions
As core source is the precondition for reactor shield calculation, the objective of this work is to investigate source generation methods and develop source codes for a Monte Carlo code JMCT and a Discrete Ordinate code JSNT. The source codes consider burnup and enrichment of fuel assembly, and supply particle type, energy and space bias factors for users to improve calculation efficiency. The performed PSCs shows that the source codes developed are correct. The source codes developed can be used to support other Monte Carlo codes and the Discrete Ordinate codes without large modification. We will extend the sources codes for other reactor types in the future.
References
1. JMCT User's Manual, Institute of Applied Physics and Computational Mathematics, 2015
2. JSNT User's Manual, Institute of Applied Physics and Computational Mathematics, 2015
3. BUGLE-96, Coupled 47 Neutron, 20 Gamma-Ray
Group Cross Section Library Derived from ENDF/B-VI for LWR Shielding and Pressure Vessel Dosimetry Applications, DLC-185, Oak Ridge National Laboratory, 1999
4. Regulatory Guide 1.190 ˈ Calculational and
Dosimetry Methods for Determining Pressure Vessel Neutron Fluence, Nuclear Regulatory Commission, 2001