Western University Western University
Scholarship@Western
Scholarship@Western
Electronic Thesis and Dissertation Repository
4-10-2010 12:00 AM
Options Under Uncertainty: An Empirical Investigation of Patterns
Options Under Uncertainty: An Empirical Investigation of Patterns
of Commitment in Display Technologies in the Flat Panel TV Set
of Commitment in Display Technologies in the Flat Panel TV Set
Industry
Industry
Derek Lehmberg
The University of Western Ontario, Richard Ivey School of Business Supervisor
Rod E. White
The University of Western Ontario
Graduate Program in Business
A thesis submitted in partial fulfillment of the requirements for the degree in Doctor of Philosophy
© Derek Lehmberg 2010
Follow this and additional works at: https://ir.lib.uwo.ca/etd Part of the Strategic Management Policy Commons
Recommended Citation Recommended Citation
Lehmberg, Derek, "Options Under Uncertainty: An Empirical Investigation of Patterns of Commitment in Display Technologies in the Flat Panel TV Set Industry" (2010). Electronic Thesis and Dissertation Repository. 1.
https://ir.lib.uwo.ca/etd/1
This Dissertation/Thesis is brought to you for free and open access by Scholarship@Western. It has been accepted for inclusion in Electronic Thesis and Dissertation Repository by an authorized administrator of
OPTIONS UNDER UNCERTAINTY: AN EMPIRICAL INVESTIGATION OF PATTERNS OF COMMITMENT IN DISPLAY TECHNOLOGIES IN THE FLAT
PANEL TV SET INDUSTRY
(Thesis format: Monograph)
by Derek
Richard Ivey School of Business Lehmberg
Graduate Program in Business Administration
A thesis submitted in partial fulfillment of the requirements for the degree of
Doctor of Philosophy
School of Graduate and Postdoctoral Studies The University of Western Ontario
London, Ontario
THE UNIVERSITY OF WESTERN ONTARIO School of Graduate and Postdoctoral Studies
CERTIFICATE OF EXAMINATION
Supervisor
______________________________ Dr. R. E. White
Supervisory Committee
______________________________ Dr. Tony Frost
______________________________ Dr. Michael Rouse
Examiners
______________________________ Dr. Jay Anand
______________________________ Dr. Matt Davison
______________________________ Dr. Tony Frost
______________________________ Dr. W. Glenn Rowe
The thesis by
Derek Grantham Lehmberg
entitled:
OPTIONS UNDER UNCERTAINTY: AN EMPIRICAL INVESTIGATION OF PATTERNS OF COMMITMENT IN DISPLAY TECHNOLOGIES IN THE FLAT
PANEL TV SET INDUSTRY
is accepted in partial fulfillment of the requirements for the degree of
Doctor of Philosophy
ABSTRACT
This dissertation considers fundamental questions about real options reasoning
and its application in the face of uncertainty: do firms behave as real options reasoning
predicts, and are there performance benefits from its application? The concept of
uncertainty is further developed by considering two primary types: technological
uncertainty and market needs uncertainty.
A qualitative industry level historical case study is performed on the flat panel TV
industry, chosen because it exhibits high technological uncertainty and low market needs
uncertainty. Real options logic predicts, in such an industry, that firms will develop and
maintain technology options until uncertainty is resolved. Firm level case studies for
major incumbent Japanese TV set manufacturers and other relevant firms are performed.
Comparison across the cases, and between several specific firms is conducted to test and
further develop theory.
The firms studied are found to generally behave as predicted by real options logic.
Evidence from the study does not present a clear relation between options-related
behavior and performance. Although this study identifies evidence not holding options
can have large negative performance results, firms holding options as predicted by theory
did not realize lasting performance improvements. With one exception, firms attempting
to leverage technological capabilities into improved market positions were unable to
realize durable improvements in their positions. The development and release of flat
panel TV coincided with changes in performance for many firms in the industry;
industry players had generally returned to the trajectories they were previously on.
Between-case analysis of several outlying firms in the sample provides a rich and
nuanced view of requirements for firms to dramatically improve performance in the face
of high technological uncertainty in a market with very large size potential and relatively
well-understood customer needs.
This research contributes to the empirical literature on real options and is novel
amongst academic research in its coverage of the flat panel display history using
Japanese sources. Finally, this dissertation includes managerial implications regarding
the usefulness of real options reasoning as well as practical issues in its implementation.
Keywords: real options, uncertainty, strategic commitment, flat panel display industry,
ACKNOWLEDGEMENTS
A research project of this magnitude cannot be completed without the
involvement and support of many people. I would first like to thank my advisor, Rod
White, for his substantial contributions of time, effort, and thought to this work and more
broadly to my PhD Education. He has been a wonderful mentor. Rod’s diverse interests
and deep intellectual curiosity have had a profound impact on my intellectual life.
I would also like to thank the members of my proposal committee (Tony Frost,
Michael Rouse, and Charlene Zietsma) and my defense committee (Jay Anand, Matt
Davison, Tony Frost, and Glenn Rowe). Their advice has been invaluable not only to this
dissertation but to my overall development as an academic researcher. In addition to
being on my defense committee, Glenn Rowe has been a supportive mentor to me over
the years.
A number of people played instrumental roles in facilitating my research in Japan.
I would like to thank Dr. Shige Makino of the Chinese University of Hong Kong, Dr.
Tsuyoshi Numagami of Hitotsubashi University, Dr. Munahiko Itoh and Dr. Atsushi
Osanai of Kobe University for their support and advice. I am greatly indebted to Satomi
Funahashi, Takanobu Kitahoki, and Takeshi Takaha and of Fuji Keizai as well as
Kensuke Kishikawa and Akira Oyamada for arranging and participating in interviews
with insiders in this research. I would like to thank Masatoshi Kato and Michiaki Lee for
their ideas about access to data sources. I also want to express my appreciation to the
Engaging Emerging Markets Centre at the Richard Ivey School of Business for financial
Finally, I would like to thank the PhD program office, my fellow PhD students,
TABLE OF CONTENTS
CERTIFICATE OF EXAMINATION ………. ii
ABSTRACT ………. iii
ACKNOWLEDGEMENTS ……….………... v
TABLE OF CONTENTS ……….. vii
LIST OF CHARTS ……….. viii
LIST OF FIGURES ……….. x
LIST OF TABLES ……… xii
LIST OF APPENDICIES ……….. xiii
CHAPTER ONE: INTRODUCTION, BACKGROUND, AND THEORY DEVELOPMENT ……… 1
CHAPTER TWO: RESEARCH SETTING AND METHODS ……… 35
CHAPTER THREE: FLAT PANEL DISPLAY TECHNOLOGY TYPES AND THEIR HISTORICAL DEVELOPMENT ……… 65
CHAPTER FOUR: THE FLAT PANEL TELEVISION INDUSTRY ………. 105
CHAPTER FIVE: FIRM LEVEL ANALYSIS ……… 126
CHAPTER SIX: BETWEEN CASE ANALYSIS ……… 248
CHAPTER SEVEN: RELATING STUDY FINDINGS TO THEORY ………….. 293
CHAPTER EIGHT: DISCUSSION AND CONCLUSION ………. 308
BIBLIOGRAPHY ………. 333
APPENDIX ONE: ETHICS APPROVAL ……… 353
APPENDIX TWO: DISPLAY TECHNOLOGY TYPOLOGY ……… 354
APPENDIX THREE: FIRM LEVEL HISTORICAL TIMELINE ……….. 358
LIST OF CHARTS
Chart 3-1: Largest LCD and PDP Panels by Year 71 Chart 3-2: Maximum Viewing Angle of LCD Panels 73 Chart 3-3: Response Times of Fastest LCD Panels 74 Chart 3-4: LCD Production by 6 Major Japanese Active Matrix LCD Firms 87 Chart 3-5: Total Japanese Domestic Display Production Value, by Display
Technology Type (1980-1992)
88
Chart 4-1: Global TV Set Market 111
Chart 4-2: Japanese Domestic Shipments of TV Sets by Display Type 120 Chart 4-3: Household Penetration of Flat Panel TV in Japan 120 Chart 4-4: Worldwide TV Set Market (2000 – 2006) 122 Chart 4-5: Worldwide TV Market Forecast 123 Chart 4-6: Average TV Module Prices (1998 – 2006) 124
Chart 5-1: Panasonic Patents 139
Chart 5-2: Panasonic Sales and Net Income 141 Chart 5-3: Panasonic AVC Networks Sector, Sales and Operating Income 141
Chart 5-4: Sony Patents 146
Chart 5-5: Sony Electronics Sector and Television Revenues 150 Chart 5-6: Sony Electronics Sector Operating Income 150
Chart 5-7: Hitachi Patents 156
Chart 5-8: Operating Income of Relevant Hitachi Sectors 158
Chart 5-9: Mitsubishi Patents 163
Chart 5-10: Revenue and Operating Income of Mitsubishi’s Home Appliance Sector
165
Chart 5-11: Toshiba Patents 169
Chart 5-12: Toshiba Domestic Japanese LCD TV Market Share 173 Chart 5-13: Toshiba Digital Products Segment, Sales and Operating Income 173
Chart 5-14: Pioneer Patents 178
Chart 5-15: Pioneer Home Electronics Sector, Revenue and Operating Income 180
Chart 5-16: Sanyo Patents 185
Chart 5-17: Sanyo Net Sales and Net Income 188 Chart 5-18: Sanyo Consumer Business Sector: Net Sales and Operating Income 188
Chart 5-19: Sharp Patents 195
Chart 5-20: Sharp Sales and Net Income 197 Chart 5-21: Sharp Corporation External Revenues of LCD, Audio Visual and
Communication Equipment Sectors
197
Chart 5-22: Funai Patents 199
Chart 5-23: Funai LCD TV Unit Sales 200 Chart 5-24: Funai Revenues and Net Income 201
Chart 5-25: JVC Patents 203
Chart 5-26: JVC Consumer Electronics Business Sector Sales and Operating Income
205
Chart 5-27: LG Patents 207
Chart 5-29: LG Displays Sales Revenue by Display Segment 211 Chart 5-30: LG Electronics Consolidated Sales and Net Income 211 Chart 5-31: LG Electronics Digital Displays Sector, Sales and Operating Income 212
Chart 5-32: Samsung Patents 217
Chart 5-33: Samsung Electronics Performance 218
Chart 5-34: Samsung SDI PDP Sales 219
Chart 5-35: Samsung SDI Consolidated Sales and Net Income 219
Chart 5-36: Philips Patents 223
Chart 5-37: Philips Sales and Net Income 225 Chart 5-38: Philips Television Sales and EBITDA 226
Chart 5-39: Thomson Patents 230
Chart 5-40: Thomson’s Losses Relating to Exiting CRT Production 231
Chart 5-41: Fujitsu Patents 233
Chart 5-42: NEC Patents 241
Chart 5-43: Canon Patents 242
LIST OF FIGURES
Figure 1-1: Four Environmental Types Depending on Uncertainty Level 19 Figure 1-2: Technology Option Ladder 25 Figure 1-3: Uncertainty Levels and Best-Fitting Uncertainty Management
Approach
30
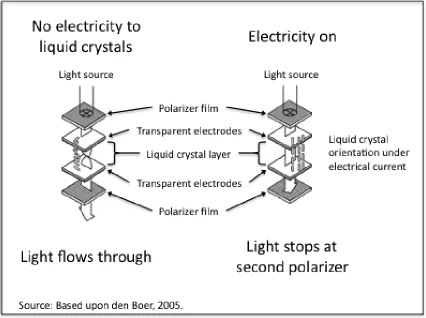
Figure 3-1: Diagram of Twisted Nematic Liquid Crystal Cells 67 Figure 3-2: Layers in Active Matrix LCD and Active Matrix OLED Panels 78 Figure 3-3: Development of Display Technologies Over Time 99 Figure 3-4: Application of Flat Panel Display Technologies Over Time 100 Figure 5-1: Panasonic Option Ladder 136 Figure 5-2: Panasonic Display Panel Production 137 Figure 5-3: Panasonic Production Lines 138
Figure 5-4: Sony Option Ladder 144
Figure 5-5: Sony Display Panel Production Volume and Production Lines 145
Figure 5-6: Hitachi Option Ladder 154
Figure 5-7: Hitachi Display Panel Production Volume and Production Lines 155 Figure 5-8: Mitsubishi Option Ladder 161 Figure 5-9: Mitsubishi Display Panel Production Volume and Production Lines 162 Figure 5-10: Toshiba (TMDT) Option Ladder 170 Figure 5-11: Toshiba (TMDT) Display Panel Production Volume and Production
Lines
171
Figure 5-12: Pioneer Option Ladder 176 Figure 5-13: Pioneer Display Panel Production Volume and Production Lines 177
Figure 5-14: Sanyo Option Ladder 183
Figure 5-15: Sanyo Display Panel Production Volume and Production Lines 184
Figure 5-16: Sharp Option Ladder 193
Figure 5-17: Sharp Display Panel Production Volume and Production Lines 194
Figure 5-18: JVC Option Ladder 202
Figure 5-19: LG Group Option Ladder 208 Figure 5-20: LG Display Panel Production Volume and Production Lines 209 Figure 5-21: Samsung Option Ladder 214 Figure 5-22: Samsung Panel Production 215 Figure 5-23: Samsung Production Lines 216 Figure 5-24: Philips Option Ladder 221 Figure 5-25: Philips Display Panel Production Volume and Production Lines 222 Figure 5-26: Thomson Option Ladder 228 Figure 5-27: Fujitsu Option Ladder 234 Figure 5-28: Fujitsu Display Panel Production Volume and Production Lines 235
Figure 5-29: NEC Option Ladder 239
Figure 5-30: NEC Display Panel Production Volume and Production Lines 240
Figure 5-31: Canon Option Ladder 243
LIST OF TABLES
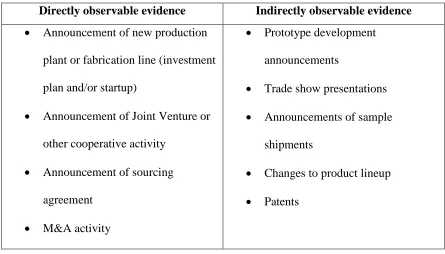
Table 2-1: Directly and Indirectly Observable Evidence of Real Options 45
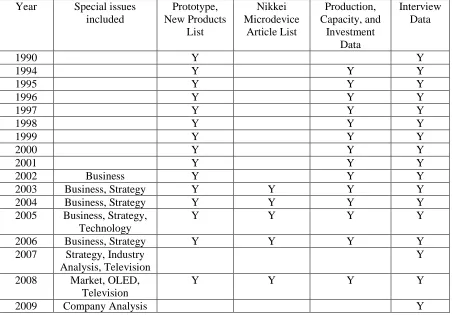
Table 2-2: Nikkei FPD Issues Used 49
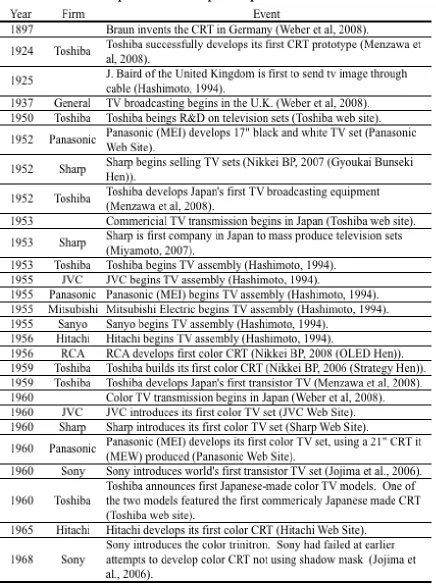
Table 2-3: Firms Included in this Study 63 Table 3-1: Display Technology Development Timeline 101 Table 4-1: Events in Japanese TV Development up to 1970 107 Table 4-2: Early LCD TV Developments and Product Introductions 113 Table 4-3: Withdrawal from CRT-TV by Japanese Firms 121 Table 6-1: Option Portfolio Breadth 252 Table 6-2: Depth of Technology Options 256 Table 6-3: Comparison of Groups with Early, Late, and no a-Si TFT LCD
Production Entry
266
LIST OF APPENDICIES
CHAPTER ONE: INTRODUCTION, BACKGROUND, AND THEORY
DEVELOPMENT
Strategy may be defined as commitments made by the firm in the face of an
uncertain future largely beyond its prediction or control. Strategic commitments are path
dependent, non-reversible decisions. Commitments constrain future decisions because
they are costly and difficult to reverse (Barney, 1991; Ghemawat, 1991; Raynor, 2007).
The logic of competitive advantage suggests a firm unwilling to make commitments until
uncertainties are largely resolved will be unable to achieve competitive advantage;
although it may survive it will never excel (Gemawat, 1991; Raynor, 2007). Because
such a firm will wait to enter markets until after uncertainty has been resolved, it will
miss the opportunities to create competitive advantage through positioning or
development of competencies (Raynor, 2007).
Commitments matter precisely because the future is uncertain. Commitments can
be thought of as bets made by the firm; even with the most thorough strategizing and
forecasting, the firm often will make the wrong bet (e.g., Raynor, 2007). If the future
were knowable, firms would be able to make investments with certain returns rather than
risky bets. Herein lies what Raynor (2007) termed the “strategy paradox;” firms making
strategic commitments experience the extremes in performance outcomes, with those on
the bottom extreme frequently going bankrupt.
Decision makers face a conundrum. If they do not make commitments, the firm
perform very well or very poorly. It might have to exit the industry or even go bankrupt.
Because of the downsides, uncertainty tends to drive out action. Confronted with a high
chance of undesired outcome, how do firms make commitments under high levels of
uncertainty? How can managers mitigate uncertainty while still gaining the advantages
of commitment?
One possible answer is real options reasoning (e.g., McGrath, 1997, 1999;
McGrath, Ferrier & Mendelow, 2004). It suggests firms can develop and maintain
option-like investments to keep open the opportunity to reap the benefits of commitment
while maintaining flexibility to abandon these investments with a relatively small cost.
Although this theory appears to offer a way for firms to manage uncertainty, extant
research does not document the performance impact of its application. Additionally,
whether firms actually behave in a way consistent with real options reasoning (ROR) or
not is a question yet unanswered.
To examine these questions, this research performs an historical case study of the
flat panel TV industry. This method is appropriate for the study because it allows the
inclusion of extreme performance events (i.e., exit), it allows for flexibility to examine a
variety of relevant sources of data, and will be generalizeable to industries with similar
attributes. The industry is interesting because it exhibits a high level of technological
uncertainty.
This dissertation is organized as follows. This chapter develops theory based
upon real options reasoning under uncertainty. A model is developed and propositions
industry. The flat panel TV set industry faced technological uncertainty due to
competing display technologies, while it exhibited relatively low market needs
uncertainty. Chapter three describes the former, and chapter four the latter. Chapter five
contains firm-level case studies identifying options portfolios held over time. Chapter six
performs analysis across and between the cases to identify patterns in behavior and
performance. Based upon data and analysis from Chapters five and six, Chapter seven
develops findings in terms of theory and propositions developed in Chapter one. Chapter
seven also develops some post hoc theorizing and analysis. Chapter eight contains the
discussion and conclusion.
BACKGROUND AND THEORY DEVELOPMENT
The introduction briefly discussed real options. Below, uncertainty, real options,
and strategic commitment are discussed in more detail. A distinction is made between
two different types of uncertainty: customer needs uncertainty and technological
uncertainty. Based upon this distinction, a model is developed and propositions
presented.
Uncertainty
It is important to distinguish the concept of uncertainty from that of risk. The
notion of risk is that although the outcome of a given event is not known in advance, its
uncertainty, the probability distribution is not known (Knight, 2006); arguably, even the
range of possible outcomes may not be knowable in advance in many cases. Uncertainty
has been framed in terms of complexity and dynamism (e.g., Duncan, 1972). Regardless
of how one tries to break down and define it, however, the level of uncertainty itself is
not knowable in advance or while it is being experienced, but can be classified with more
accuracy retrospectively. Many of the different underlying causes may be not visible or
knowable until after unexpected changes have occurred. The nature of their impact may
also change over time.
Because uncertainty can be endogenous or exogenous to the firm, overall
uncertainty levels are not identical across firms, even those competing in the same
product market and geographical locations. Folta (1998) described endogenous
uncertainty as uncertainty that can be reduced by the firm taking action and learning from
the feedback, and exogenous uncertainty as uncertainty that cannot be wholly resolved by
the firm. For the purpose of this research, it makes more sense to define endogenous and
exogenous uncertainty based upon the source of uncertainty. Endogenous uncertainty is
due to the firm’s own capabilities including its ability to understand customers and
competitors. Exogenous uncertainty is uncertainty caused by things outside of the firm.
Such uncertainty is not necessarily beyond the firm’s ability to reduce. For instance,
expeditionary marketing can be used to reduce uncertainty of needs in a new product
market (Hamel & Prahalad, 1991). Similarly, pre-investments such as taking on lobbying
activities in the face of uncertain legislation may also reduce uncertainty (McGrath,
1997). These uncertainty reduction approaches would be classified differently using the
outside the firm in both cases (uncertain market needs in one case and uncertain
legislation in another), the definition proposed here would code them both as exogenous,
however, Folta’s (1998) definition would code them as endogenous as both can be
reduced through firm actions.
This distinction is important because the research in this dissertation is primarily
focused on exogenous uncertainty. The level and type of endogenous uncertainty is by
nature firm-specific. Because of this, it is difficult to compare the actions and
performance of firms relating to endogenous uncertainty. Exogenous uncertainty, on the
other hand, affects all firms in the product market in question, and for this reason allows
comparison between firms more readily. However, it should be noted that the distinction
– although useful – may not always be clearly visible to the outside observer.
Uncertainty Types
Different types of uncertainty have different implications for the firm. The ways
that firms can make commitments and manage uncertainty depends upon the nature and
type of uncertainty it faces. Firms make commitments in the face of market needs
uncertainty and technological uncertainty. Others have made this distinction in the
literature (e.g., MacMillan & McGrath, 2002; Oriani & Sobrero, 2008), although specific
definitions vary between authors. Below, market needs uncertainty is discussed before
moving on to consider technological uncertainty. Although this discussion of market
Uncertainty of market needs, the needs of current and potential customers in a
given product market, may exist at a number of levels. The spectrum of needs runs from
basic needs to ever changing trends in desirability of specific aspects of a good or service
(Kaldor, 1971). For example, nourishment and clothing are basic needs. Although many
basic needs do not change much over time, the way they are best served does. Sometimes
these may appear to be predictable trends, and other times not.
At any point in time, there may be latent needs and preferences that cannot be met
due to technological limitations. Some latent needs may be predictable, at least for a
certain timeframe. For instance, the consumer preference for a flat panel television was
fairly clear even when Cathode Ray Tube (CRT) technology was the only feasible way to
create video displays. If given the choice, consumers would prefer something that
provided a larger picture size but took up less space in their homes. With many products,
customers will tend to prefer faster, higher quality, greater reliability, more convenience
if the price is the same – and often even it is higher. In the case of televisions, thinness is
another of these attributes. In the case of hard disk drives, storage capacity has been a
differentiating attribute. Given the choice between drives of the same format size in the
same price range, historically customers have chosen drives with larger storage capacity.
Christensen (1997) argues that these kinds of needs can become oversupplied. In
other words, improvements are made past the point where further increases are no longer
seen as beneficial to customers. At the point that they have become oversupplied,
improvements in this dimension no longer differentiate the product. A good example of
this is hard disk space. After a point, the average customer cannot use additional storage
differentiators will become more important in customers’ choices. Literature on product
and industry development cycles (e.g., Geroski, 2003) and customers’ usage development
cycles (e.g., Moore, 2005) describes how these changes occur over time. Firms work to
make technological improvements to their product along the attribute dimensions
historically valued by customers. As one attribute reaches a point of oversupply, the
dimension of needs it represents is replaced by another dimension. When and where
these points will be reached and what the next dimension of differentiation will be are
uncertain.
Although future customer preferences appear to be relatively clear in some cases,
they are much more speculative in others. Exogenous economic and demographic
changes increase needs uncertainty (Oriani & Sobrero, 2008). For instance, the 1970s oil
shocks drove American car buyers to place greater value on fuel economy and less value
on vehicle size. Exogenous change may or may not be predictable by the firm in
advance. Even when its existence is predicted, however, the magnitude of impact is
highly uncertain.
Furthermore, customers typically do not know how to value a product with which
they are not familiar. Latent needs are particularly uncertain where no offerings currently
exist (Geroski, 2003). Potential customers may not be known, nor may be the way of best
serving them or the price they are willing to pay (MacMillan & McGrath, 2002).
Although the television set customer may be able to say that he would prefer a larger
thinner screen before LCD technology became viable, the potential PDA user did not
Interestingly, seemingly minor changes to product characteristics can fuel large
changes in customer demand levels. For example, the first Apple iPod entered into an
existing market for mp3 based portable music players. It had a superior interface and
larger storage than existing products, but was not cutting edge from a technological
perspective. Sony, which had been a pioneer in portable audio, first with the world’s first
transistor radio and later with the Walkman, was already in the mp3 player market.
Audio electronics firms such as Sony – who thought they understood market needs for
portable consumer audio – were probably very surprised to see customers prefer the
offering of a computer company to their own.
The above discussion of market needs uncertainty has considered unknowable
latent market needs, changes in attribute dimensions that customers value, and the
potential for exogenous demographic and economic change to impact customer needs.
Below, technological uncertainty is discussed.
Where multiple technologies vie to fulfill a customer need, existing or latent,
technological uncertainty can be said to exist (e.g., Tegarden, Hatfield, & Echols, 1999;
Anderson & Tushman, 1990, Oriani & Sobrero, 2008). However, just because a
technology grows to dominate an industry does not mean that technological uncertainty is
completely absent. There is still the possibility that a competitive or substitute technology
will arise from outside the firm (e.g., Stuart & Podolny, 1996). Furthermore, future
convergence of different technologies cannot be accurately forecast (Sherden, 1998). It is
not clear which technologies will emerge or become feasible at any future point in time.
In general, the ability to accurately predict how technologies will evolve and co-evolve in
Moore’s law for microprocessors that predicts the number of components that can be
placed on integrated circuits doubles every two years (e.g., Schaller, 1997).
The distinction between endogenous and exogenous uncertainty is particularly
important to make with regard to technology. Folta (1998) described endogenous
uncertainty as uncertainty that can be reduced by the firm taking action and learning from
the feedback, and exogenous uncertainty as uncertainty that cannot be wholly resolved by
the firm. Oriani & Sobrero (2008) defined technical uncertainty as being endogenous to
the firm. The ability of a firm to complete a technology development project is an
example of this type. Firms can reduce this kind of endogenous uncertainty by pursuing
multiple parallel projects on the same technology (Nelson, 1961). (As compared with
exogenous technological uncertainty, which can be addressed by pursuing parallel
projects on competing
This distinction does not mean that R&D investment has no impact on uncertainty
levels. Indeed, unlike risk in financial markets which is resolved over time, exogenous
technological uncertainty is reduced through R&D investments. Where financial options
are concerned, investors do not impact the future outcome probability distribution by
buying or selling options. In the case of technology options, investments can change the
level of uncertainty. The same is true for market needs uncertainty.
technologies.) Oriani & Sobrero (2008) further defined
technological uncertainty as exogenous to the firm, and occurring at industry level. This
definition agrees with the one employed by this research.
Although technological development and market needs may appear to be
forecast or predicted with any accuracy except in the very short term (Sherden, 1998).
Strategic uncertainty is greater over the long run than the short run (Raynor, 2007).
Capabilities that are further upstream, such as research-related capabilities, have
longer-term impact, therefore they face a greater level of uncertainty (Raynor, 2007).
The antecedents of variation in technologies and market needs differ; accordingly
the types of uncertainties are not symmetrical. In other words, uncertainty in the
technology development vector is different from uncertainty in the evolution of market
needs. They are related in that new technologies enable new products fulfilling
previously unmet needs, and identification of unmet needs can stimulate additional
investment in technologies potentially capable of meeting these needs. Therefore, a
change in the level of one kind of uncertainty may impact the level of the other.
Commitment Types
Like uncertainty, commitments can also be thought of in terms of market needs
and technologies (Ghemawat, 1991). Firms can make commitments to one or both types.
For instance, a firm may commit to developing a technology at an early stage where its
ultimate benefits are not concretely known. This would be a commitment to the
technology but not to a market need. Alternatively, a firm could commit to a market
without having a technology at all. A supermarket chain, for instance, can commit to the
beverage market using its own brand and distribution infrastructure and outsource
development, formulation, production and other functions. In this case, it would have
Developing technologies requires commitment because of time compression
diseconomies inherent in knowledge building (Dierickx & Cool, 1989). In other words,
once a technology is known to be of value, it may be too late to catch up to the leaders.
Technological lockout may result (Schilling, 1998), and keep the firm from entering (or
remaining) in the product market in question. At the same time, it is costly to maintain
technological capabilities (e.g. Miller, 2002).
Firms making early commitments to market needs benefit in several ways. There
are limitations to customer attention; therefore early branding may capture attention more
effectively than later brand building efforts. Similarly, there are limitations to
distribution channels. Strong positions in these channels may be easier to achieve at an
early stage rather than after uncertainty has been reduced. Some market commitments
may create switching costs, protecting market share and making it difficult for new firms
to enter the market (e.g. Lieberman & Montgomery, 1988). Finally, early commitment to
market needs may result in a fine tuned understanding of needs and therefore greater
ability to meet them (Carpenter & Nakamoto, 1989, 1990 in Kerin, Varadarajan &
Peterson, 1992).
These two kinds of commitment are not symmetric. Costs and capabilities
required to undertake them are different. Furthermore, as can be seen from the discussion
Real Options
Application of real options has been suggested as a way to manage uncertainty.
The fundamental idea behind a real option is that uncertainty can be managed by making
a partial commitment rather than a full commitment (Anand, Oriani & Vassolo, 2007).
These partial commitments are sequential and irreversible (Dixit & Pindyck, 1994). By
holding the real option, the firm benefits from the flexibility to make future decisions to
commmit (Li, James, Madhavan & Mahoney, 2007). Tong and Reuer (2007:5) formally
defined real options as "investments in real assets, as opposed to financial assets, which
confer the firm the right, but not the obligation, to undertake certain actions in the
future." Two aspects of this definition separate real options from investments in general.
First, real options do not include financial assets. Second, some kinds of investments do
carry obligations to undertake future action.
Although there is agreement about these fundamental descriptions, there is
disagreement upon what constitutes a real option in the strategy literature (Adner &
Levinthal, 2004; McGrath, Ferrier & Mendelow, 2004). On the one extreme, Adner &
Levinthal (2004) argue for a relatively narrow and specific definition. They suggest that
real options theory requires a discrete investment logic. In other words, investment
decisions must be characterized by clearly demarcated stages with “go, no-go”
investment decision points. Furthermore, where there is too much flexibility regarding
the technology to be developed or market in which to apply it, the option becomes more
difficult to clearly define or analyze, and the investment logic ceases to be discrete. In
McGrath et al. (2004), on the other hand, suggest a broader definition of real
options. They identify four different conceptualizations of real options appearing in the
literature: (1) the notion that the firm’s market value includes a growth option
component, (2) a single and clearly defined proposed investment which has qualities
similar to options – often this approach considers how to value the option in question and
sometimes compares this with other project evaluation techniques, (3) more generic types
of choices made by managers that can be applied to more than one proposal – the focus
here is on the choice and not the underlying assets; and (4) the notion of real options
reasoning as a heuristic applicable to strategy. These conceptions represent sub-streams,
however they do not appear to be mutually exclusive. For instance, considering real
options as a strategy heuristic does not mean that one dismisses the idea that a portion of
the firm’s market value is due to growth options. McGrath et al. (2004) is strongly
supportive of the inclusion of the real options as a heuristic in strategy research.
The second conceptualization, which some have called option pricing or options
valuation, has received attention as an alternative to net present value (NPV) for
evaluating potential investments. NPV ignores the option value in projects and therefore
may lead to underinvestment in projects having higher option value but lower NPVs than
competing proposals. This approach puts its emphasis on numerical calculation with its
origins in finance. Although this approach has apparent benefits, case studies have found
that firms have difficulty implementing it (Bowman & Moskowitz, 2001). Furthermore,
as a decision making tool, option pricing does not lead to the same conclusions as other
When Miller and Arikan (2004) simulated search under uncertainty, they made
the distinction between option reasoning and option pricing. The option pricing approach
was strongly related to financial conceptions of option value, whereas option reasoning
was based upon the conceptualization of options as a heuristic. In Miller and Arikan’s
(2004) model, the real options logic firm searched by developing two competing
technologies and putting off specialization until the value of one technology significantly
outweighed the other. The options pricing firm, on the other hand, compared the two
option values and put all its investment in one of the two technologies, assuming that the
value of the option was greater than its cost. The differences in the models clarify the
different ways of thinking about real options. Not surprisingly, the outcomes for the real
options reasoning firm and real options pricing firm differ in this simulation.
While the conceptualization of real options as a valuation technique has merit, it
faces limitations in its applicability in situations where technological and/or market needs
uncertainty are high. First, it is hard to identify a suitable basis for valuation of options in
these situations. Second, while time may resolve uncertainty relating around the value of
the underlying assets of financial options, uncertainty relating to market needs and
technologies is resolved by development and feedback loops. The number of firms and
the size of their efforts to develop technologies and markets have an impact on how long
it takes for uncertainty to be resolved. However, real options as a valuation technique
does not take this into full consideration.
This research follows the option reasoning conceptualization and considers real
options to be a strategy heuristic. This conceptualization has also been called real options
pricing and real options reasoning seek to address strategic investment decisions. While
real option pricing is a prescriptive evaluation methodology that has been promoted for
practitioner use, real options reasoning is a strategy heuristic managers are often thought
to follow even if they do not categorize it as such. McGrath and Nerkar (2004:2)
describe this reasoning as implying that “decision-makers implicitly (or explicitly)
respond to the value of the right to preserve decision rights in the future in their
investment choices.” Bowman and Hurry (1993) presents a relatively broad picture of
real options that includes elements of real options logic. They emphasize the idea that
small incremental investments in options can be made to learn and develop capabilities,
and that these should be followed by large commitments (option exercises) later on.
They suggest the timing of the commitment has a major impact on the actual performance
achieved by the firm (Bowman & Hurry, 1993).
McGrath (1999) further argues that real options reasoning allows the potential
benefits of entrepreneurial failure to be properly understood. In other words, a failed
project can bring valuable knowledge that is exploitable in the future, and if the
investments are made in stages, losses can be contained at the same time. More
generally, this logic suggests that attempts to avoid failure may result in lost opportunities
for growth and for learning. To the extent that investments are staged suitably, it is
possible to limit the cost of failure without limiting the benefits of success (McGrath,
1999).
Maritan and Alessandri (2007) suggest that some real options are available to all
firms in an industry, whereas others are proprietary and available only to particular firms.
sub-additive or super-sub-additive, and the value of an option available to all firms in the industry
is not necessarily the same to each firm (Anand et al., 2007; Vassolo, Anand & Folta,
2004).
It appears likely that not all types of real options have been identified. This is
partially due to the different conceptions of real options. Real options can be considered
in terms of generic choices made by managers (e.g., the option to abandon an investment
or the option to invest) or by the object of the option (e.g., research and development
options). Tong and Reuer (2007) suggest the economics and finance literatures have
assembled a taxonomy of generic choice options. However, the identification and
categorization of options as objects, on the other hand, is far from complete. Research
focusing on options as objects rather than choices has identified different types of
investments that can be option-like including capabilities (Kogut & Kulatilaka, 2001),
sequential R&D investment (McGrath & Nerkar, 2004), technology licensing (Bowman
& Moskowitz, 2001), joint ventures (e.g., Kogut, 1991), equity investments (e.g., Folta,
1998; Vassolo et al., 2004), and venture capital investments (Hurry, Miller & Bowman,
1992). However, this area is still developing and cannot be considered to represent the
entire universe of potential objects for options. While this leaves open the opportunity
for future development, at the same time it represents a risk that the current empirical
work fails to identify all option-like investments that have not appeared in the prior
literature, potentially resulting in misleading results.
Although real options has great appeal and substantial theoretical work has been
done, empirical work in the area is lacking (Reuer & Tong, 2007). Published empirical
data to perform research relating to real options (e.g., Chi & Levitas, 2007; McGrath &
Nerkar, 2004). Guler (2007) analyzed venture capital firms investments in startups from
a real options perspective. Other empirical research has studied firms attempts to
integrate real options valuation techniques into their investment decision making
processes (e.g., Bowman & Moskowitz, 2001). It should be noted some of these papers
used the conceptualization of real options reasoning, while others focused on real options
as an investment valuation technique. Empirical work to date has not differentiated
between alternative kinds of uncertainty. Li et al. (2007) called for future studies to
investigate different kinds of uncertainty, how they may interact, and the impact upon
how investments in options are made. This dissertation contributes to the real options
literature by performing an empirical study of option-like investment in an industry
encountering uncertainty of a specific nature.
Model of Uncertainty Environments
Firms face different degrees of technological and market needs uncertainty at
different times and in different industries. Although it is not possible to define the type
and degree of uncertainty an industry will experience in the future, it is possible to define
time periods in specific industries where large or small amounts of uncertain change
occurred in the past. The model introduced here integrates these kinds of uncertainties
with the commitment types discussed above. Macmillan and McGrath (2002) propose
what appears to be a similar model, however it differs in several important ways. First,
they consider (endogenous) technical uncertainty, as opposed to (exogenous)
of uncertainty they face. This research argues that levels of uncertainty cannot be
accurately identified ex ante and are more reliably observed and understood in retrospect.
While there are some readily observable indicators that identify high uncertainty at the
time it is present, the absence of these indicators does not preclude a high level of
uncertainty. For instance, the existence of multiple competing technologies for the same
application indicates a high level of technological uncertainty, however the absence of
competing technologies does not necessarily mean that technological uncertainty is low,
as new technologies can emerge at any point in time. As this suggests, managers may be
able to identify high uncertainty in some circumstances but they cannot identify low
uncertainty.
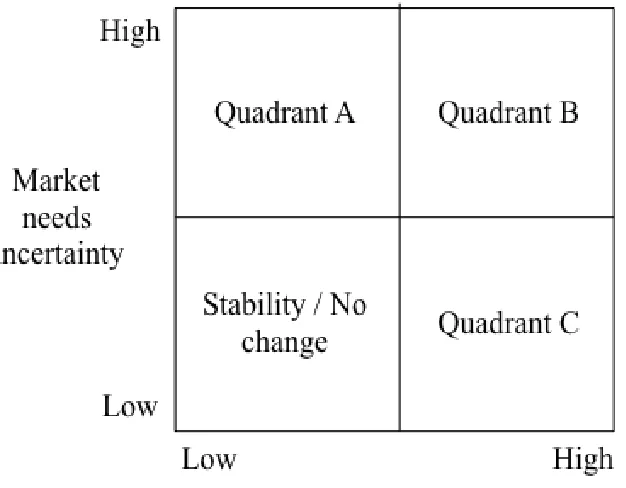
To facilitate analysis, the degree of environmental uncertainty is dichotomized
into low and high levels along the two axes representing market needs uncertainty and
technological uncertainty types (See figure 1-1). The resulting model describes four
different types of environments. In the upper right hand corner, quadrant B, both market
needs and technology uncertainty is high. When both types of uncertainty are high, the
environment described is typically that of a product market in its infancy before a
dominant design has emerged (Abernathy, 1978). Despite the lack of a dominant design,
there significant activity may be observed in this environment. This kind of market is
typically described by large numbers of small competitors, a large variation in the
products in the market, and generally low sales volume. Geroski’s (2003) analysis of the
American automobile industry provides such an example. The Ford Model T represented
a dominant design that drastically changed the entire industry. Approximately 400 firms
of these were operating in 1907 (Geroski, 2003). Both technological and market needs
were quite uncertain during this period before the Model T was introduced. However
after its introduction, uncertainty regarding market needs as well as uncertainty regarding
production technology were both greatly reduced. Consequently, the number of
manufacturers declined and industry sales grew rapidly.
The lower left-hand quadrant represents a stable environment with no significant
uncertainties. Product markets in this quadrant are typically long established industries.
Examples of these kinds of industries include rail transport and dry cleaning.
FIGURE 1-1
The upper left hand corner, quadrant A, describes a situation where uncertainty
surrounding market needs is high but technological uncertainty is low. Such an
environment can be the result of an external shock that changes demand in a previously
developed product market. Alternatively this situation can arise when a proven
technology is applied to an unknown market need. A large regulatory change, for
instance banking deregulation, is an example of an external shock. Regulation can
prevent the firm from using different levers such as pricing and accessibility, thereby
making it impossible for the firm to explore (and exploit) latent market needs through
market interaction. Accordingly, when regulation is removed, the market needs may
appear to change dramatically, when in fact they are just reverting to latent needs that
could not be met due to regulation. The situation where a proven technology is
introduced into an undeveloped latent market would also be categorized into this
quadrant. The introduction of microwave technology - originally developed in the
military - into restaurant and consumer cooking appliance usage is one example of this
situation. Raytheon engineers knew that microwave energy could be used to heat objects,
but they didn’t know much about non-military customer needs that could be addressed
using this capability. Cooking was an application of heating technology. After entering
this application market, Raytheon had to discover the customer needs for microwave
cooking. For example, they did not originally have answers to basic questions such as:
how big should the oven be? how powerful? at what price level would it start to be
attractive (Hammack, 2005)?
In the lower right hand quadrant technological uncertainty is high, quadrant C, but
way to best meet these needs is not. This description fits what Helfat and Raubitschek
(2000: 965) termed a “replacement product market.” Frequently, this situation occurs
when newly developed technologies vie for satisfying a need previously met by an earlier
technology. For example, the basic need to be able to listen to music where and when
wanted has been known for some time, however the industry went through several
periods of high technological uncertainty as numerous technologies, each with its own
benefits and drawbacks, have vied to be the portable music playing technology of choice.
As a result, new portable audio technologies have replaced existing ones over time.
Cassette players were largely replaced by Compact Disk players, which in turn were
largely replaced by hard drive based mp3 players and later DRAM based mp3 players.
For the purpose of building this model, the levels of customer needs uncertainty
and technological uncertainty were dichotomized. This simplification facilitated
categorization and analysis of the different situations represented by the four quadrants.
It also enables identification of option usage patterns expected to outperform alternatives
for each quadrant. The ability to classify industries is important to the research process
here in that it allows focus and reduction of alternative hypotheses.
However, at the same time it is important to note that uncertainty levels are not,
strictly speaking, binary in nature (i.e., low or high) but rather belong somewhere along
some continuum. Uncertainty levels change over time and can result in movement
between the quadrants when they are large, and more nuanced movement within a
quadrant when small. Also, unlike risk in financial markets, levels of customer needs
uncertainty and technological uncertainty are affected by firms’ investments. For
been supplied results in feedback from the market and changes the uncertainty of
demand. While time resolves risks in financial markets, action reduces the types of
uncertainty discussed here.
Real options reasoning suggests firms hold options to manage uncertainty. Since
the kind and type of uncertainty differs between the different quadrants in the model, the
type of options held by the firm following real options logic in each quadrant would also
differ. The firm following real options reasoning reduces the likelihood of unwanted
performance outcomes, but this benefit does not come without cost. Developing and
holding options is expensive, which in turn has performance implications.
Full Commitment and Survival Bias
In each environment the single highest performing firms may be those that made
winning bets on market and technologies in advance and held no options, if there were
such lucky firms. Conversely, the firms that made incorrect bets in their full
commitments to both are likely to exhibit the worst performance. These groups of firms
may be effectively thought of as representing one type – full strategic commitment to
both technologies and needs. These firms serve as exemplars of what Raynor (2007:1)
terms “the strategy paradox.” Both groups make bold strategic commitments, which
result in high performance when the firm guesses right and poor performance or exit
when the firm guesses incorrectly.
Consider the introduction and evolution of the videocassette recorder business
Market needs were largely unknown. What premium would customers put on higher
picture and sound quality? How would consumers use it: for watching prepackaged
videos or time shifting over the air TV shows? Sony and Matsushita both made
commitments based upon specific guesses of what customers would value. Sony bet that
high picture and sound quality would be worth a price premium to consumers and that
consumers would use the machines for time shifting. It developed Betamax. Matsushita
bet customer needs would be greater for lower cost, lower picture quality machines with
longer recording and playback capabilities capable of recording feature length films.
Matsushita developed VHS. As the market developed, VHS won over Betamax. Sony
stopped making Betamax and eventually licensed VHS. Neither firm could have known
what would happen prior to product introduction. Sony’s bet on Betamax was not stupid,
it was just unlucky. It is unlikely Matsushita was prescient, rather it was lucky in this
case.
The extreme performance outcomes of firms making strategic commitments
increases the possibility for attribution bias and survivor bias in research topics such as
this one. In the case of the firm guessing successfully, it would be a mistake to attribute
the performance solely to their approach. In order to see whether such firms actually
have consistently high performance, as opposed to being lucky at one point in time, they
need to be studied over time. Frequently, the firm that is unlucky in its commitments
exits. Most research methods do not correctly identify or investigate firms that do not
survive. Accordingly they risk mistaking the relationship between the firm’s actions and
its performance. Further complicating this picture is the tendency of firms that survive
rate (Levinthal, 1991). Firms with past successes may be buffered from current troubles
by their organizational capital, financial and otherwise (Levinthal, 1991). This means
that they may exhibit relatively high long-term performance at the firm level even though
specific commitments that they make may sometimes fail.
While these issues could be serious in a cross sectional study design, they are
reduced by a design that considers firm and industry attributes and performance over
time, as a string of luck is far less likely than a single lucky hit. A study design that
covers an industry also has the benefit of capturing exit in addition to performance of
firms that stayed in the industry. Accordingly, the research approach followed here
addresses the survival bias issue by looking at a whole industry over an extended time
period.
Width and Depth of Real Options Portfolios
This research identifies portfolios of real options, relating to technologies, held by
firms in a single industry. The width and depth of these portfolios is important as these
portfolios can take a variety of shapes. These different shapes will have different cost
structures and implications about the relative flexibility they offer.
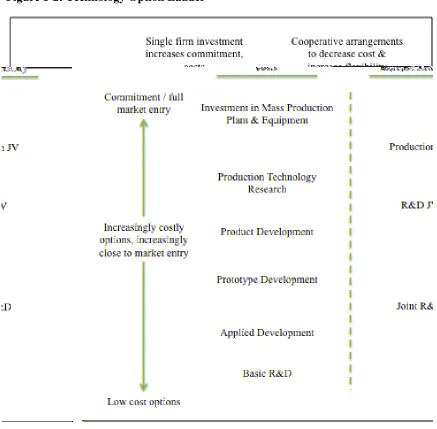
Investments in technologies can be conceptualized as belonging to different levels
relating to the degree of commitment, flexibility gained, and proximity to market entry
they reflect. The metaphor used below is that of an option ladder, where higher rungs
commitment and market entry. Figure 1-2 below illustrates a simple technology option
ladder.
Figure 1-2: Technology Option Ladder
Each additional option generated increases the value of the previous options in the
same technology (e.g., McGrath & Nerkar, 2004). At the bottom of the ladder, several
the ladder increases the proximity to a product market, but at an increase in cost and a
decrease in flexibility. At the top of the ladder is investment in mass production plant
and equipment. The cooperative arrangements to the right of the ladder represent ways
firms can reduce required investment levels and share risk while increasing their
proximity toward the market. Firms holding options on a single technology at many
levels of this ladder are considered to have a “deep” portfolio of options in this
technology.
The existence of multiple competing technologies is indicative of high
technological uncertainty. Creating options on competing technologies increases the
breadth of options held by the firm. A firm with all of its options on a single technology
can be characterized as holding a narrow portfolio, whereas a firm holding options on a
large number of competing technologies can be said to have a wide portfolio.
Propositions
This section develops theory and introduces propositions based there upon. As
discussed in the following chapter on research methods, the current research is only able
to address a portion of the propositions introduced below because it focuses on one
combination of uncertainty levels mirroring one of the quadrants in the environmental
model. Failure to include propositions relating to other uncertainty level combinations
would naturally raise questions in the reader’s mind. Accordingly, the propositions are
This research seeks to consider several basic questions about real options
reasoning. First, do firms behave as real options reasoning (ROR) would predict?
Second, do firms behaving as prescribed by ROR enjoy performance benefits over those
not behaving as prescribed?
Real options reasoning predicts that firms will hold options in the face of
uncertainty (e.g., Bowman & Hurry, 1993; McGrath, 1997). Published empirical
research seeking to test this prediction is almost non-existent. The one exception,
McGrath and Nerkar’s (2004) study of patenting behavior in the pharmaceutical industry,
found firms behaved in a manner consistent with ROR. However, one single-industry
study is not enough to sufficiently support or refute this prediction. Accordingly
additional research is required.
This dissertation develops theory based upon the existence of two types of
uncertainty: market needs uncertainty and technological uncertainty. It develops a model
with four combinations of high and low levels of these two uncertainty types. ROR
would predict firms hold different portfolios of options based upon which quadrant they
are in. For example, if technological uncertainty is high, ROR would suggest firms hold
technology options, but if low ROR would predict firms not hold technology options.
Given this general framework, there are several potential analytical approaches
that could be used to consider ROR’s prediction. Comparison of the ratio of different
options types (e.g., customer needs options versus technological options) held by firms in
a single industry, would at first appear to be a suitable approach. However, customer
compare across the two types are likely to lead to misleading or difficult to interpret
results. Another potential analytical approach would be to compare between options
portfolios held by firms in industries belonging to different quadrants in the model.
However, without some major methodological breakthrough (e.g., discovery of a high
quality, easy to measure, accessible proxy measure for options held), this approach would
necessitate a research project much larger in scope than this one.
Rephrasing the question as: “Do firms generate and hold options in the face of
uncertainty?” provides an alternative way to approach the issue; that is, to ascertain
whether firms hold options relating to the type of uncertainty they face. The question,
thus stated, does not require analysis between different types of uncertainty, but is
nonetheless in line with theory. To control for the level and type of uncertainty, firms
studied should belong to a single industry. Propositions stated below relate to the
quadrants in the model where one uncertainty type is low and the other high.
P1*1
1
Asterisks mark those propositions addressed by empirical research in this dissertation.
: If firms belonging to a single industry exhibiting high technological
uncertainty and low market needs uncertainty follow real options
reasoning, they will, all else equal, hold options on more than one
P2: If firms belonging to a single industry exhibiting low technological
uncertainty and high market needs uncertainty follow real options
reasoning, they will, all else equal, hold options on more than one
competing market need.
Real options reasoning predicts firms in the low-low quadrant would hold no
options and the high-high quadrant (quadrant C) would hold options on both market
needs and technologies. Propositions are not developed for these quadrants. The
high-high case may include complex hybrid options, which although of interest, are beyond
the scope of this research.
Performance depends on how well the firm manages uncertainty, or in other
words, how well the mixture of commitments and options the firm holds fit with the
environment in which it operates. Looking retrospectively it is possible to categorize the
firm’s commitments and options portfolios as well as the level of revealed market needs
and technological uncertainty. Firms that made commitments in the face of uncertainty
are expected to exhibit performance extremes, and firms that made commitments in the
face of certainty and held options in the face of uncertainty to exhibit more consistent
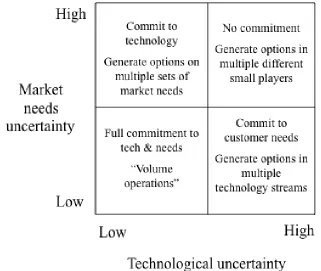
performance. Figure 1-3 depicts the mixture of commitment and options this line of
FIGURE 1-3
Uncertainty Levels and Best-fitting Uncertainty Management Approach
The lower right quadrant (quadrant C of the environment types model) of figure
1-3 above depicts a situation where needs are certain but technology is not. Here, firms
committing to market needs and holding options on technologies are expected to
outperform other firms when compared as groups. Firms making commitments to
technologies in the face of uncertainty may exhibit higher performance than those
holding options, but only when they are lucky enough to have committed to a bet that
later paid off. Those firms making commitments which were not lucky would be left
holding expensive, difficult to reverse investments that have small or no payoffs.
Accordingly, they will exhibit low performance and may exit the market. Together, those
firms making technology commitments in the face of technological uncertainty are
industry competitors holding options, occasionally a firm will be lucky and exhibit very
high performance.
P3*: In the face of technological uncertainty, firms making substantial
commitments to single technologies will exhibit the highest performance
and lowest performance in their industry.
Firms developing and maintaining options on multiple competing technologies
will have the opportunity to select the most appropriate technology as technological
uncertainty is resolved over time, while having limited exposure to the downside on the
technologies that did not pan out in the end. Technology options can be created through
in-house investment in multiple R&D streams, licensing technologies developed by other
firms, entering into joint ventures or other equity based investments with firms
developing competing technologies. By committing to market needs, these firms will
develop a greater understanding of market needs than outside firms, and will also benefit
from markets being familiar with their branding.
P4*: In the face of technological uncertainty, firms that commit to a
market need and generate options on multiple technologies to fulfill these
needs will not exhibit performance extremes when compared to other
Propositions P3 and P4 considered the situation in an environment characterized
by high levels of technological uncertainty and low levels of market needs uncertainty.
The upper left hand quadrant of figure 1-3 above describes an environment of high
market needs uncertainty and low technological uncertainty, analogous with quadrant A
of the environment types model. As a group, the most successful firms in this quadrant
will commit to a technology and create options on product-markets where the technology
may potentially be useful. These options may take one of several different forms,
including working with multiple marketing partners, expeditionary marketing, and rapid
cyclical product development to clarify needs in a particular market (Hamel & Prahalad,
1991). Firms that bet on a single customer need, rather than holding options on several,
face a greater chance of betting on one that never materializes. This was the case with
Sony’s bet on Betamax VCR already discussed. Sony made one bet on market needs for
VCRs. This bet was that market needs for VCRs would be for high picture and sound
quality for use in time shifting over the air TV shows. Sony guessed wrong and the
Betamax was beaten by VHS in the marketplace.
Similar to the case with technological uncertainty, those firms making lucky bets
on market needs are expected to exhibit high performance because they do not have the
cost of developing and maintaining options but gain the benefit of access to the market
need that emerge. Those making unlucky bets and not holding options are expected to
exhibit low performance and may exit. Rephrasing this logic into proposition form, P5
below states firms making market needs commitments in the face of market needs
uncertainty will exhibit two performance extremes, high and low, when compared with
will have the highest performance; meanwhile firms making commitments based upon
guesses that were not lucky are expected to exhibit very low performance, including exit.
P5: In the face of market needs uncertainty, firms exhibiting the highest
performance and lowest performance in their industry will have previously
made commitments to market needs.
P6 predicts the situation for firms developing and holding market needs options in
the face of market needs uncertainty. Developing and maintaining multiple market needs
options is costly, therefore these firms are not expected to exhibit as high performance as
those that make lucky singular commitments. However, by holding options on multiple
competing market needs, these firms increase the odds that some of the options will
eventually become “in the money.” Accordingly, the likelihood of extremely low
performance is much less than that of the committing firms discussed in P5.
P6: In the face of market needs uncertainty, firms that commit to a
technology and hold options on different market needs applications will
not exhibit performance extremes when compared to other firms in their
The propositions above have considered the two quadrants of the model where
one uncertainty type is high and the other low. Firms facing an environment in which
both market needs and technologies are highly uncertain, as in the upper right hand
quadrant, will benefit from developing both market and technology options. This may be
achieved by holding multiple hybrid options, each of which represents a different
combination of commitments to market needs and technologies. Examples of such
options include ownership positions in multiple competing startup firms or equity based
investments or joint ventures with existing firms (Folta, 1998; Hurry et al., 1992). This
type of environment is complex as are the potential hybrid options. While of interest, this
quadrant does not present an opportunity to isolate and study one of the two uncertainty
types discussed here. For these reasons, detailed theorizing relating to options behavior
and performance for environments represented by this quadrant is left for future research.
This section has developed and introduced propositions based upon real options
reasoning. The empirical research in this dissertation is comprised of a historical case
study of the flat panel (FP) TV industry, for reasons discussed in Chapter two (See
Method Choice and Industry Selection Requirements sections). The FP TV industry
aligns well with quadrant C of the model. This research does not include other quadrants
of the model. The empirical research in this dissertation applies to the propositions